


TikTok in Latin America looks different from TikTok elsewhere. It is the only region in Influencity's 2026 data where TikTok's estimated audience is larger than Instagram's, and where its creator-density advantage over Instagram is small. It is also far less concentrated than Instagram: Brazil holds 38.1% of TikTok creators against 66.2% of Instagram creators, while Mexico, Peru, Ecuador and Guatemala carry much larger TikTok pools than their Instagram ones. [1, 2]
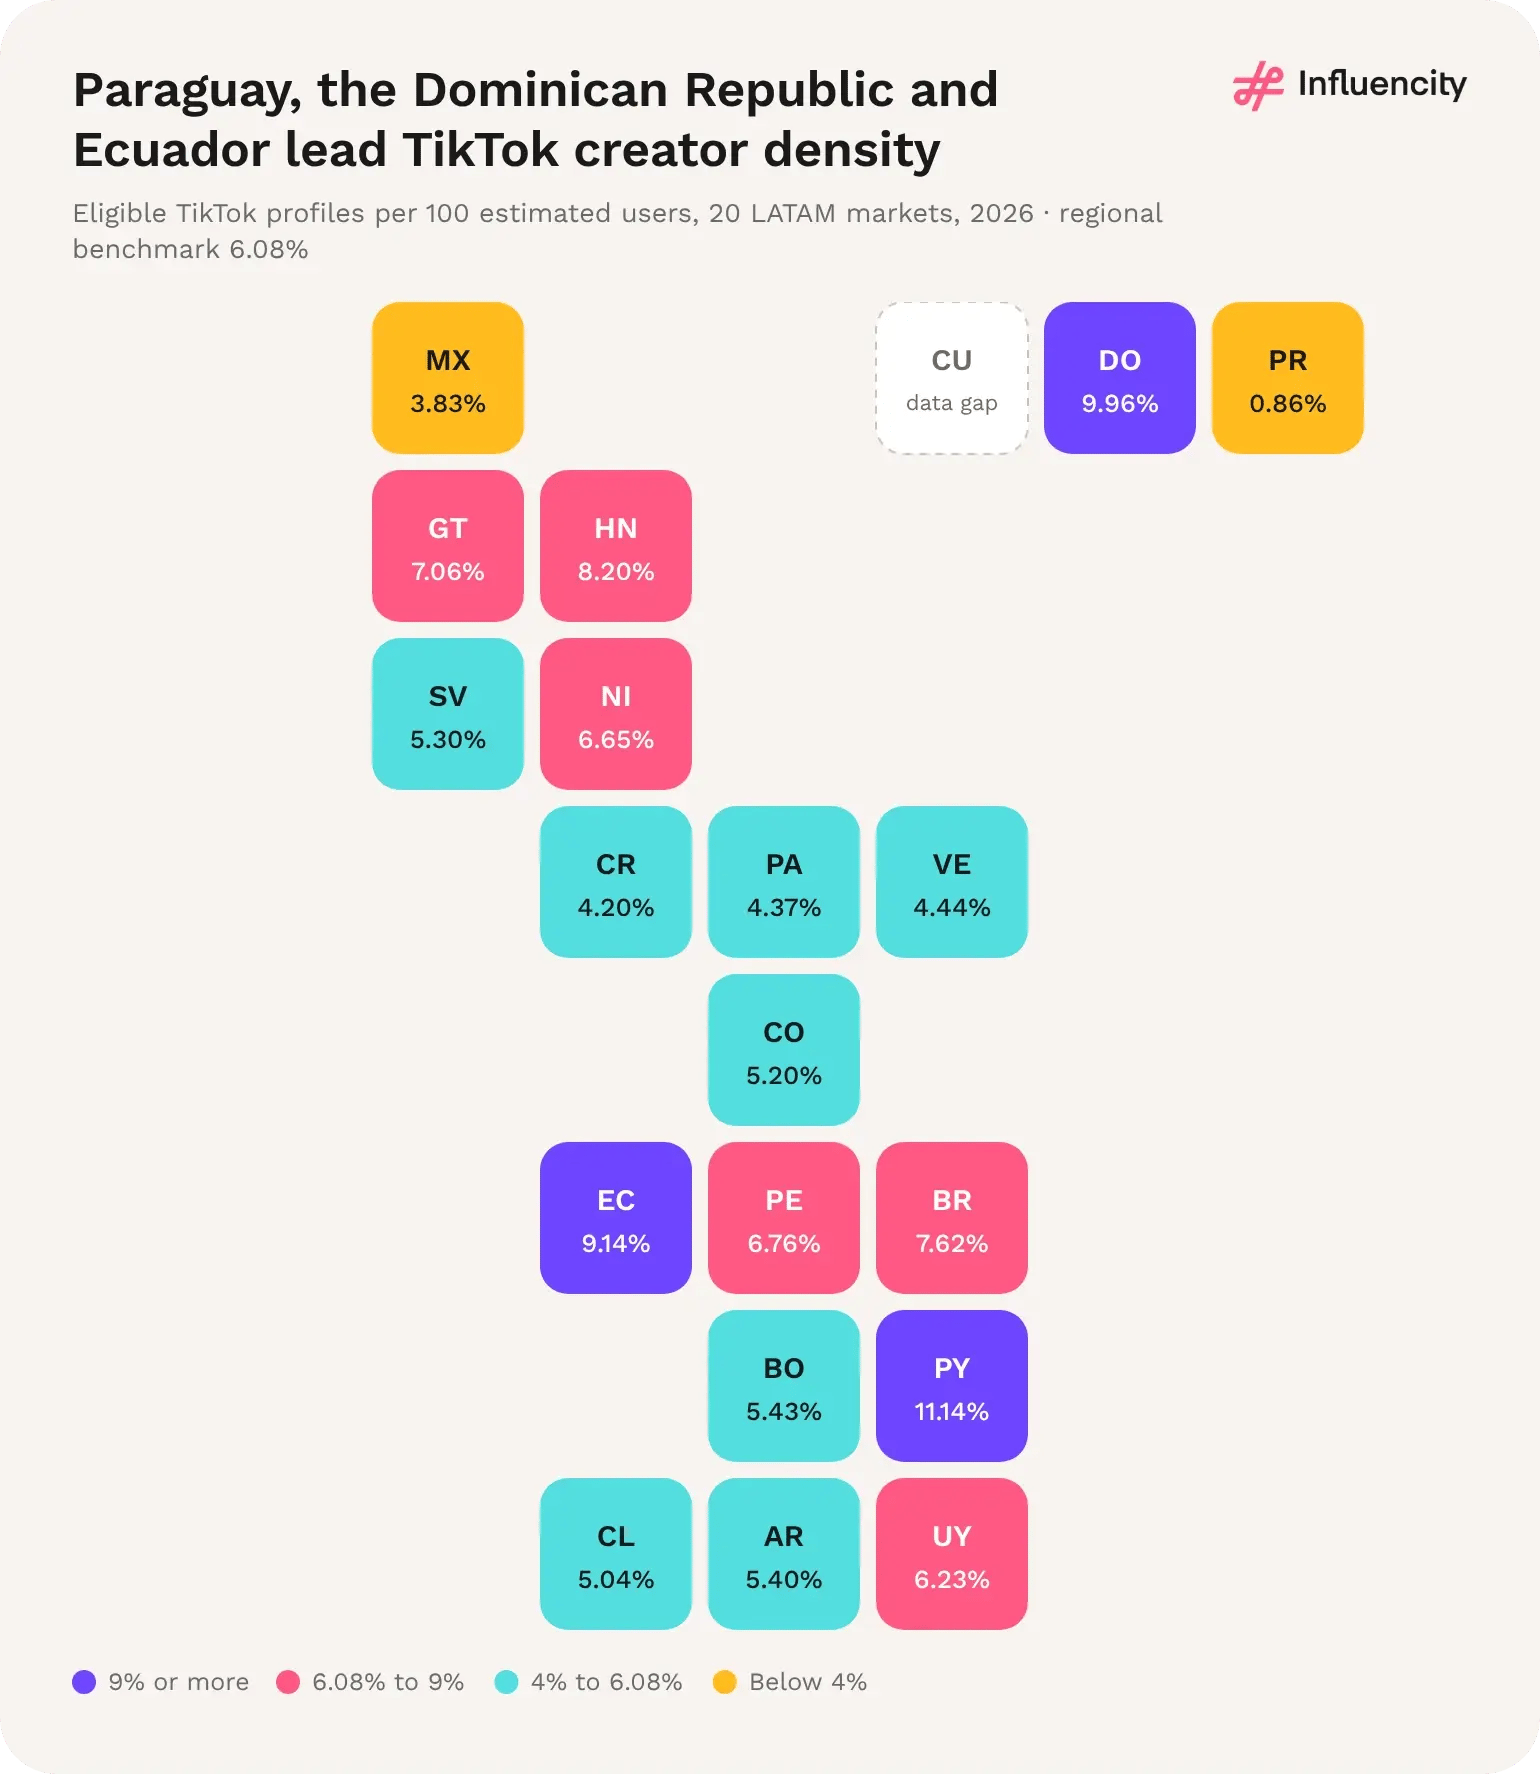
Figure 01 → TikTok creator density across the 20-market footprint, 2026. Profiles are not unique people; markets outside the footprint are not shown. Source: [1].
Latin America has an estimated 431.0 million TikTok users and 26.23 million influencer-eligible TikTok profiles across 20 markets, according to Influencity's 2026 data collected in October–November 2026. That is one eligible profile for every 16.4 estimated users, a creator density of 6.08%. [1]
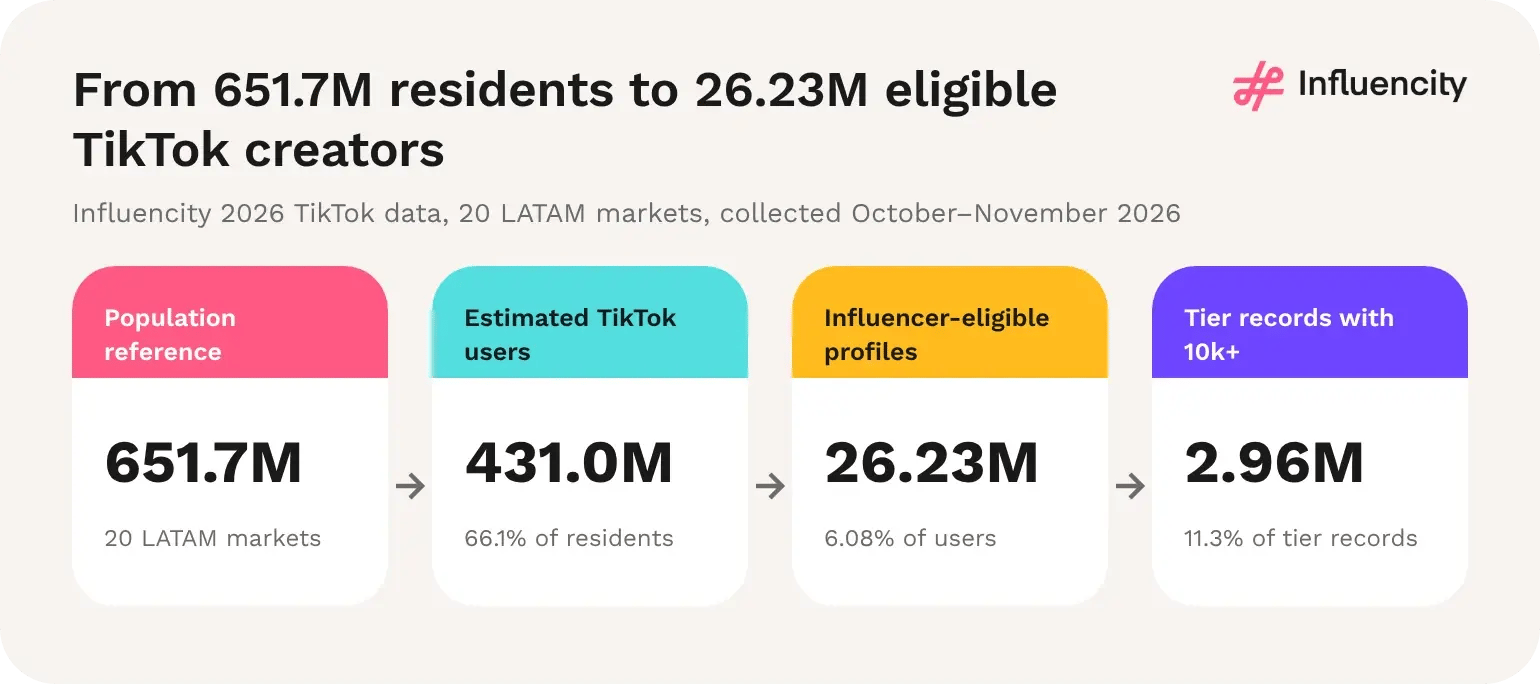
Figure 02 → The LATAM TikTok market in four steps: population reference, estimated users, eligible profiles and tier records with 10,000+ followers. Bolivia population reference corrected. Source: [1].
Estimated TikTok users: 431,043,500 across 20 Latin American markets, equal to 66.1% of the 651.7 million population reference (Influencity, 2026). [1]
Influencer-eligible TikTok profiles: 26,226,153 in the same 20 markets, recorded accounts rather than unique people (Influencity, 2026). [1]
Creator density: 6.08 eligible profiles per 100 estimated TikTok users, the lowest of Influencity's three 2026 TikTok regions (US 9.46, Europe 8.48). [1, 4, 5]
Influencers per resident: 40.2 eligible profiles per 1,000 residents, close to the US (42.2) and above Europe (31.9). [1, 4, 5]
Larger accounts: about 2.96 million tier records have 10,000 or more followers, 11.3% of all tier records. [1]
Gender classification: 85.0% of profiles are classified as male or female; 65.9% of those are female. [1]
Latin America's estimated TikTok audience is 2.8 times the US figure (153.0M) and 1.7 times Europe's (252.3M), but its creator pool is only 1.8 times the US pool (14.47M) and 1.2 times Europe's (21.40M). Audience scale outpaces creator supply, so each eligible LATAM creator sits against a larger estimated audience: 16.4 users per profile, against 10.6 in the US and 11.8 in Europe. [1, 4, 5]
Per resident, the picture reverses. LATAM records 40.2 eligible profiles per 1,000 residents, almost level with the US (42.2) and well above Europe (31.9). The region is not short of creators; it has unusually many TikTok users. [1, 4, 5]
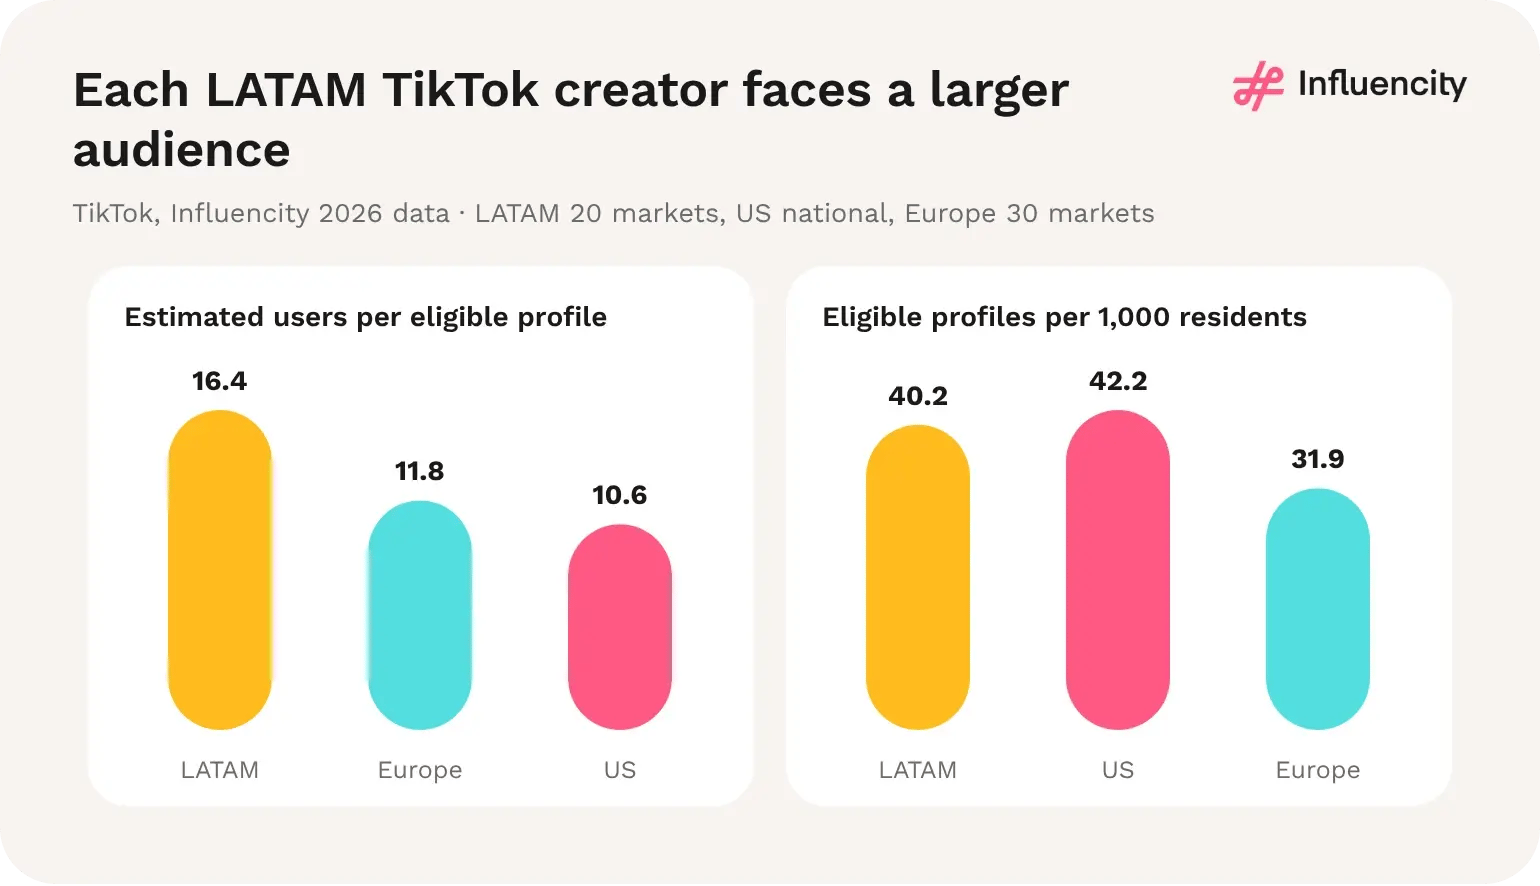
Figure 03 → Estimated users per eligible profile and eligible profiles per 1,000 residents, TikTok 2026. LATAM 20 markets, US national, Europe 30 markets. Sources: [1, 4, 5].
1. The audience, not the creator count, sets LATAM apart. Estimated TikTok users equal 66.1% of the population reference, against 44.6% in the US and 37.7% in Europe. That large denominator is why LATAM's creator density is the lowest of the three regions even though its creator pool is the largest. [1, 4, 5]
2. Brazil and Mexico are half the market on every measure, but not in the same way. Together they hold 53.5% of the population reference, 53.4% of estimated users and 52.5% of eligible profiles. Brazil's share of profiles (38.1%) exceeds its share of users (30.4%); Mexico's share of users (23.0%) is well above its share of profiles (14.5%). Mexico has the audience; Brazil has the deeper creator supply. [1]
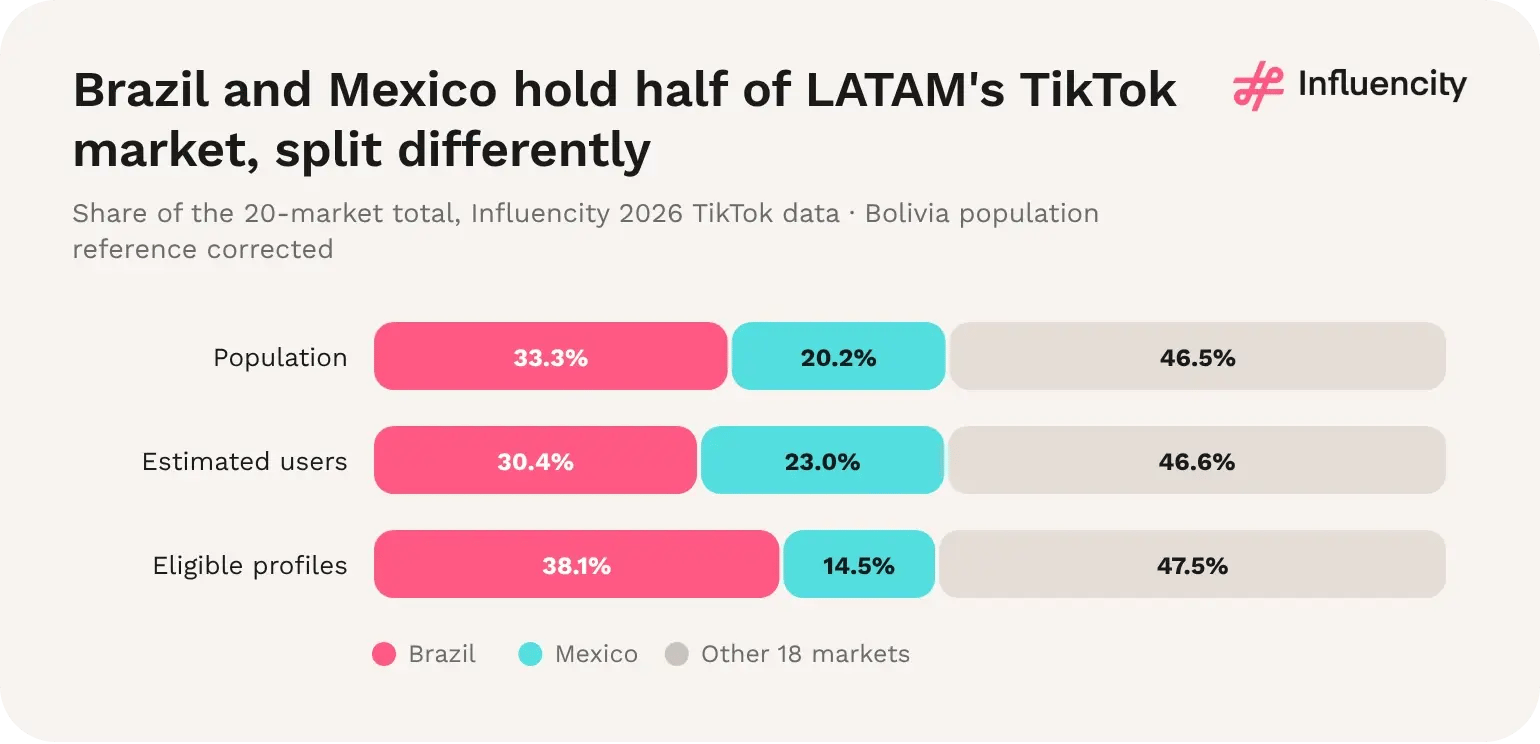
Figure 04 → Brazil's and Mexico's shares of LATAM population reference, estimated TikTok users and eligible profiles, 2026. Source: [1].
3. The pool is broad at the base and thin at the top. Nano entries (1,000–10,000 followers) make up 88.7% of tier records; only 16,584 entries have 1 million or more followers. Relative to audience, LATAM has 621 micro, 62 macro and 3.8 mega profiles per 100,000 estimated users, the lowest of the three regions on each tier. [1, 4, 5]
4. Classification coverage is unusually high. Only 15.0% of LATAM TikTok profiles have no gender classification, against 17.7% in the US and 22.6% in Europe, so gender-based planning in LATAM rests on a larger classified base. [1, 4, 5]
5. Penetration figures depend on the population reference. With Bolivia's reference corrected to 12,674,000, estimated users equal 66.1% of the population; an uncorrected reference would give 56.3%. Any penetration statistic should be quoted with its population source. [1, 2]
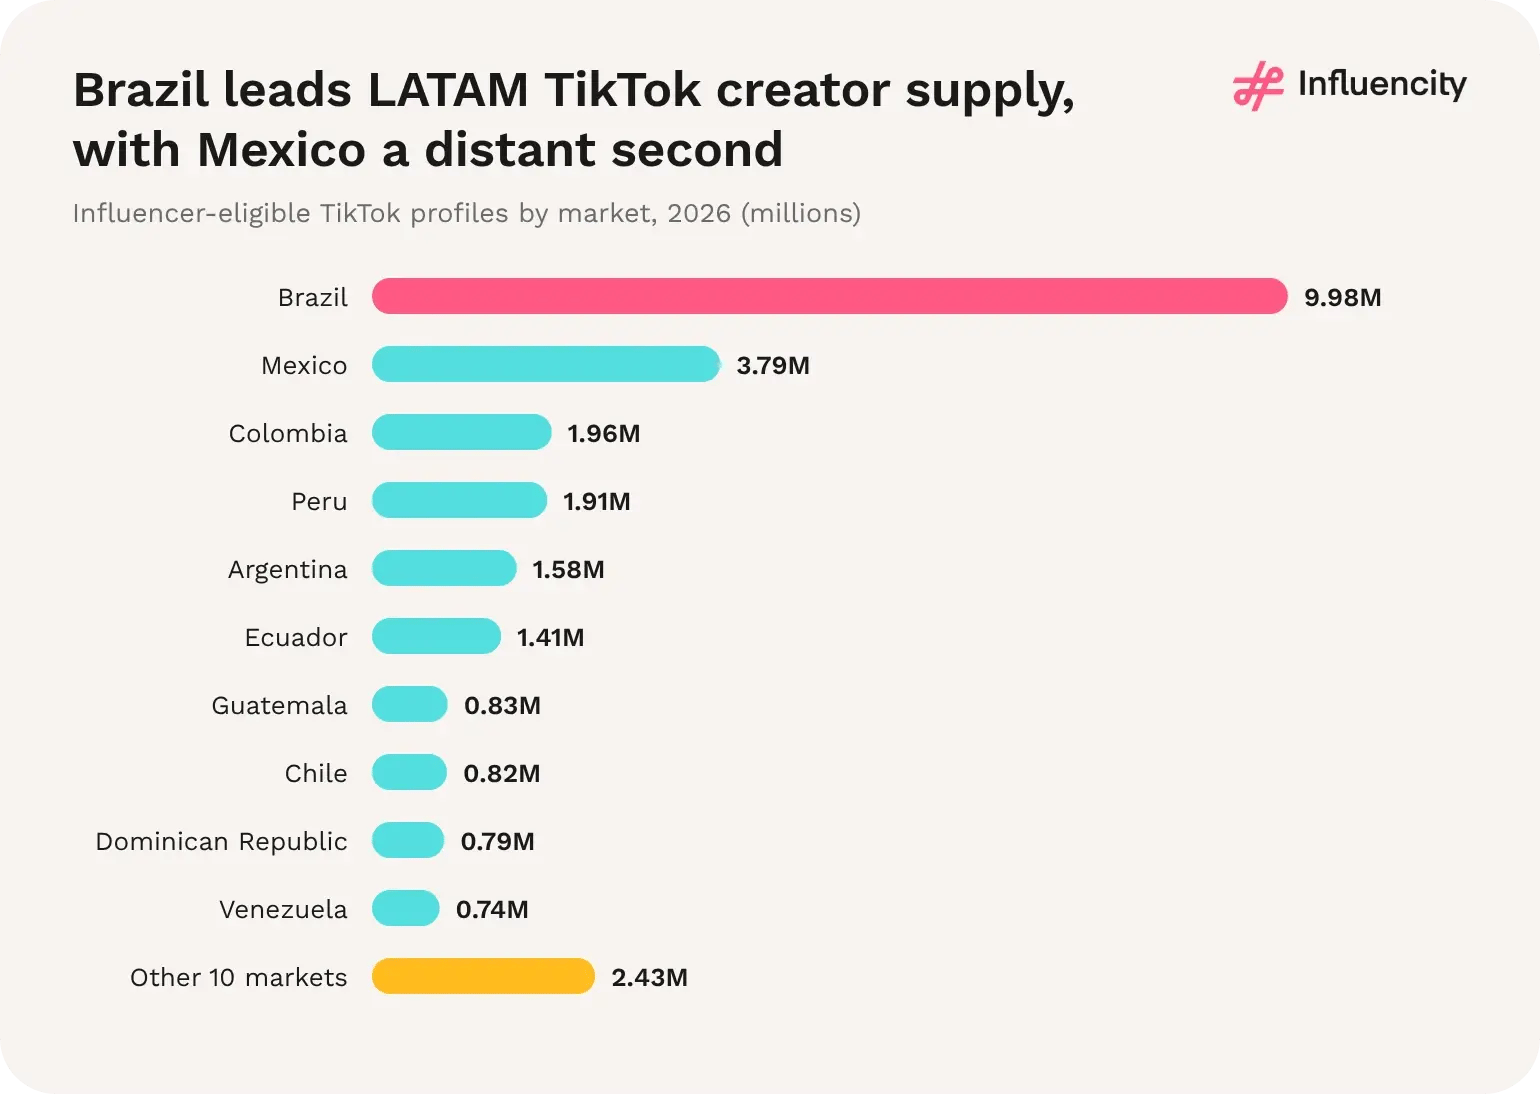
Figure 05 → Largest TikTok creator markets by eligible profile count, 2026, with the other ten markets combined. Source: [1].
Several Andean and Central American markets rank far higher on TikTok than on Instagram: Peru is fourth (eighth on Instagram), Ecuador sixth (ninth) and Guatemala seventh (fourteenth). A TikTok roster for Spanish-speaking LATAM therefore starts from a much broader set of markets than an Instagram one. [1, 2]
Brazil has the most TikTok influencers in Latin America, with 9,980,579 eligible profiles (38.1% of the regional pool) in Influencity's 2026 data, collected in October–November 2026. Mexico is second with 3,793,376 profiles (14.5%), followed by Colombia, Peru and Argentina. The five largest markets hold 73.3% of the 26.23M eligible LATAM TikTok profiles. [1]
Grouped by sub-region, the Andean markets (Colombia, Peru, Ecuador, Venezuela and Bolivia) hold 6.53M eligible TikTok profiles, 24.9% of the regional pool and second only to Brazil. On Instagram the same five markets hold just 9.3%. Central America holds 7.9% of TikTok profiles against 2.1% on Instagram, while the Southern Cone is the only sub-region whose TikTok share (11.7%) is below its Instagram share (15.1%). [1, 2]
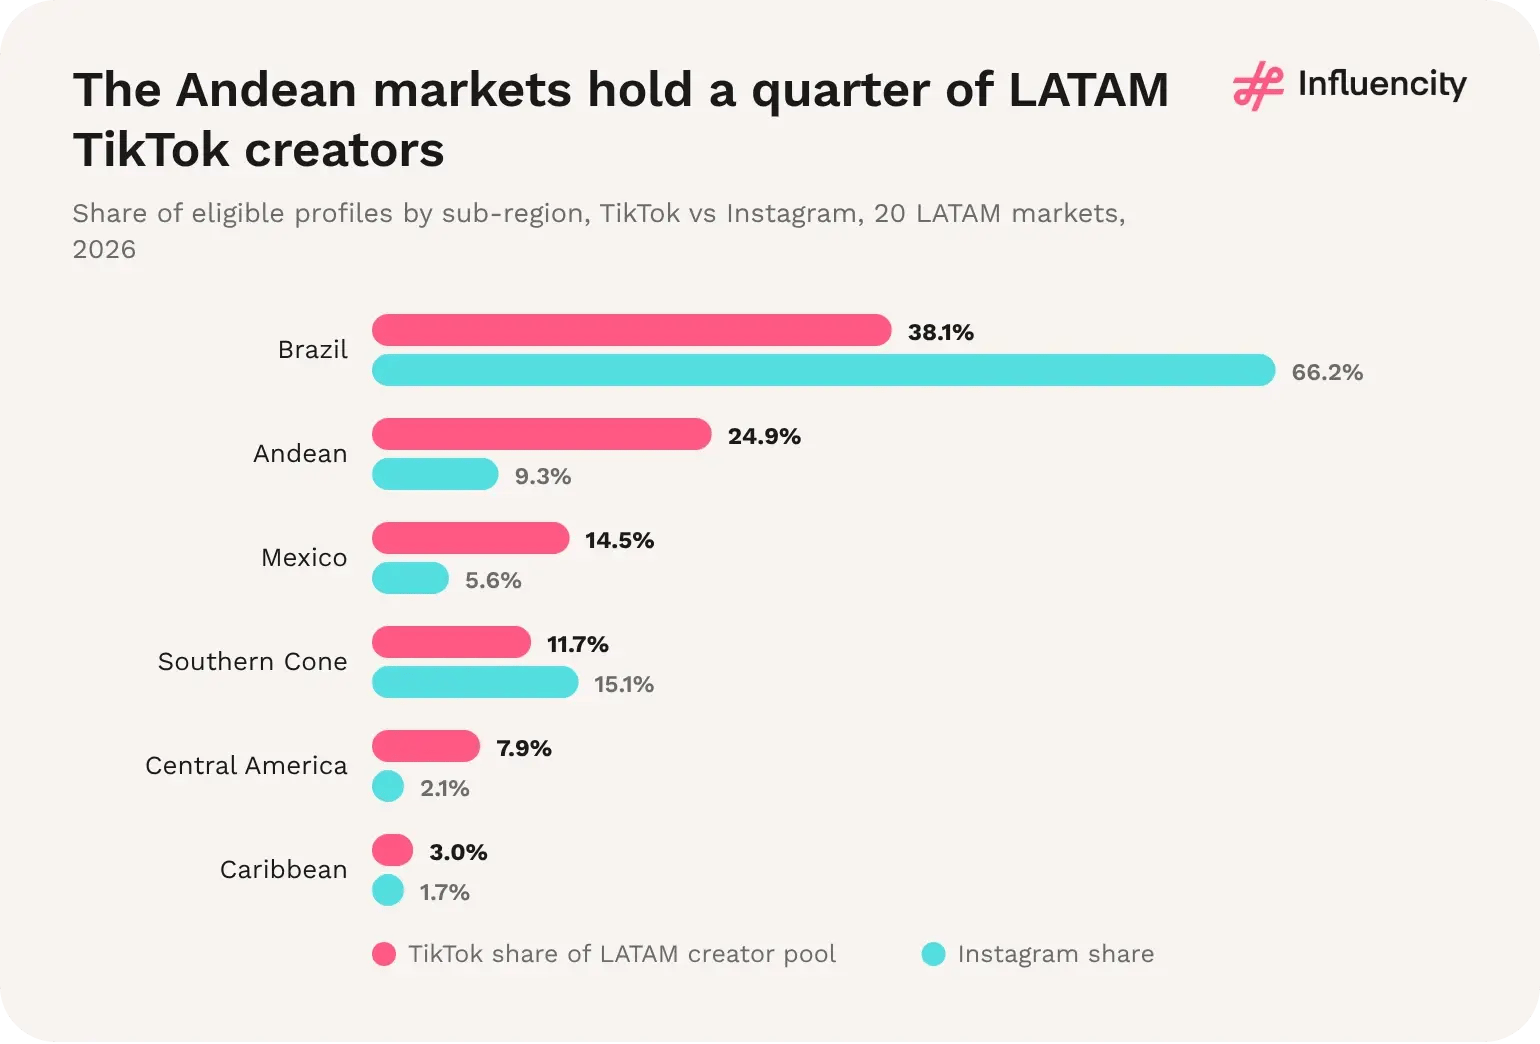
Figure 06 → Share of eligible TikTok and Instagram profiles by sub-region, 20 LATAM markets, 2026. Andean: Colombia, Peru, Ecuador, Venezuela, Bolivia. Southern Cone: Argentina, Chile, Uruguay, Paraguay. Central America: Guatemala, Honduras, El Salvador, Nicaragua, Costa Rica, Panama. Caribbean: Dominican Republic, Puerto Rico, Cuba. Sources: [1, 2].
Largest market: Brazil, with 9,980,579 eligible TikTok profiles, 38.1% of the 20-market LATAM total (Influencity, 2026). [1]
Spanish-speaking LATAM: the 19 Spanish-speaking markets hold 16,245,574 eligible TikTok profiles, 61.9% of the regional pool and more than the entire US TikTok pool (14.47M). [1, 4]
Market depth: 12 of 20 LATAM markets record more than 500,000 eligible TikTok profiles, against 5 on Instagram. [1, 2]
Concentration: the top five markets hold 73.3% of profiles and the top ten 90.7%; the other ten markets together hold 2.43M. [1]
Close contest: Colombia (1,958,517) and Peru (1,911,970) are separated by only 46,547 profiles for third place. [1]
Market rankings change markedly between platforms. Guatemala rises seven places on TikTok (14th on Instagram, 7th on TikTok), Bolivia six, Nicaragua five, Peru four and Ecuador three. Panama falls seven places, Uruguay five, Venezuela four, and Argentina, Chile and Costa Rica three each. Only Brazil and Cuba hold the same position on both platforms. [1, 2]
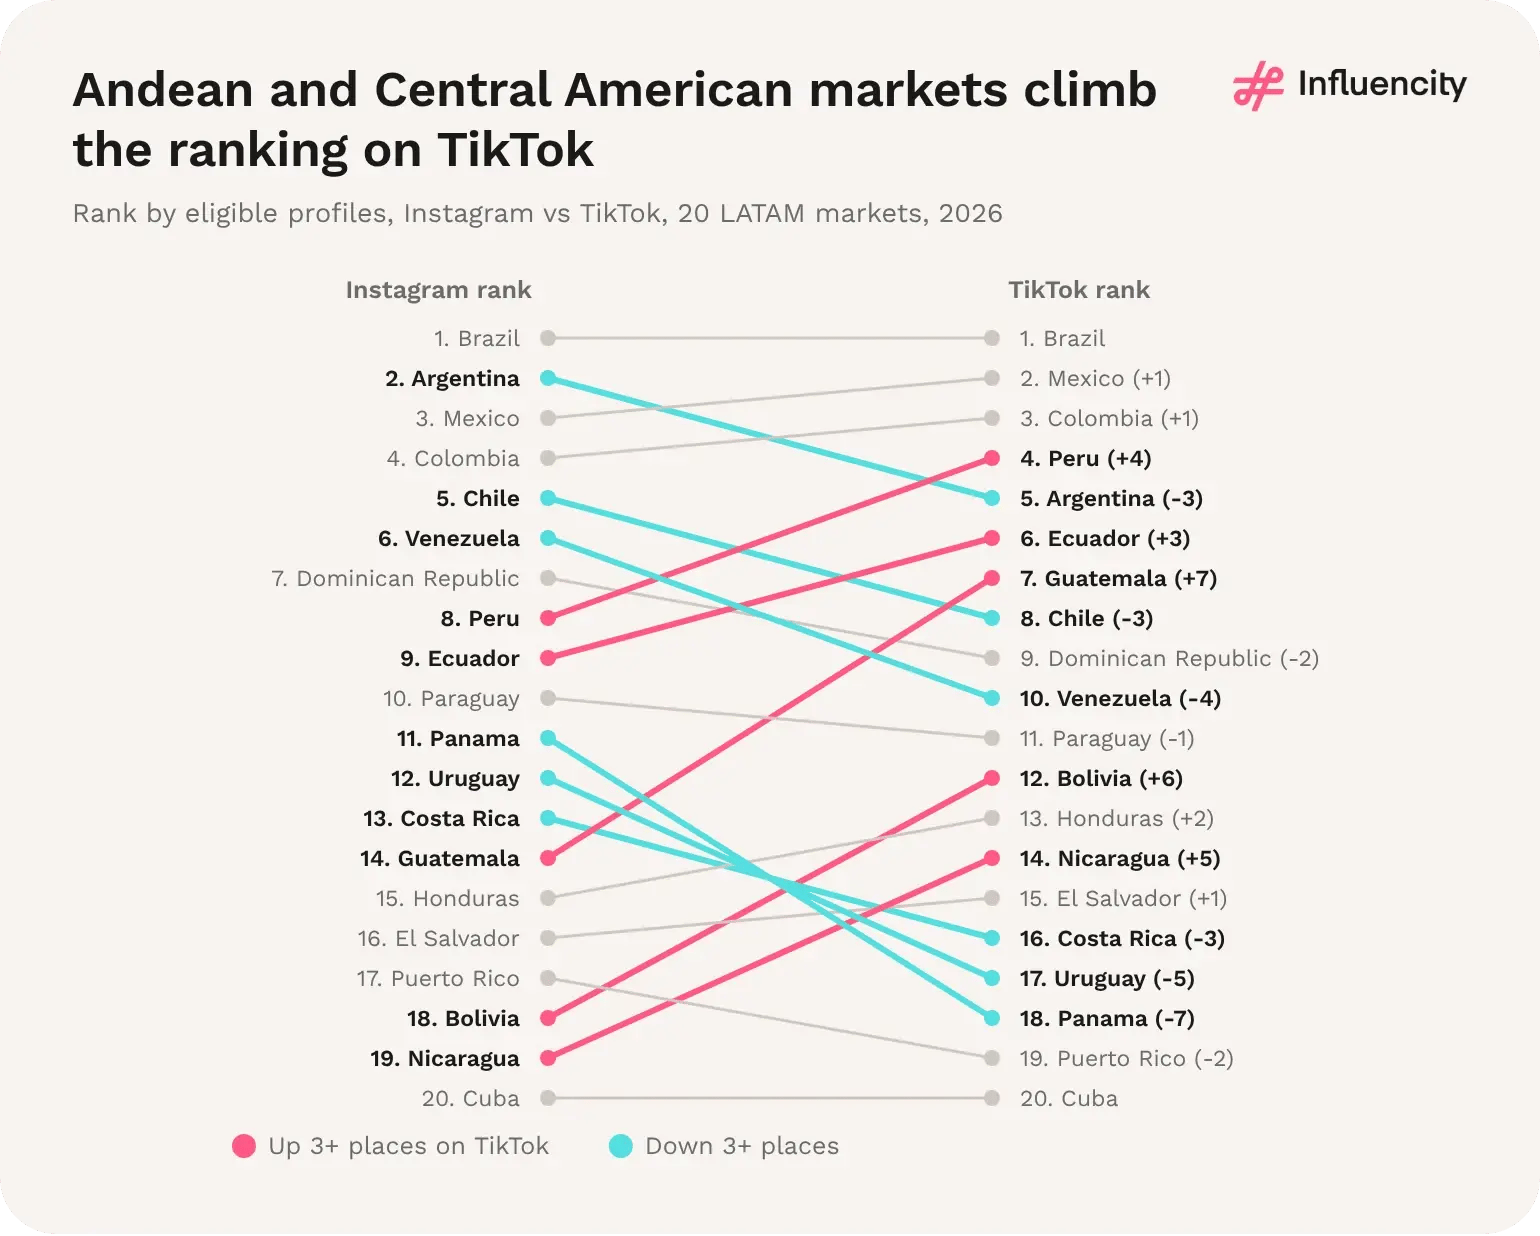
Figure 07 → Rank of each market by eligible profiles on Instagram (left) and TikTok (right), 2026. Highlighted lines move three or more places. Sources: [1, 2].
1. Spanish-speaking LATAM is a TikTok market in its own right. Outside Brazil, the region's 19 markets hold 16.25M eligible TikTok profiles, 12% more than the whole US TikTok pool. On Instagram, the same markets hold only 6.23M. [1, 2, 4]
2. The Andes are the region's second creator hub. With 24.9% of profiles, the five Andean markets together exceed Mexico (14.5%), and their combined TikTok pool is 3.8 times their Instagram pool. [1, 2]
3. TikTok supply is spread across many mid-sized markets. Six markets record between 500,000 and 1M profiles (Guatemala, Chile, the Dominican Republic, Venezuela, Paraguay and Bolivia), together 4.20M or 16.0% of the pool, more than Mexico alone. On Instagram, only two markets reach that band. [1, 2]
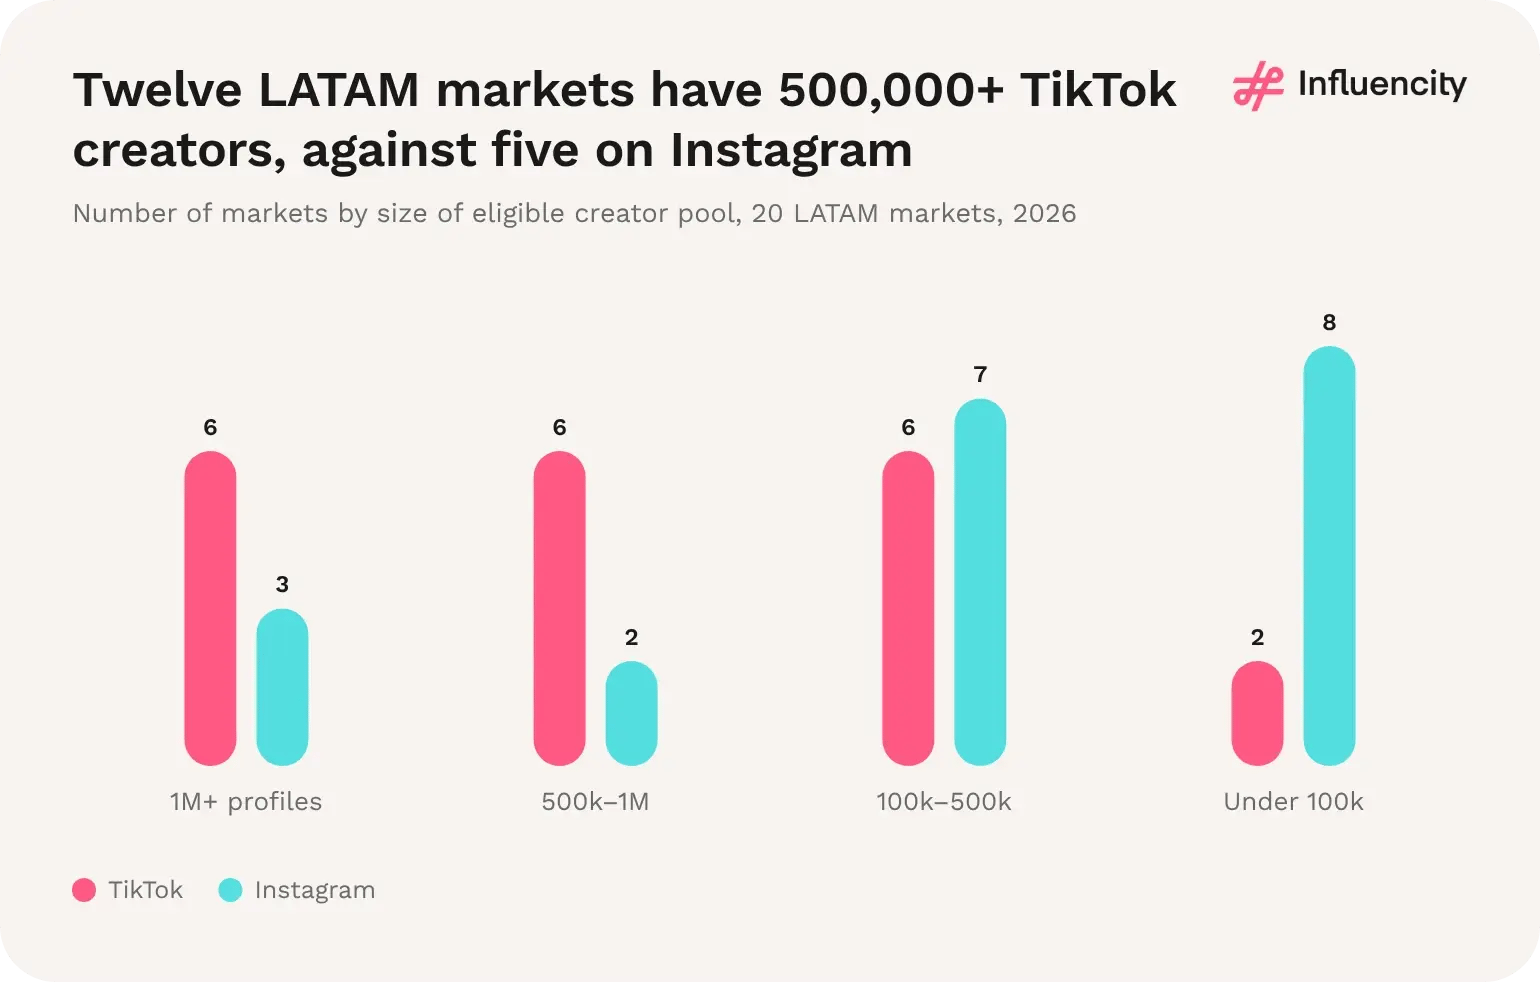
Figure 08 → Number of LATAM markets by size of eligible creator pool, TikTok vs Instagram, 2026. Sources: [1, 2].
4. Mexico's pool is smaller than its audience suggests, but deeper at the top. Mexico holds 23.0% of LATAM's estimated TikTok users but 14.5% of eligible profiles; 14.4% of its tier records have 10,000+ followers, the highest share among the six largest markets (Brazil 11.5%, Colombia 10.9%). [1]
5. Small markets remain viable for local work. Even the six markets ranked 13th to 18th each record 139,000–431,000 eligible profiles, enough depth for city- or category-specific shortlists. Puerto Rico (4,941) and Cuba (172) are the exceptions, and their records should be treated with caution. [1]
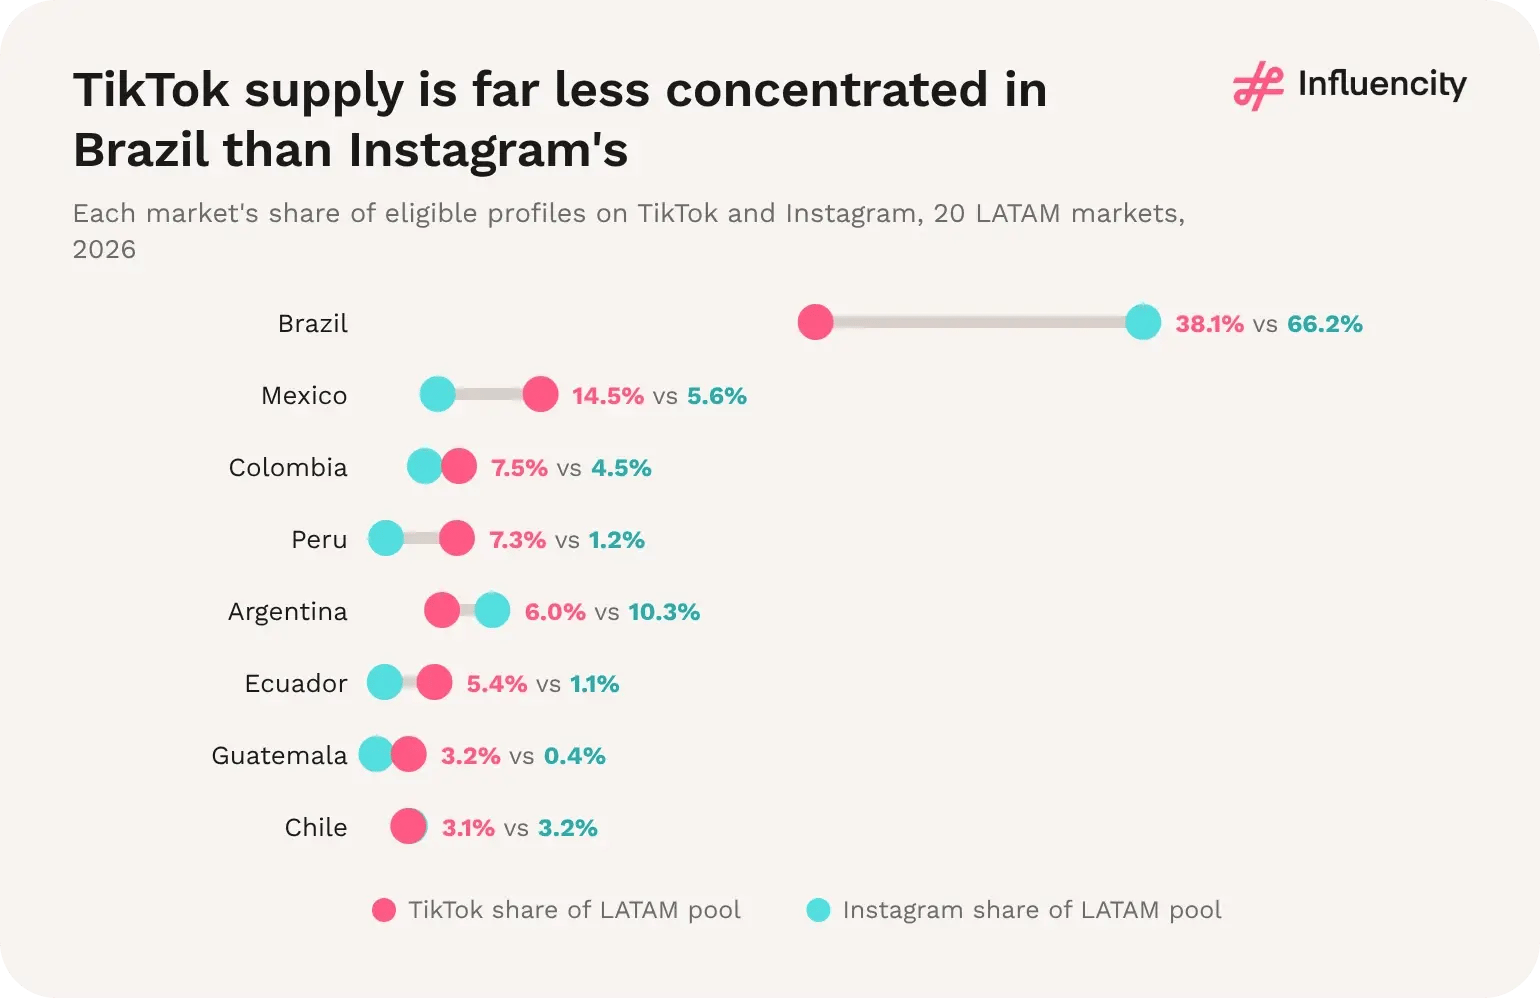
Figure 09 → Each market's share of the TikTok and Instagram LATAM creator pools. Brazil's share falls by 28.1 points on TikTok; Mexico's rises by 8.8. Sources: [1, 2].
Excluding Brazil lowers TikTok density only from 6.08% to 5.41%, against a fall from 5.69% to 3.42% on Instagram. For a Spanish-speaking LATAM programme, TikTok is therefore the platform with the deeper recorded creator supply relative to the audience. [1, 2]
LATAM TikTok creator supply is moderately concentrated and far less top-heavy than Instagram. In Influencity's 2026 data, collected in October–November 2026, Brazil holds 38.1% of the 26.23M eligible TikTok profiles across 20 markets, the top five markets hold 73.3% and the top ten 90.7%. On Instagram, Brazil alone holds 66.2% and the top five hold 89.9%. [1, 2]
A Herfindahl-Hirschman Index (HHI), calculated by Influencity on each market's share of eligible profiles, is 1,881 for TikTok and 4,559 for Instagram. In practical terms, TikTok supply behaves like 5.3 equal-sized markets and Instagram supply like 2.2. Reaching 90% of the regional pool takes ten markets on TikTok and six on Instagram. [1, 2]
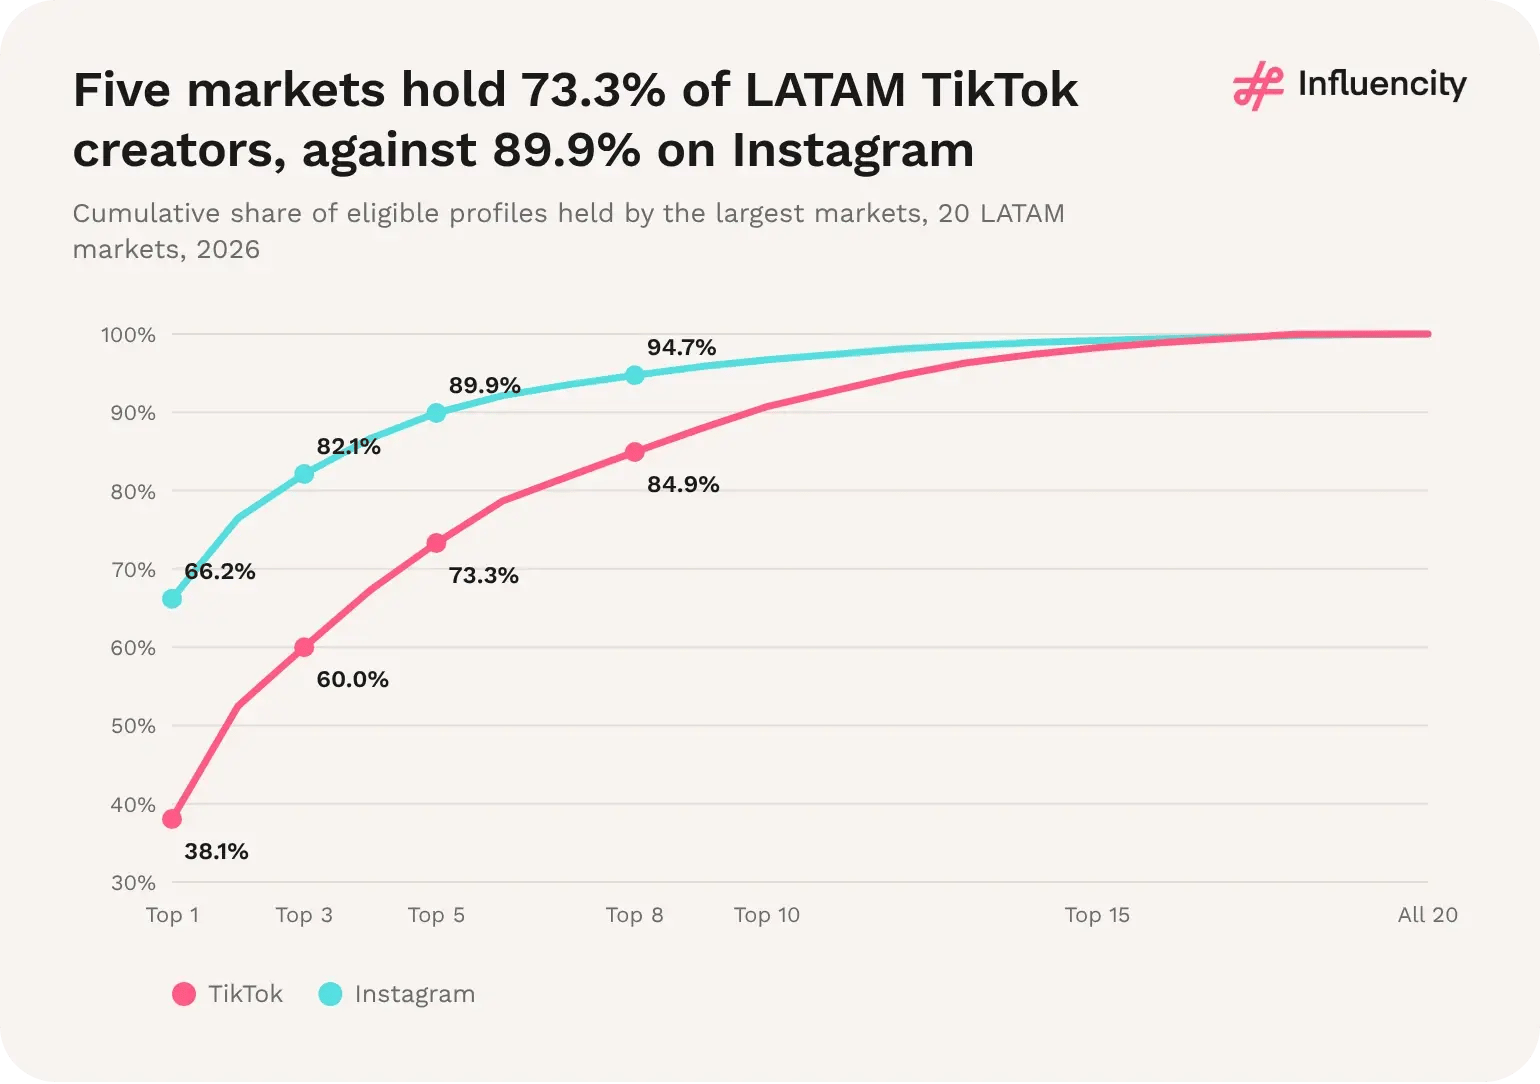
Figure 10 → Cumulative share of eligible profiles held by the largest LATAM markets, ranked by pool size on each platform, TikTok vs Instagram, 2026. Sources: [1, 2].
Broadly yes, with two large exceptions. The top three markets hold 60.0% of eligible profiles and 62.1% of estimated TikTok users, so supply and audience are similarly concentrated overall. Brazil, however, holds 7.7 percentage points more of the creator pool than of the audience (38.1% vs 30.4%), while Mexico holds 8.5 points less (14.5% vs 23.0%). Ecuador (+1.8 points), the Dominican Republic (+1.2) and Paraguay (+0.9) also have more creators than their audience share implies; Colombia (−1.3) and Venezuela (−1.0) have fewer. [1]
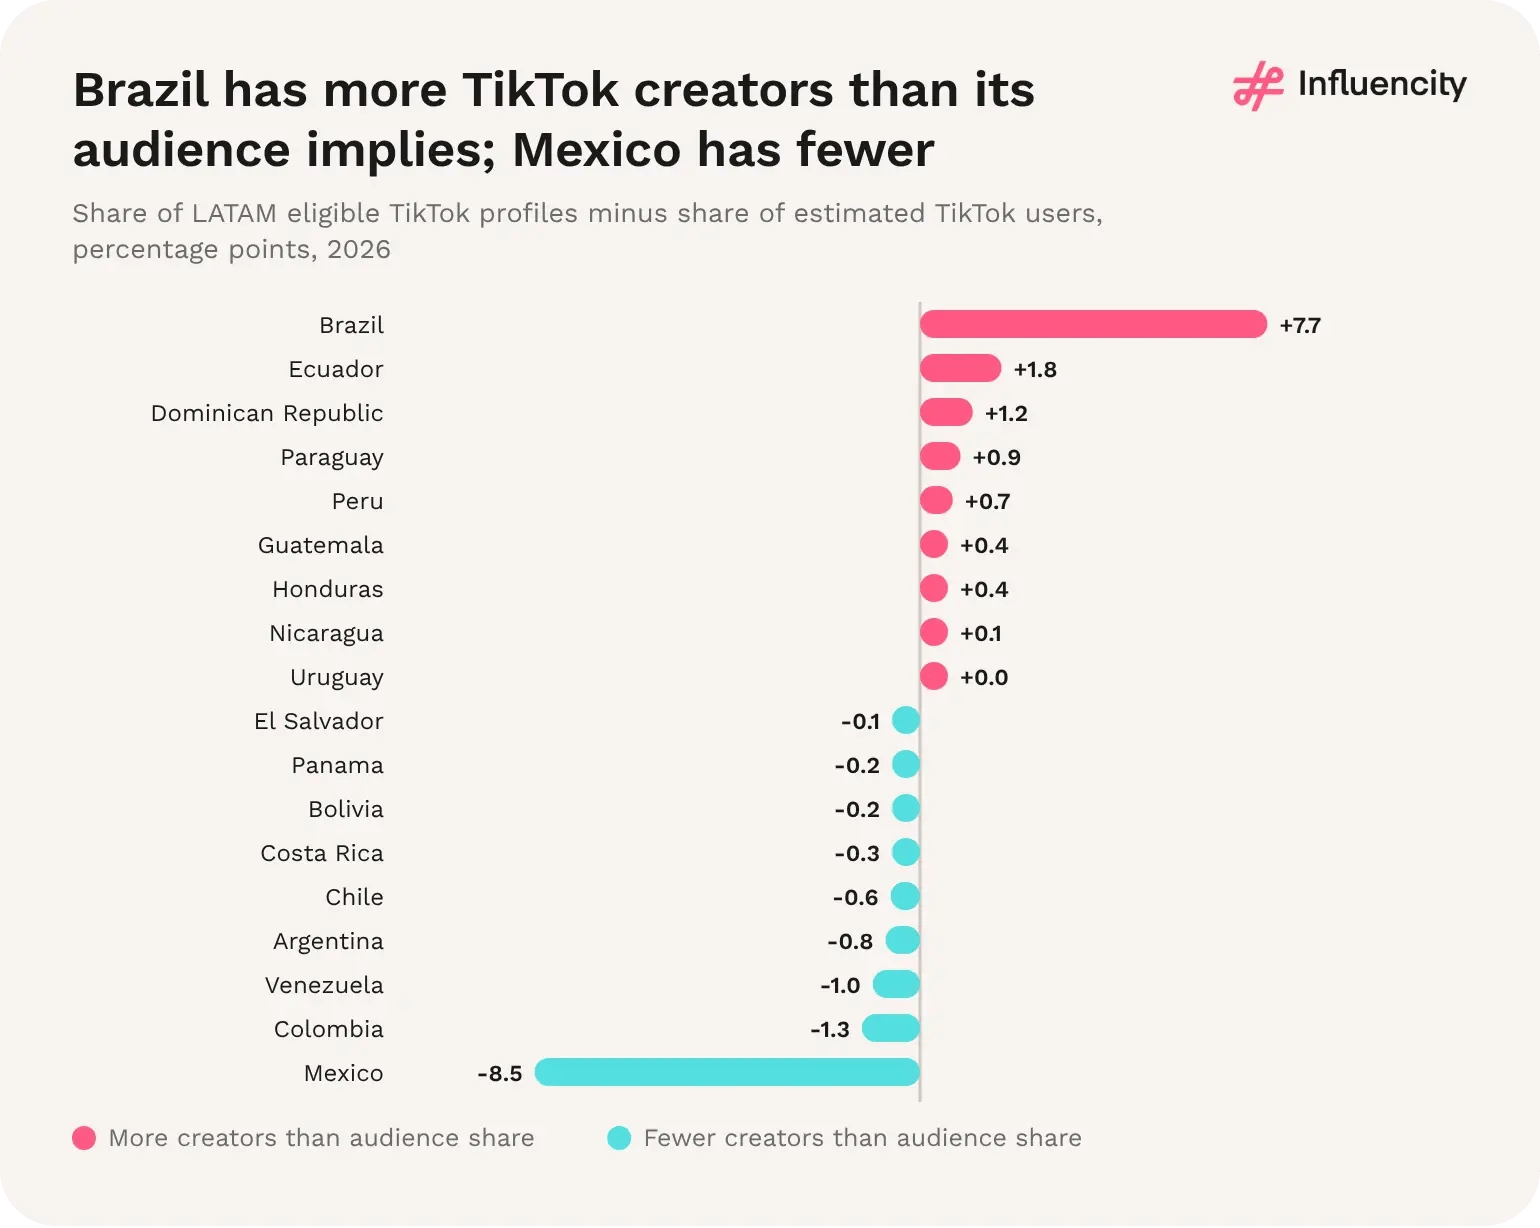
Figure 11 → Each market's share of eligible LATAM TikTok profiles minus its share of estimated TikTok users, in percentage points, 2026. Cuba and Puerto Rico (both under 0.1 points) are not shown. Source: [1].
Without Brazil, the 19 Spanish-speaking markets hold 16.25M eligible TikTok profiles. Mexico leads with 23.4% of that pool, the top three markets (Mexico, Colombia and Peru) hold 47.2% and the top five 65.5%. On Instagram the same 19 markets are more top-heavy: Argentina leads with 30.5% and the top five hold 76.7%. [1, 2]
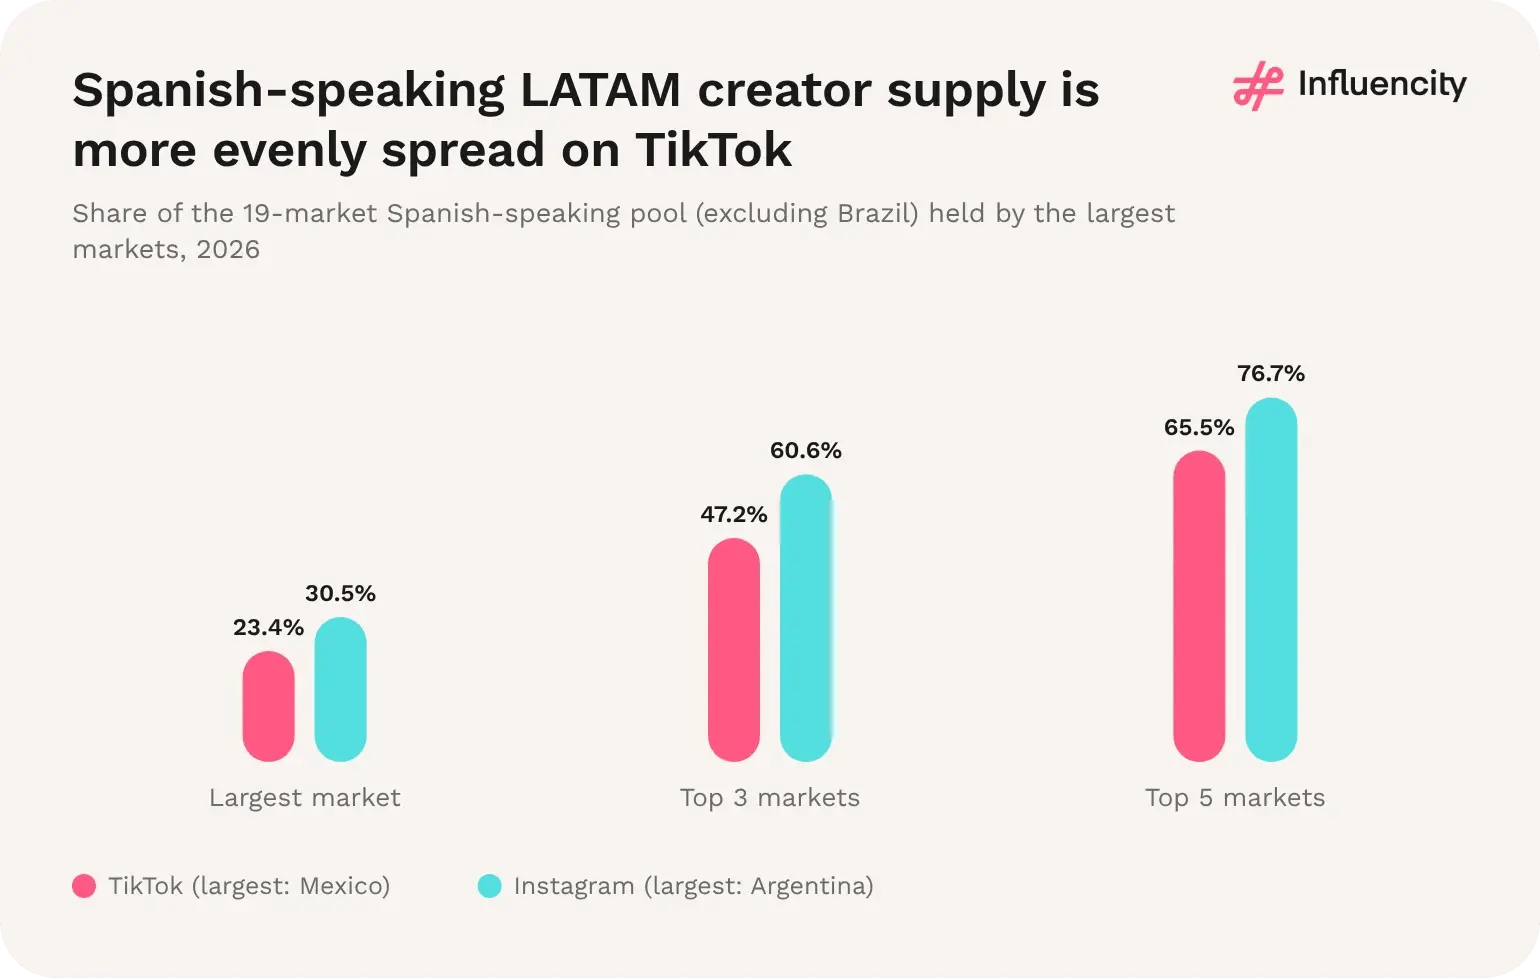
Figure 12 → Share of the Spanish-speaking LATAM creator pool (19 markets, excluding Brazil) held by the largest one, three and five markets, TikTok vs Instagram, 2026. Sources: [1, 2].
Brazil's share: 38.1% of eligible LATAM TikTok profiles, against 66.2% on Instagram (Influencity, 2026). [1, 2]
Top-five share: 73.3% of eligible profiles on TikTok and 89.9% on Instagram. [1, 2]
Long tail: markets ranked 6th to 20th hold 7.00M TikTok profiles (26.7% of the pool), against 1.86M (10.1%) on Instagram. [1, 2]
Brazil vs Mexico: Brazil's TikTok pool is 2.6 times Mexico's; on Instagram it is 11.7 times larger. [1, 2]
Concentration index: HHI of 1,881 on TikTok and 4,559 on Instagram, calculated on market shares of eligible profiles. [1, 2]
1. Brazil anchors the region but does not define it. Brazil is the largest single pool, yet 61.9% of eligible TikTok profiles sit elsewhere. On Instagram the position is reversed, with 66.2% inside Brazil. [1, 2]
2. The long tail carries real weight on TikTok. The 15 markets ranked 6th to 20th hold 7.00M eligible profiles, 3.8 times the equivalent Instagram tail. Regional TikTok plans that stop at the top five miss more than a quarter of recorded supply. [1, 2]
3. Mexico is the region's main supply–audience mismatch. Mexico accounts for 23.0% of estimated LATAM TikTok users but only 14.5% of eligible profiles, giving it the lowest creator density (3.83%) of any market except Puerto Rico. A large audience served by a comparatively small recorded creator pool may mean more competition for the same creators, but the data does not measure demand or pricing directly. [1]
Paraguay leads with 11.14 eligible profiles per 100 estimated users, followed by the Dominican Republic (9.96%), Ecuador (9.14%), Honduras (8.20%) and Brazil (7.62%). Nine markets exceed the 6.08% regional benchmark; the market median (excluding Cuba) is 5.43%. Mexico (3.83%) and Puerto Rico (0.86%) are lowest. [1]
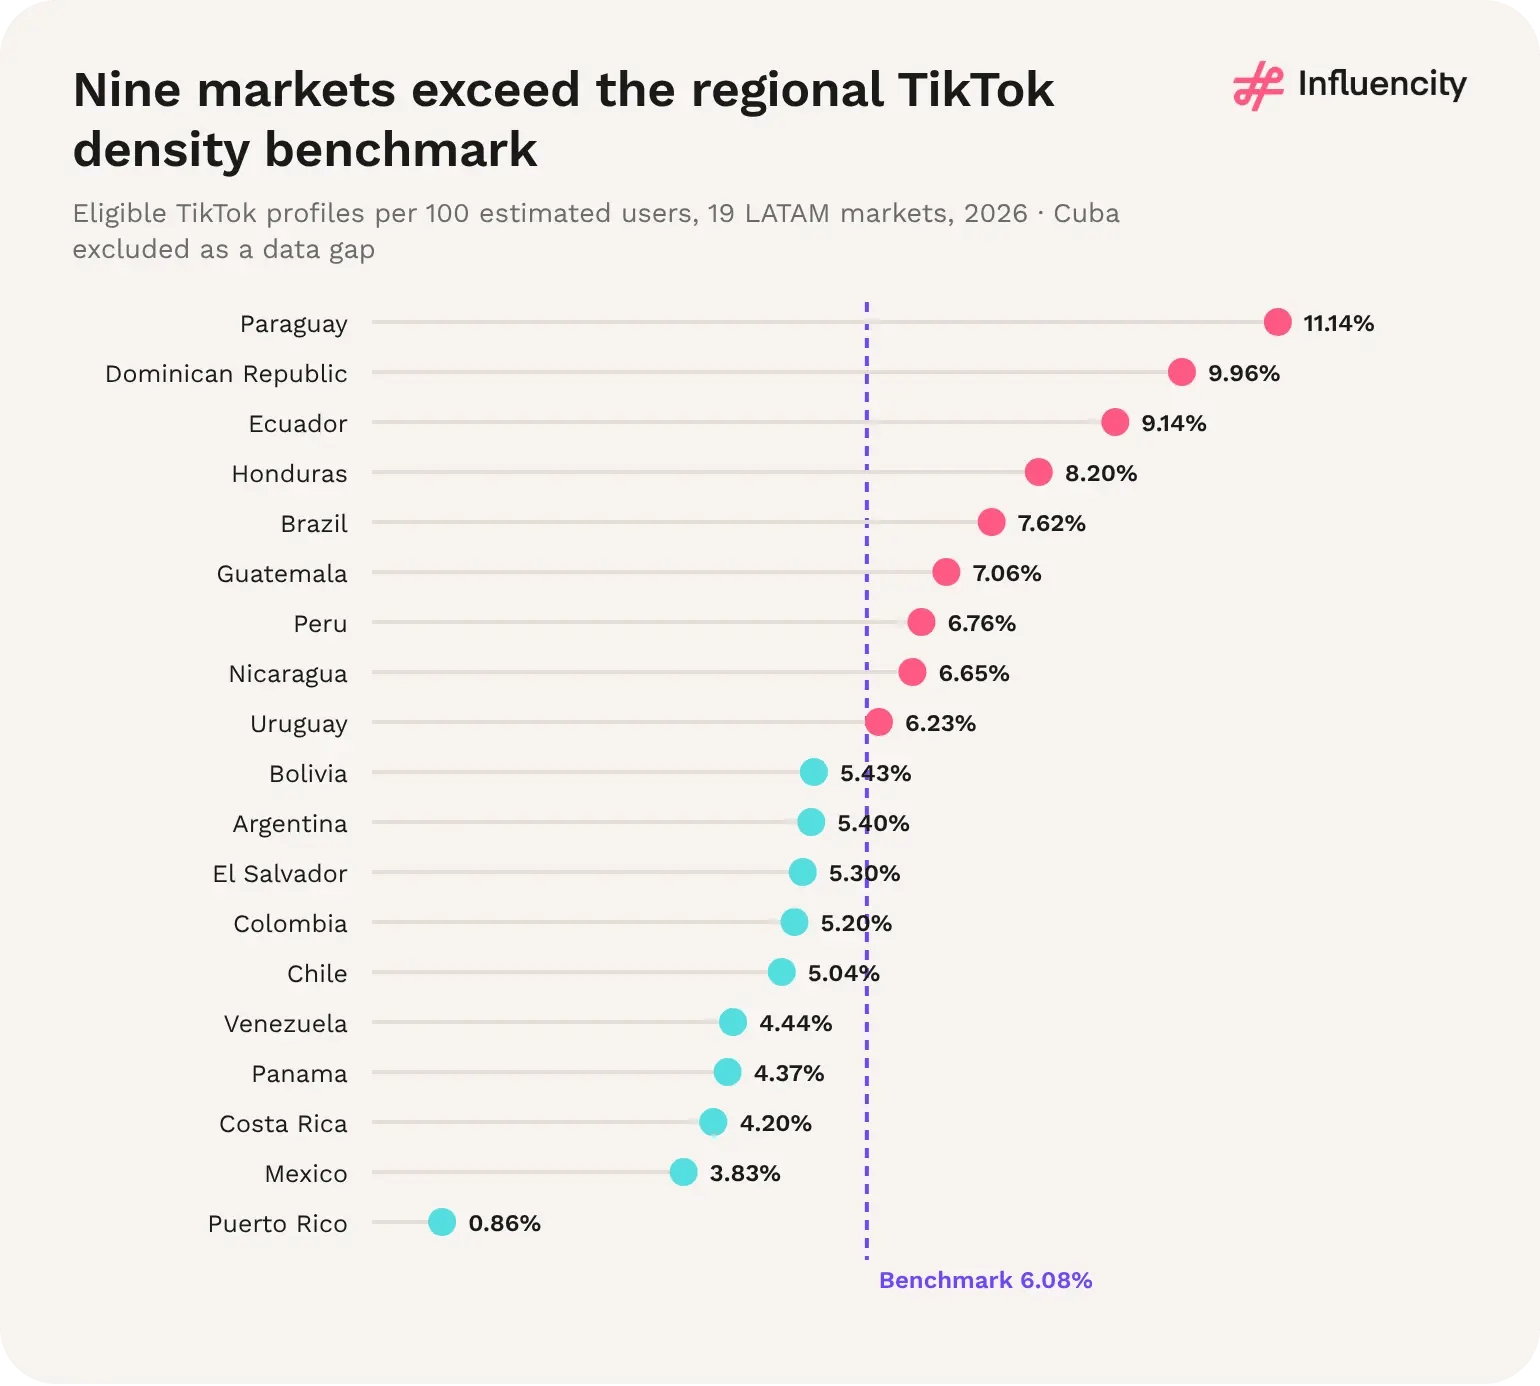
Figure 13 → TikTok creator density for 19 markets against the regional benchmark; Cuba excluded as a data gap. Source: [1].
Paraguay (517,916 profiles) and the Dominican Republic (785,736) combine high density with mid-sized pools. Ecuador (1.41M at 9.14%) is the clearest case of both scale and density outside Brazil. Mexico shows the reverse: the second-largest pool but the second-lowest density, because its estimated audience (99.0M) is so large. [1]
The LATAM benchmark is 6.08 eligible TikTok profiles per 100 estimated users in Influencity's 2026 data, collected in October–November 2026. Across the 19 markets with usable user estimates (Cuba excluded), the median is 5.43%. Among markets with more than 100,000 eligible profiles, density ranges from 11.14% in Paraguay to 3.83% in Mexico, a 2.9-fold spread. Puerto Rico (0.86%) falls outside that range and is treated with caution. [1]
No. Across 18 markets (Cuba and Puerto Rico excluded), pool size and density are only weakly related (r = 0.12, calculated by Influencity on log profile counts). Four of the five highest-density markets hold between 431,000 and 1.41M profiles. Brazil is the only very large market above the benchmark, while Mexico, the second-largest pool, has the lowest density of the 18. [1]
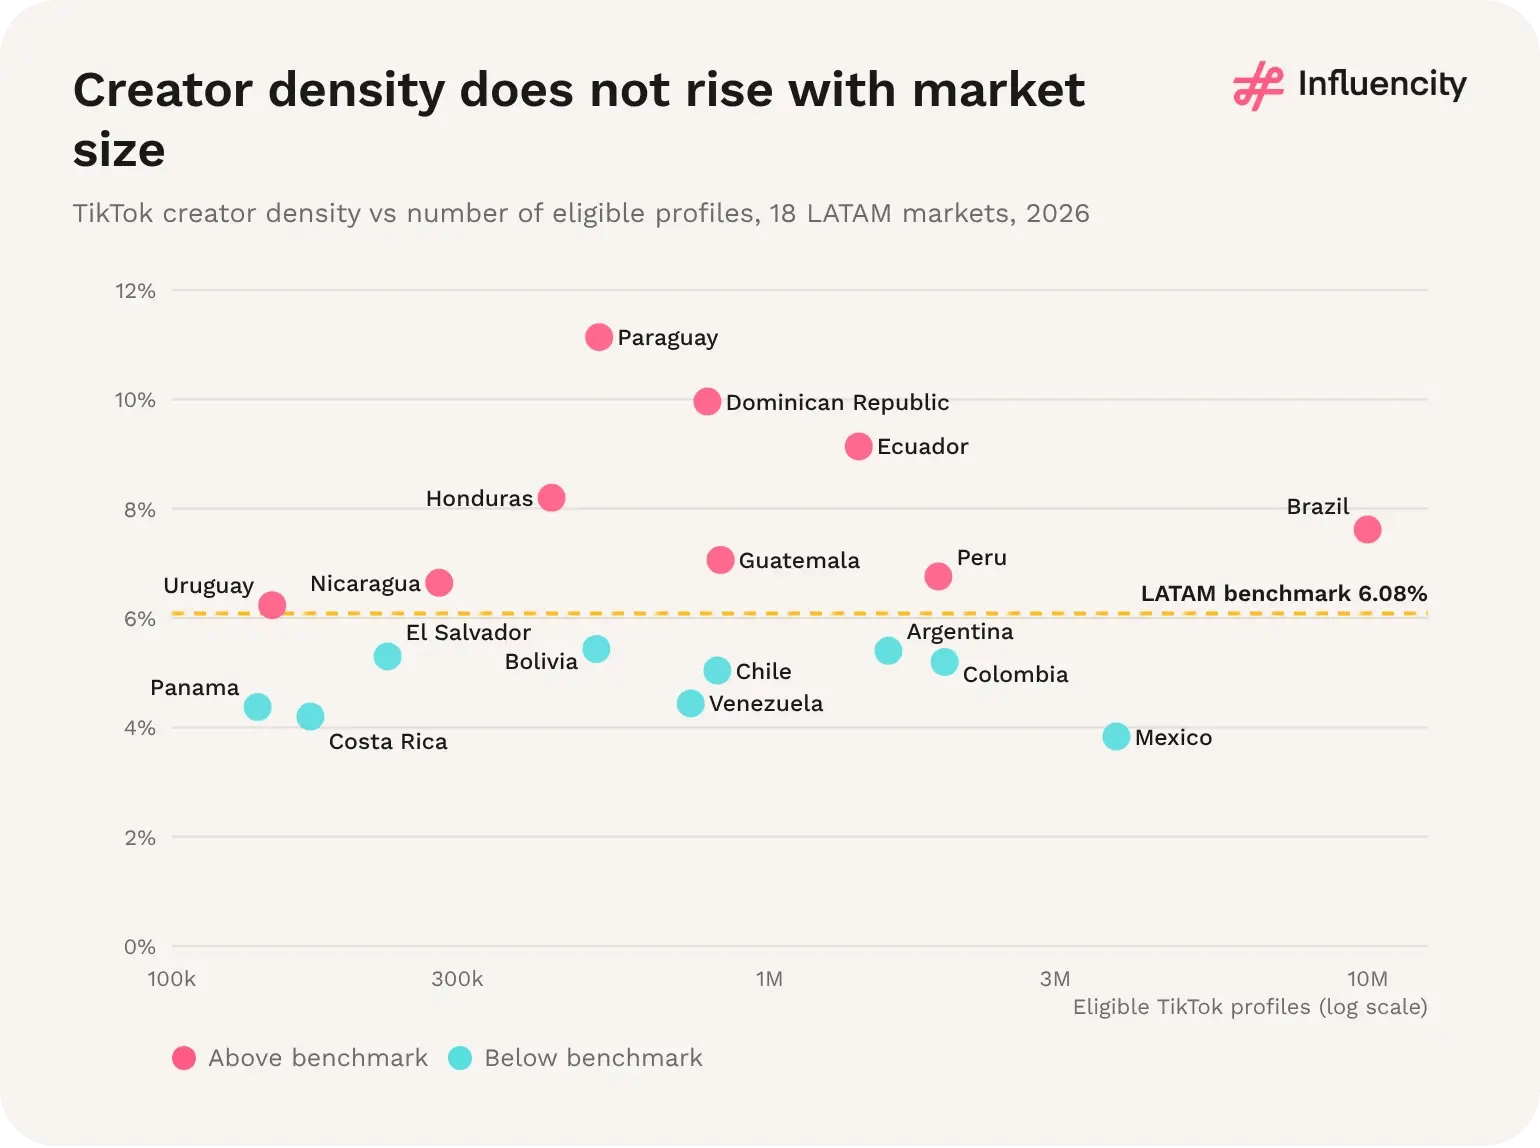
Figure 14 → TikTok creator density against number of eligible profiles (log scale), 18 LATAM markets, 2026. Cuba and Puerto Rico excluded as data gaps. Source: [1].
By sub-region, the Caribbean records the highest TikTok density (9.34%, driven by the Dominican Republic), followed by Brazil (7.62%), Central America (6.34%), the Andean markets (6.08%), the Southern Cone (5.84%) and Mexico (3.83%). The platform contrast is sharper than the ranking: Central America has 3.1 times more eligible profiles per user on TikTok than on Instagram (6.34% vs 2.04%), the Caribbean 2.5 times, Mexico 2.0 times and the Andes 1.8 times. Brazil is the only sub-region where Instagram density is higher (8.62% vs 7.62%). [1, 2]
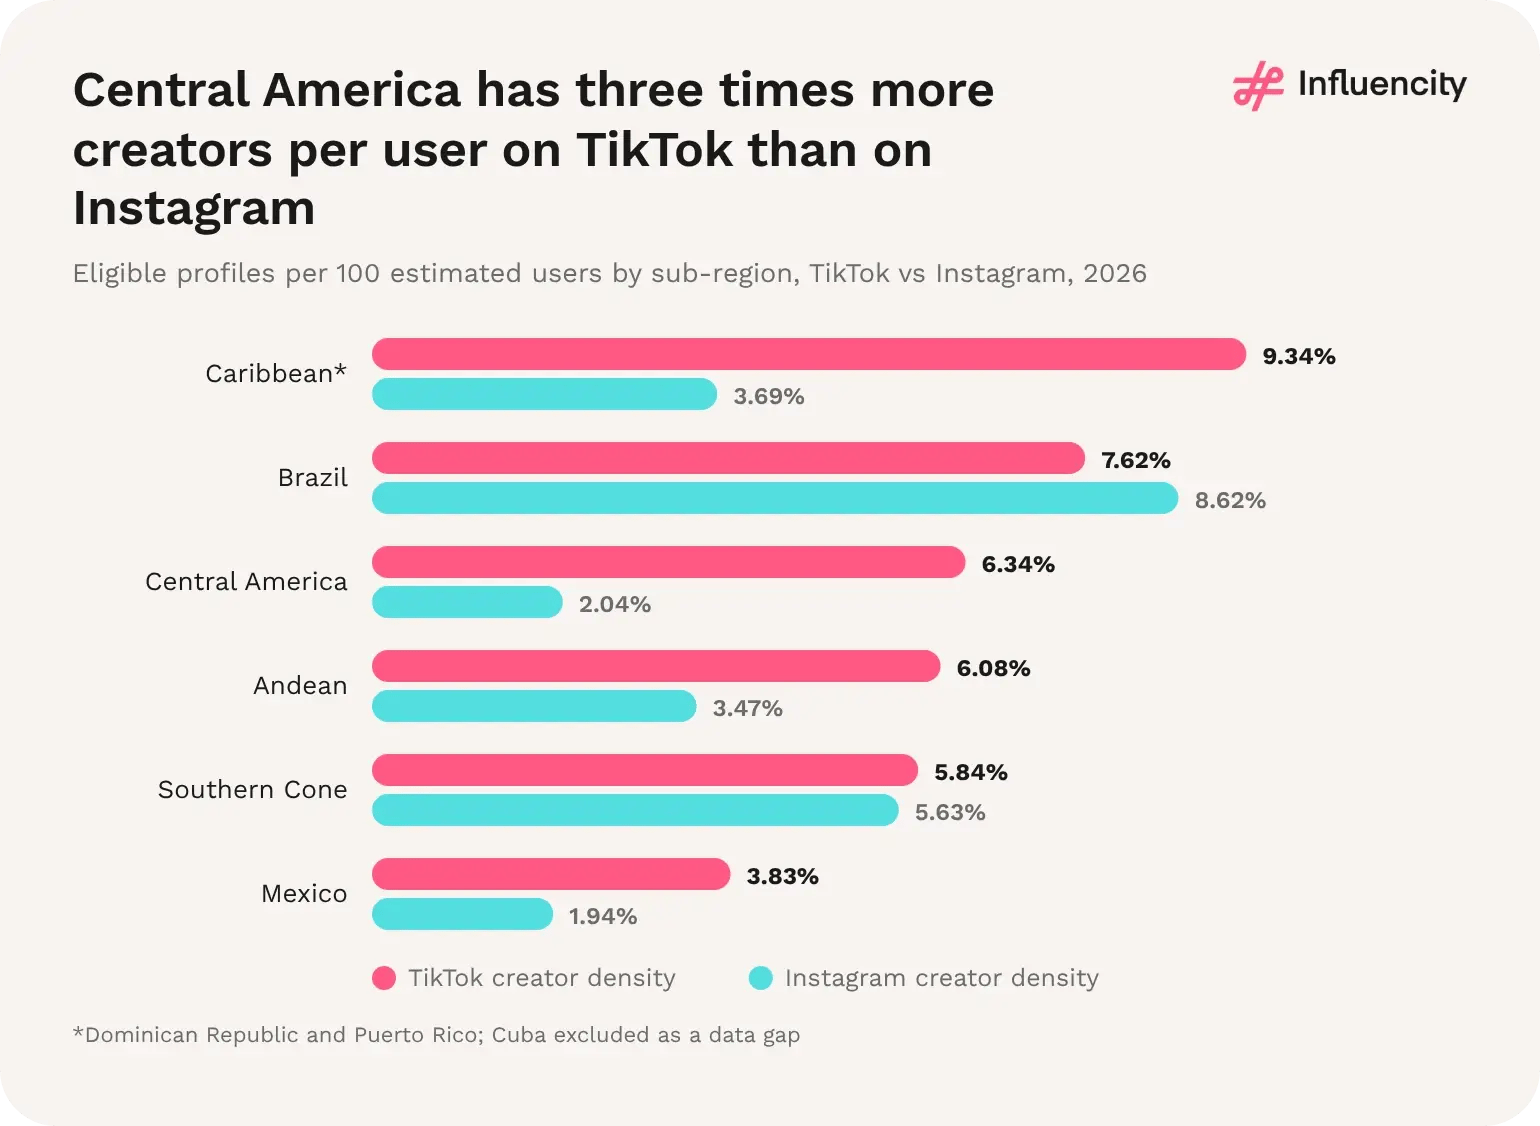
Figure 15 → Eligible profiles per 100 estimated users by sub-region, TikTok vs Instagram, 2026. Caribbean covers the Dominican Republic and Puerto Rico; Cuba excluded. Sources: [1, 2].
Counting only tier records with 10,000 or more followers, the Dominican Republic leads with 9.01 per 1,000 estimated users, followed by Brazil (8.76), Ecuador (8.53), Paraguay (8.10) and Peru (7.48). The regional figure is 6.87. Mexico rises from 18th of 18 on overall density to 13th, because 14.4% of its tier records have 10,000+ followers, the highest share among the 18 markets. Tier figures use the 26,197,988 tier records, not the headline profile count. [1]
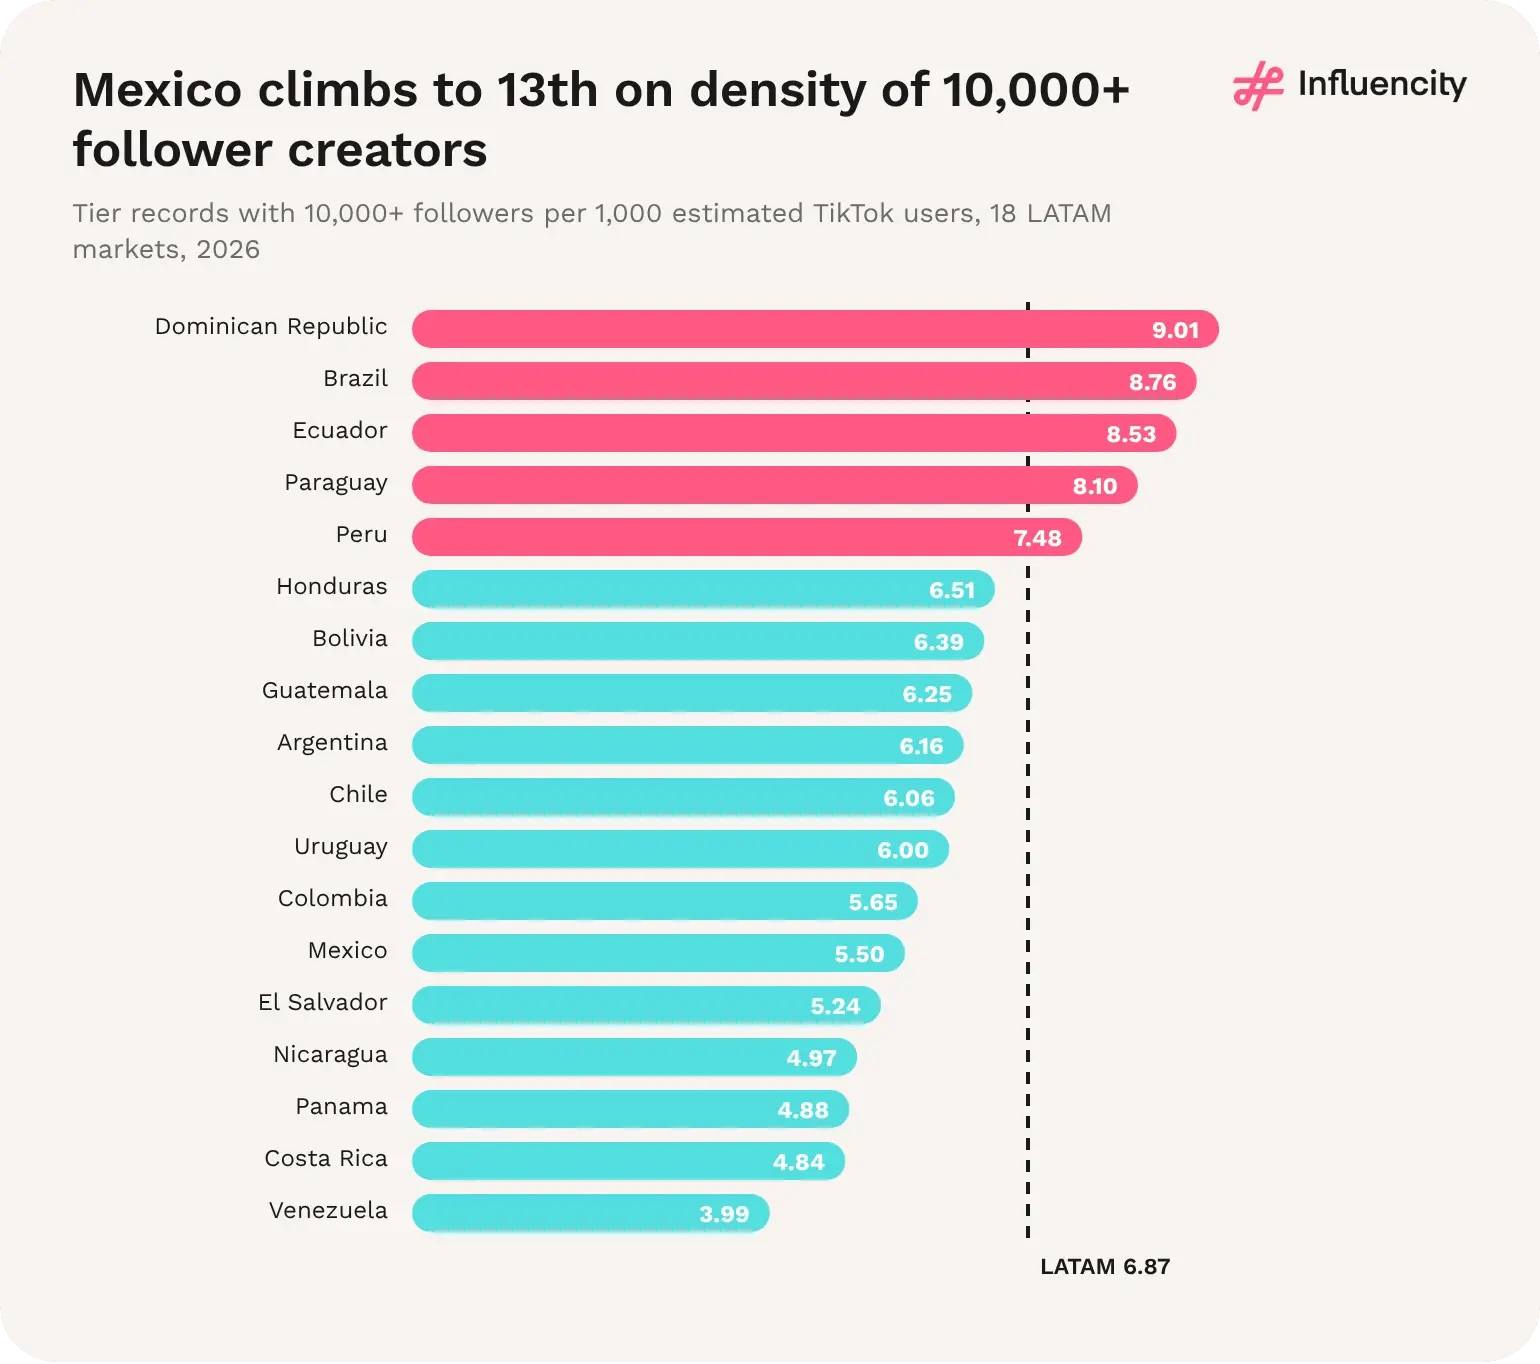
Figure 16 → Tier records with 10,000+ followers per 1,000 estimated TikTok users, 18 LATAM markets, 2026. Cuba and Puerto Rico excluded. Source: [1].
Regional benchmark: 6.08 eligible TikTok profiles per 100 estimated users across 20 LATAM markets (Influencity, 2026). [1]
Highest and lowest: Paraguay at 11.14% and Mexico at 3.83%, among markets with 100,000+ profiles. [1]
Above the benchmark: nine markets, together holding 62.1% of eligible profiles and 48.9% of estimated users. [1]
Established-creator density: 6.87 tier records with 10,000+ followers per 1,000 estimated users regionally; the Dominican Republic is highest at 9.01. [1]
Platform contrast: Central America's TikTok density is 3.1 times its Instagram density. [1, 2]
1. Density shows where creating is common, not where campaigns perform. A higher ratio means more eligible creators relative to the estimated audience. On its own it says nothing about engagement, cost or results. [1]
2. Mid-sized markets lead on density. Paraguay, the Dominican Republic, Ecuador and Honduras all exceed 8% and together hold 3.14M eligible profiles, more than four in ten of them in Ecuador. [1]
3. Mexico's gap sits at entry level. Mexico ranks last of 18 on overall density but 13th on 10,000+ creator density (5.50 per 1,000 users), close to Colombia (5.65). Its shortfall is concentrated among nano accounts rather than established creators. [1]
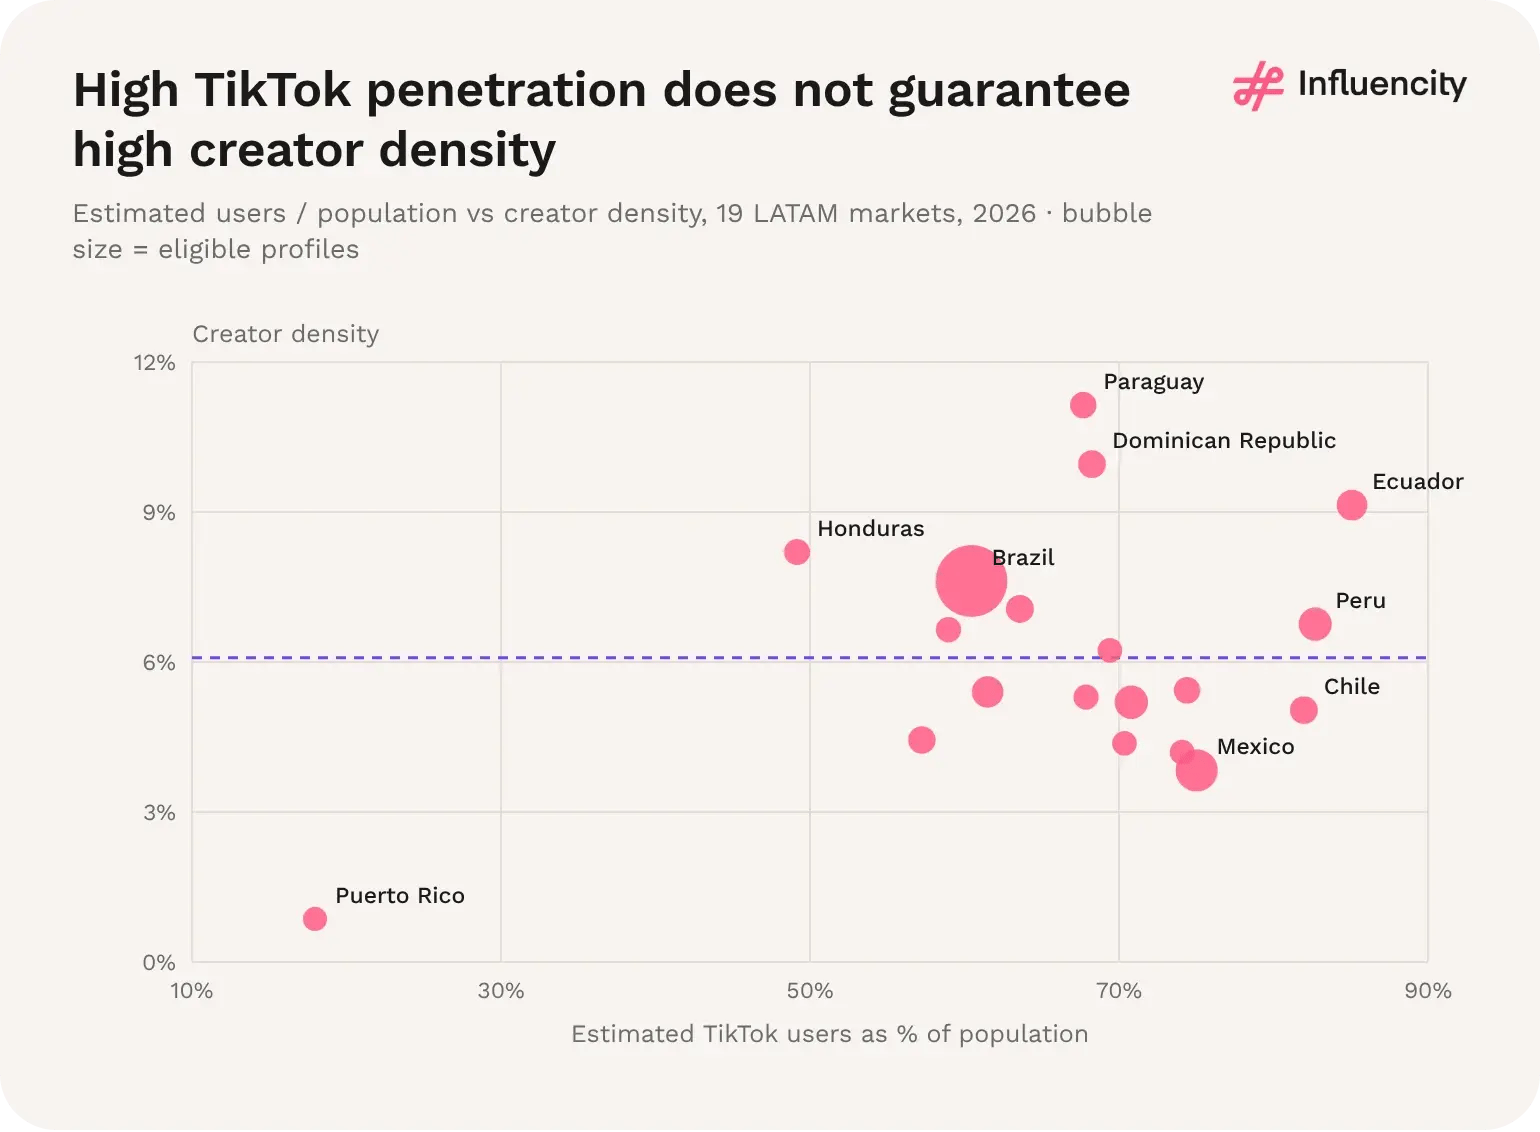
Figure 17 → Estimated penetration and creator density measure different things. Bolivia's population corrected; Cuba excluded. Source: [1].
Brazil's TikTok penetration (60.5%) is below the regional ratio, while on Instagram it is among the highest (65.3%). Honduras combines low penetration (49.2%) with high density (8.20%). Ratios above 80% can reflect multiple accounts, non-resident users or estimate methods, so treat them as audience-scale context rather than adoption. [1, 2]
Estimated TikTok users equal 66.1% of the combined population of the 20 LATAM markets in Influencity's 2026 data, collected in October–November 2026, against 49.6% for Instagram. Across 18 markets (Cuba and Puerto Rico excluded), the median TikTok ratio is 68.8%, ranging from 85.1% in Ecuador to 49.2% in Honduras. These are ratios of dataset audience estimates to population, not survey-measured adoption. [1, 2]
By estimated audience, yes, in almost every market. TikTok's users-to-population ratio is higher than Instagram's in 16 of 18 markets. The gaps are widest in Bolivia (74.4% vs 18.1%), Peru (82.7% vs 30.1%) and Ecuador (85.1% vs 37.0%). Brazil (60.5% vs 65.3%) and Argentina (61.5% vs 65.5%) are the only exceptions. [1, 2]
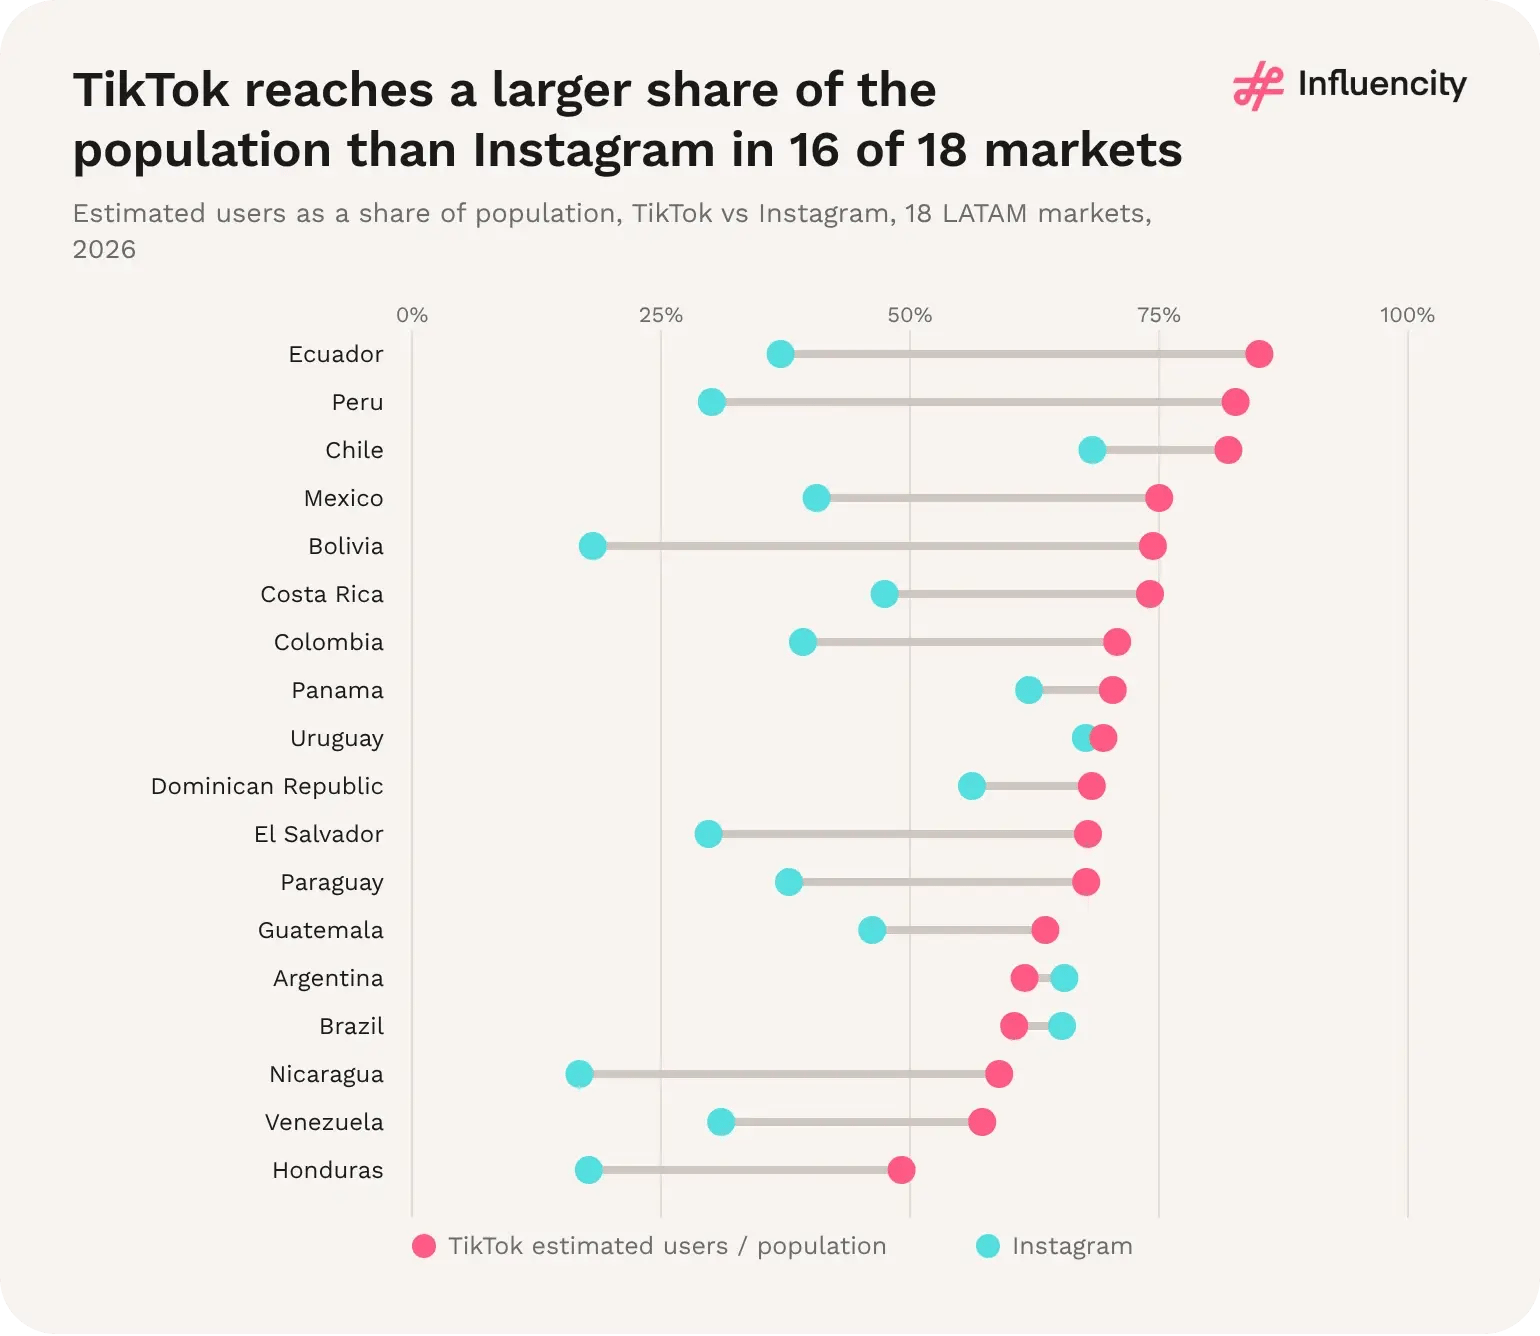
Figure 18 → Estimated users as a share of population, TikTok vs Instagram, 18 LATAM markets, 2026. Cuba and Puerto Rico excluded as data gaps. Sources: [1, 2].
Across the 20 markets, TikTok's estimated audience is 107.5M users larger than Instagram's (431.0M vs 323.5M). Mexico alone accounts for 45.4M of that difference, and Mexico, Peru and Colombia together for 80.2M, or 74.6%. Brazil runs the other way, with 10.4M more estimated Instagram users than TikTok users. [1, 2]
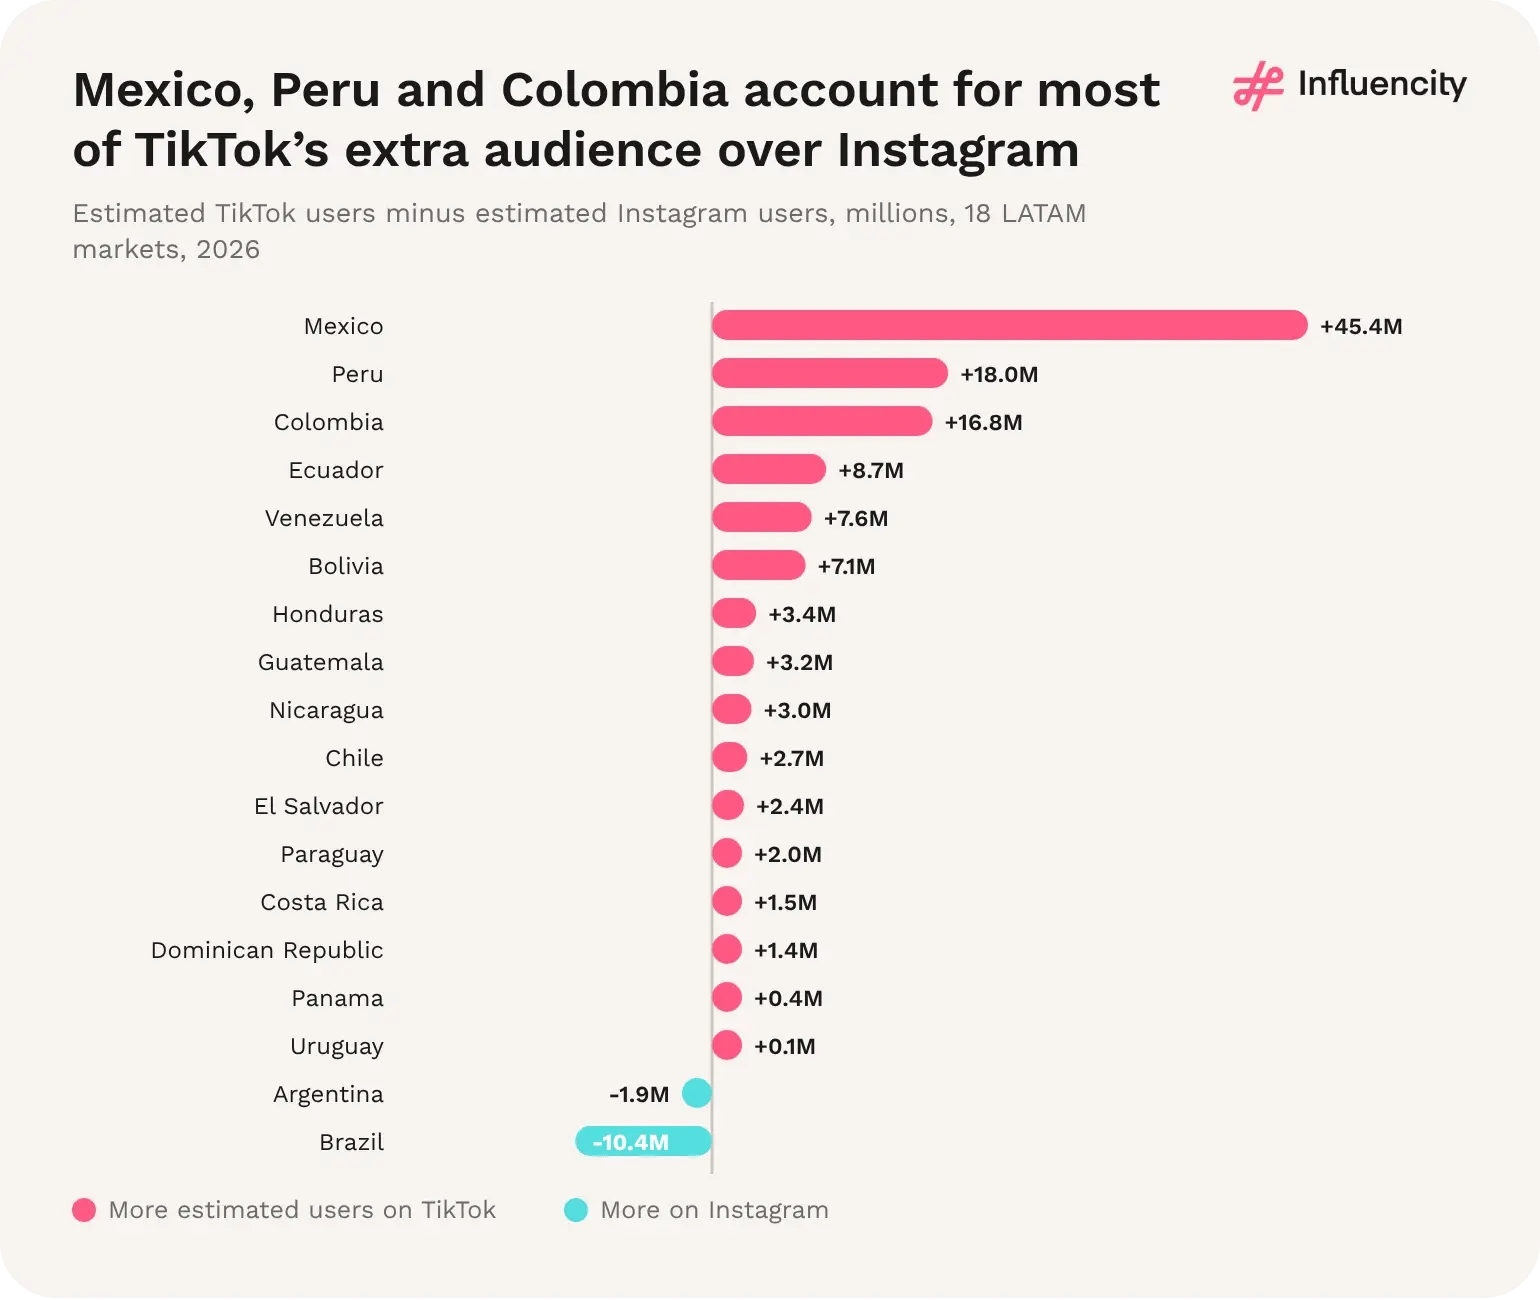
Figure 19 → Estimated TikTok users minus estimated Instagram users, in millions, 18 LATAM markets, 2026. Cuba and Puerto Rico not shown. Sources: [1, 2].
Creator supply per resident combines penetration and density: eligible profiles per 1,000 residents equals estimated users per resident multiplied by creator density. The LATAM figure is 40.2. Ecuador (77.8) and Paraguay (75.4) lead, followed by the Dominican Republic (68.0) and Peru (55.9), while Mexico (28.7) and Venezuela (25.4) are lowest. Ecuador gets there through both routes, high penetration (85.1%) and high density (9.14%); Paraguay's lead comes mainly from density (11.14% on 67.7% penetration). [1]
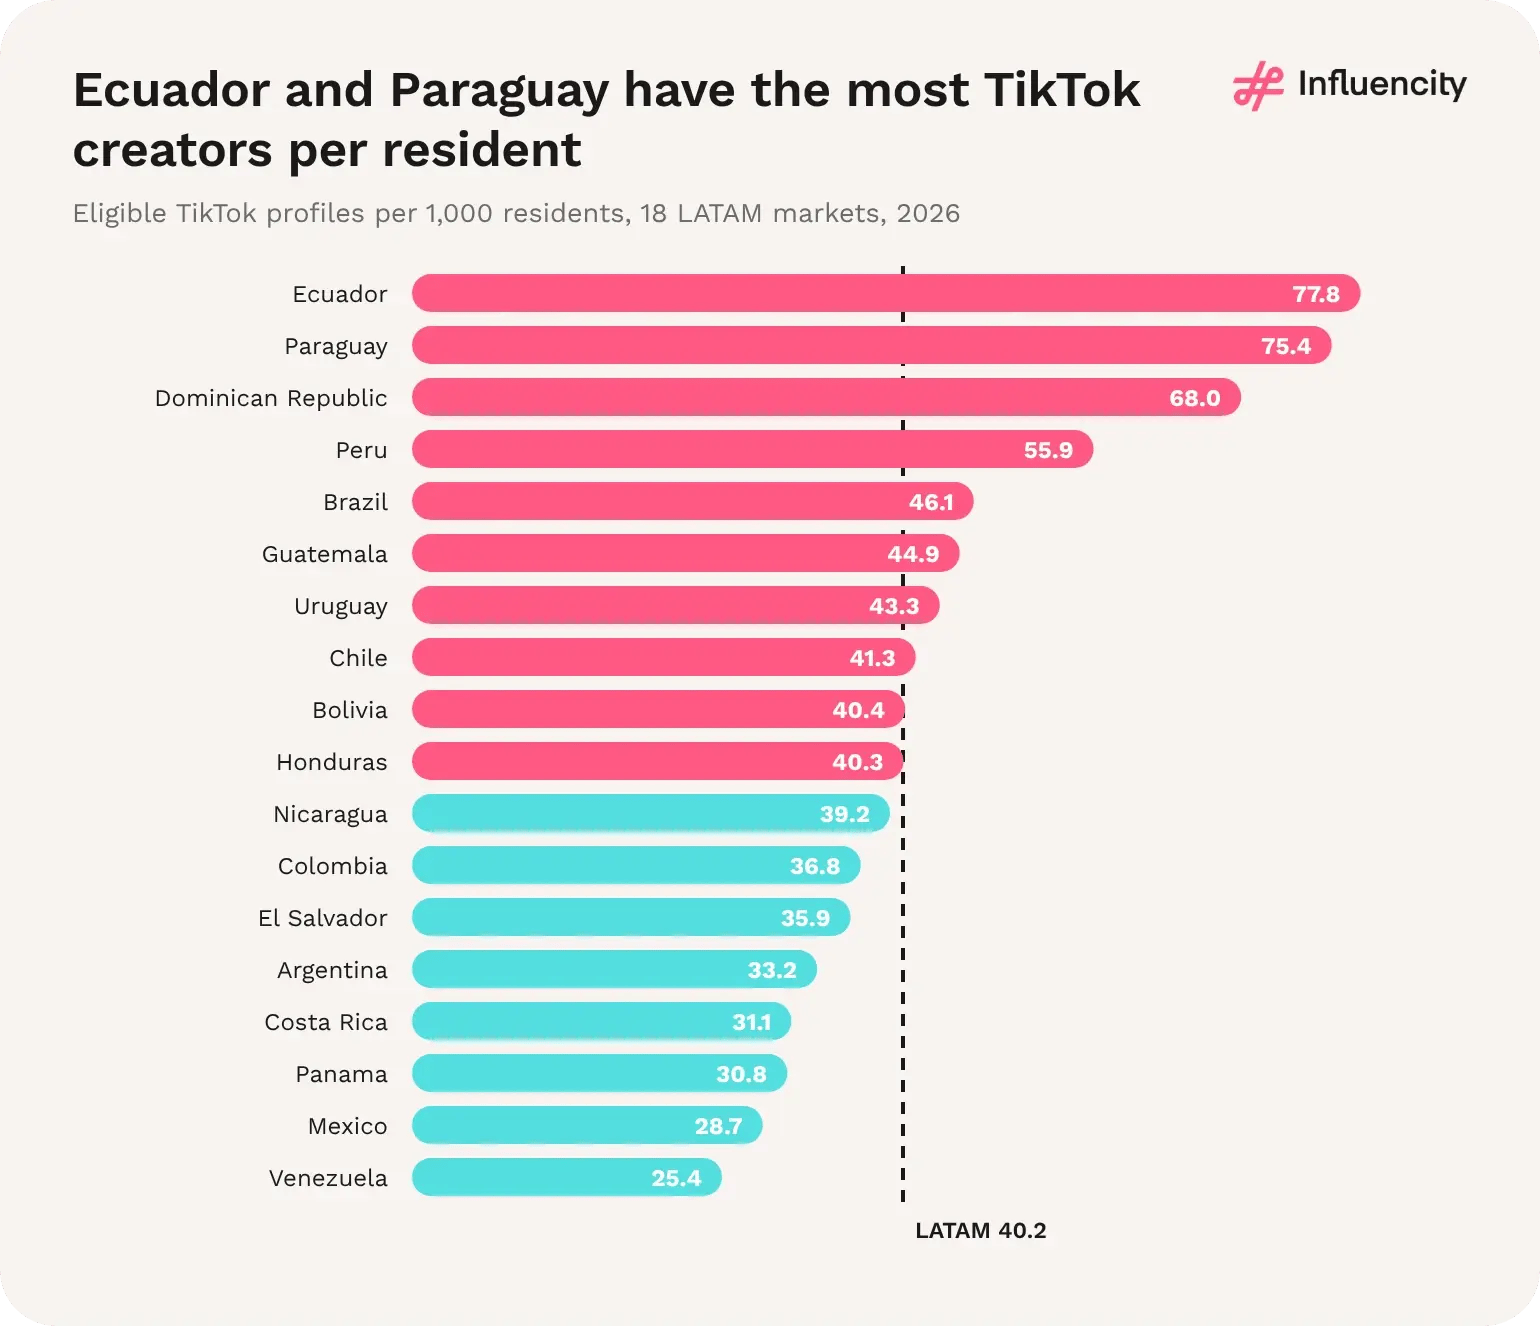
Figure 20 → Eligible TikTok profiles per 1,000 residents, 18 LATAM markets, 2026. Bolivia population corrected; Cuba and Puerto Rico excluded. Source: [1].
Regional ratio: estimated TikTok users equal 66.1% of population across 20 LATAM markets, against 49.6% for Instagram (Influencity, 2026). [1, 2]
Highest ratios: Ecuador (85.1%), Peru (82.7%) and Chile (82.0%). [1]
TikTok ahead: TikTok's estimated reach exceeds Instagram's in 16 of 18 markets. [1, 2]
Audience gap: 107.5M more estimated TikTok users than Instagram users, 45.4M of them in Mexico. [1, 2]
Creators per resident: 40.2 eligible TikTok profiles per 1,000 residents regionally; Ecuador is highest at 77.8. [1]
1. High penetration does not guarantee deep creator supply. Mexico (75.0%) and Chile (82.0%) both rank in the top four for penetration but below the regional benchmark for creator density (3.83% and 5.04%). [1]
2. The Andes are TikTok-first. In Bolivia, Peru and Ecuador, TikTok's estimated penetration is 48 to 56 percentage points above Instagram's, the widest gaps in the region, and its estimated reach is 2.3 to 4.1 times Instagram's. [1, 2]
3. Brazil and Argentina still lean towards Instagram. They are the only two of 18 markets where Instagram's estimated reach is higher, although the gaps are small (4.8 and 4.0 percentage points). [1, 2]
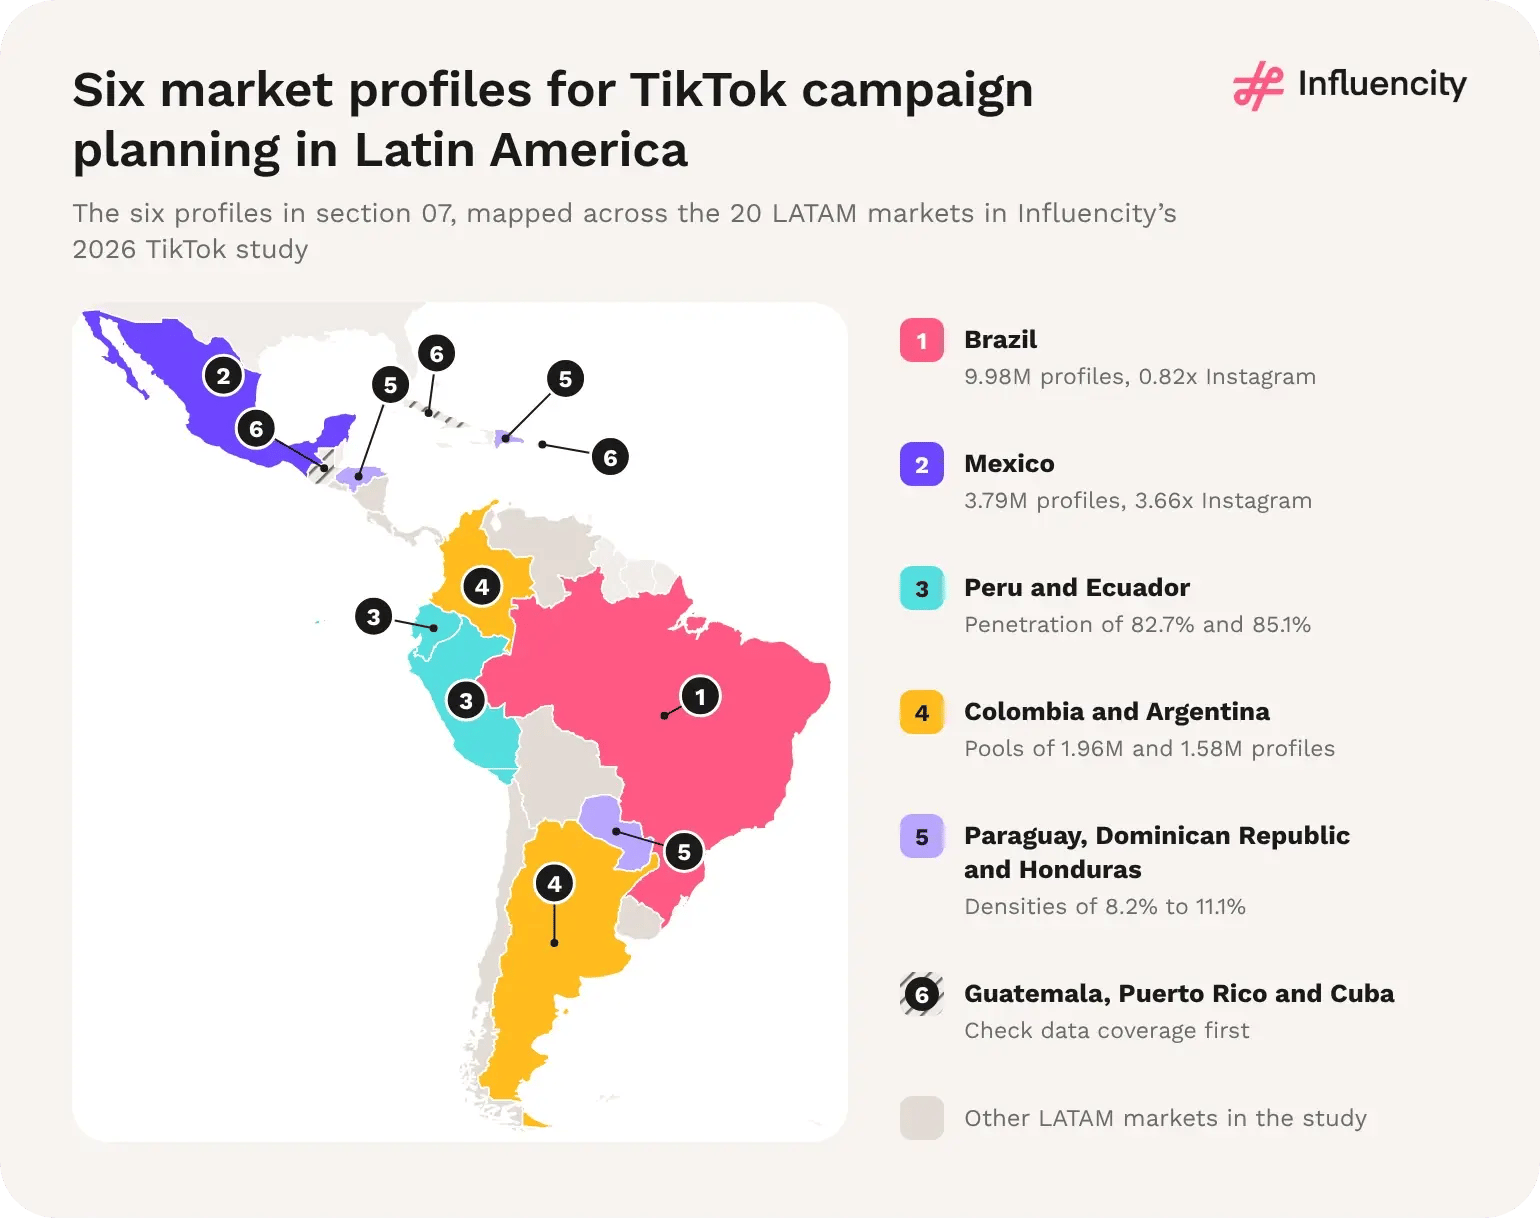
Figure 21 → Six market profiles from section 07 mapped across the 20 LATAM markets in Influencity’s 2026 TikTok study. Profiled markets are coloured by group; Guatemala, Puerto Rico and Cuba are hatched because their records need checking. Sources: [1, 2].
Brazil has 9.98M eligible TikTok profiles at 7.62% density, the largest pool in the region, but fewer TikTok than Instagram profiles (0.82x). Its estimated TikTok penetration (60.5%) is also below Instagram's (65.3%), and its Instagram creator density (8.62%) is the highest in the region. Brazil holds 7,085 of the region's 16,584 mega-tier TikTok records. [1, 2]
Brazil adopted Instagram early and at scale, and much of its creator economy, from beauty and fashion to small-business selling, grew there alongside WhatsApp, which many Brazilians use for customer contact and sales. That gives Instagram a head start in audiences, agency relationships and brand budgets. Short-form video is also split across more apps in Brazil than elsewhere in the region: Kwai, which has focused heavily on the Brazilian market, competes with TikTok for the same viewers. And because Brazilian influencers work in Portuguese, their pool gains less from the Spanish-language crossover that lifts TikTok supply elsewhere. These explanations, like the others in this section, draw on cultural and market context; the dataset itself does not measure causes.
It depends on the job. By recorded creator supply, Brazil (9.98M eligible profiles) and Mexico (3.79M) are the two largest TikTok markets, followed by Colombia, Peru and Argentina. Relative to Instagram, TikTok is strongest in Nicaragua, Bolivia and Guatemala, each with more than 11 times as many TikTok as Instagram profiles. Relative to audience, Paraguay, the Dominican Republic and Ecuador have the most creators per user. Influencity's 2026 data, collected in October–November 2026, support grouping the 18 markets with reliable records into four archetypes. [1, 2]
Influencity groups markets by two measures: the ratio of TikTok to Instagram eligible profiles, and recorded pool size. Two-platform anchors (Brazil and Argentina) have fewer TikTok than Instagram profiles. TikTok-led scale markets (Mexico, Colombia, Peru and Ecuador) each have more than 1M TikTok profiles and at least twice their Instagram count. TikTok-first mid-sized and small markets (Guatemala, the Dominican Republic, Paraguay, Bolivia, Honduras, Nicaragua and El Salvador) have at least three times as many TikTok as Instagram profiles. Balanced markets (Chile, Venezuela, Costa Rica, Uruguay and Panama) sit between 1.1 and 2.0 times. Cuba and Puerto Rico are treated as data gaps. [1, 2]
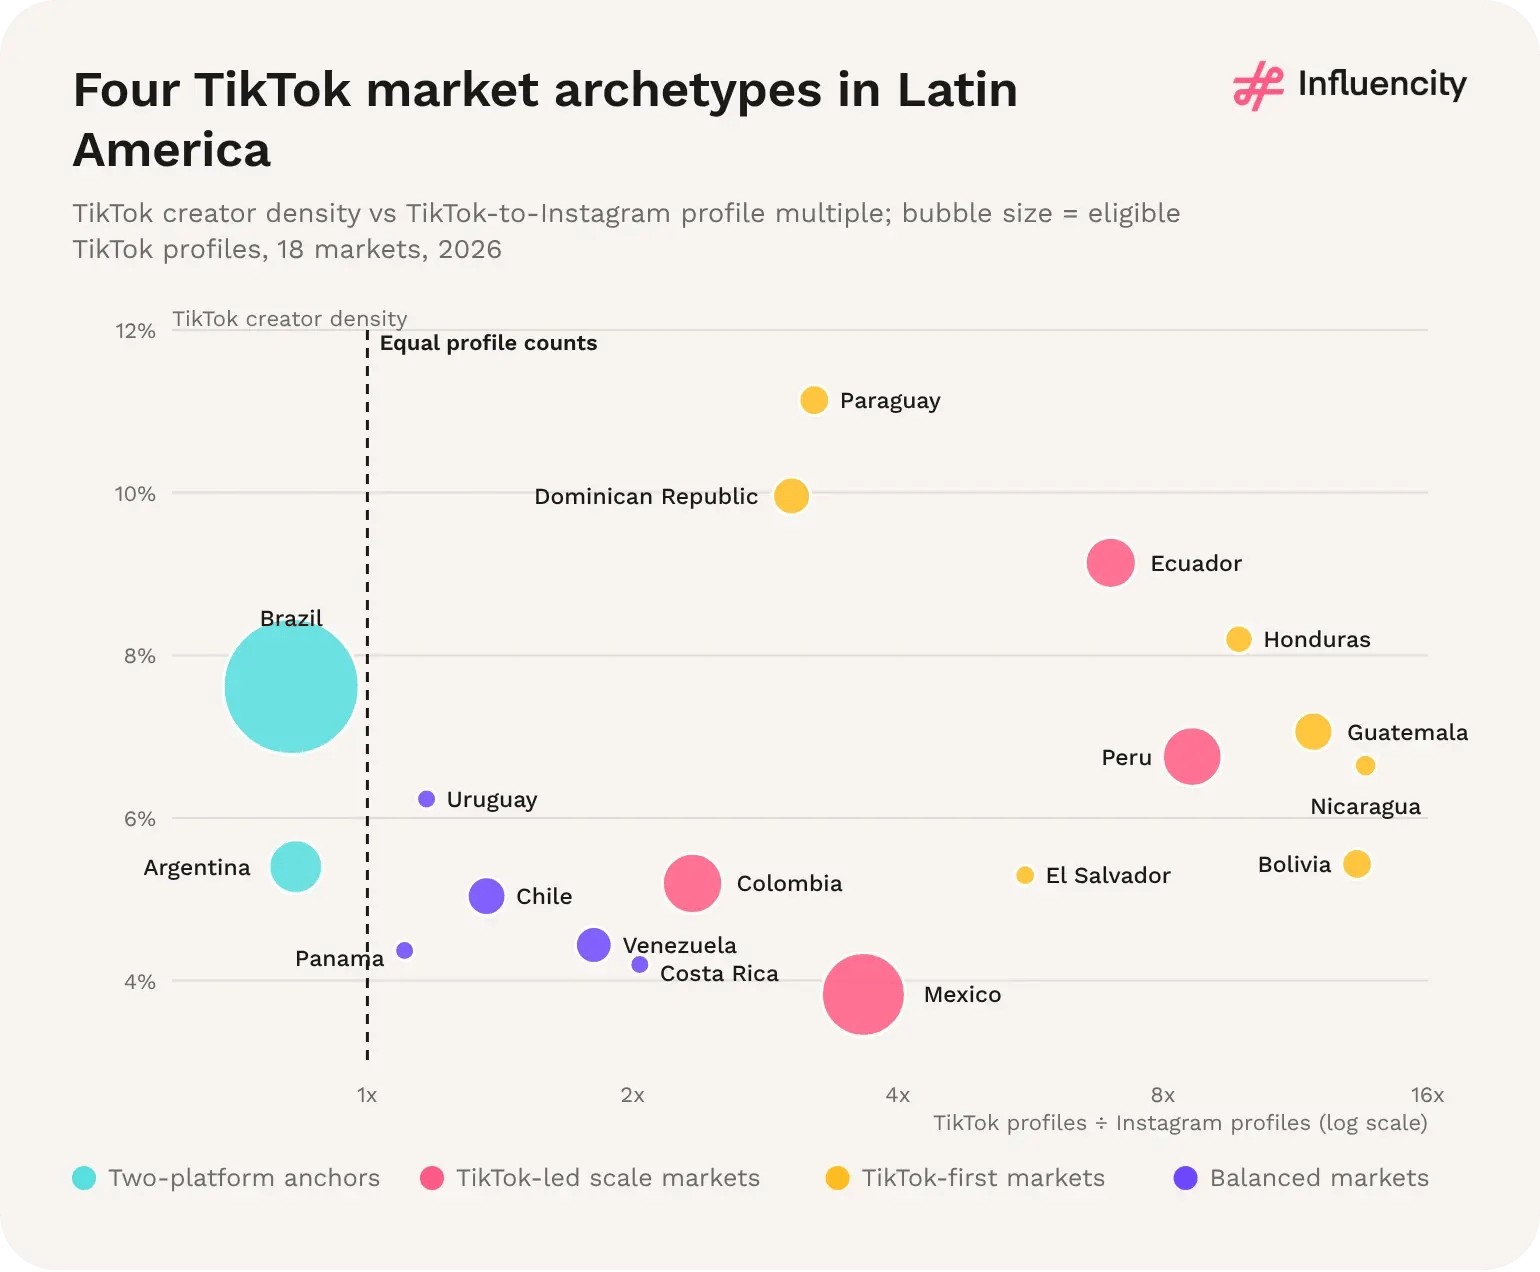
Figure 22 → TikTok creator density against the ratio of TikTok to Instagram eligible profiles (log scale); bubble size shows eligible TikTok profiles, 18 LATAM markets, 2026. Archetypes are Influencity groupings. Sources: [1, 2].
The two-platform anchors hold 44.1% of eligible LATAM TikTok profiles but 37.2% of estimated users. The TikTok-led scale markets are the reverse, with 34.6% of profiles against 41.9% of users, mainly because of Mexico. The seven TikTok-first markets hold 13.7% of profiles and 11.0% of users at the highest combined density (7.55%), while the balanced markets hold 7.7% of profiles and 9.8% of users at 4.74% density. [1]
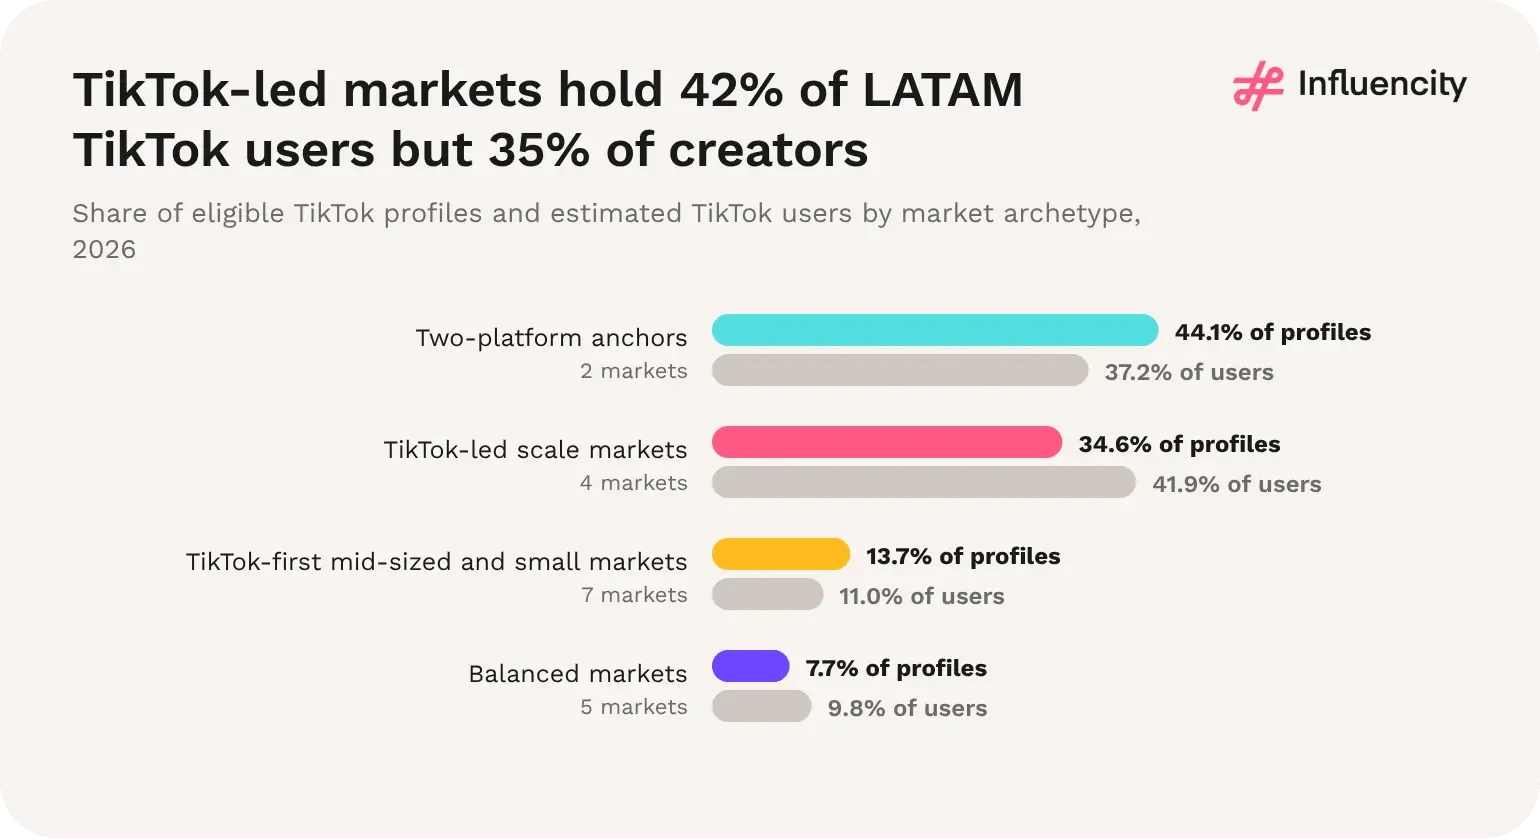
Figure 23 → Share of eligible TikTok profiles and estimated TikTok users by market archetype, 20 LATAM markets, 2026. Cuba and Puerto Rico (under 0.1% of each) not shown. Source: [1].
The scorecard summarises six indicators for each of the 18 markets with reliable records: eligible profiles, share of the regional pool, creator density, estimated penetration, TikTok-to-Instagram profile multiple and the share of tier records with 10,000+ followers. No market leads on every measure. Brazil leads on scale, Paraguay on density, Ecuador on penetration, Nicaragua on the platform multiple and Mexico on the 10,000+ share. [1, 2]
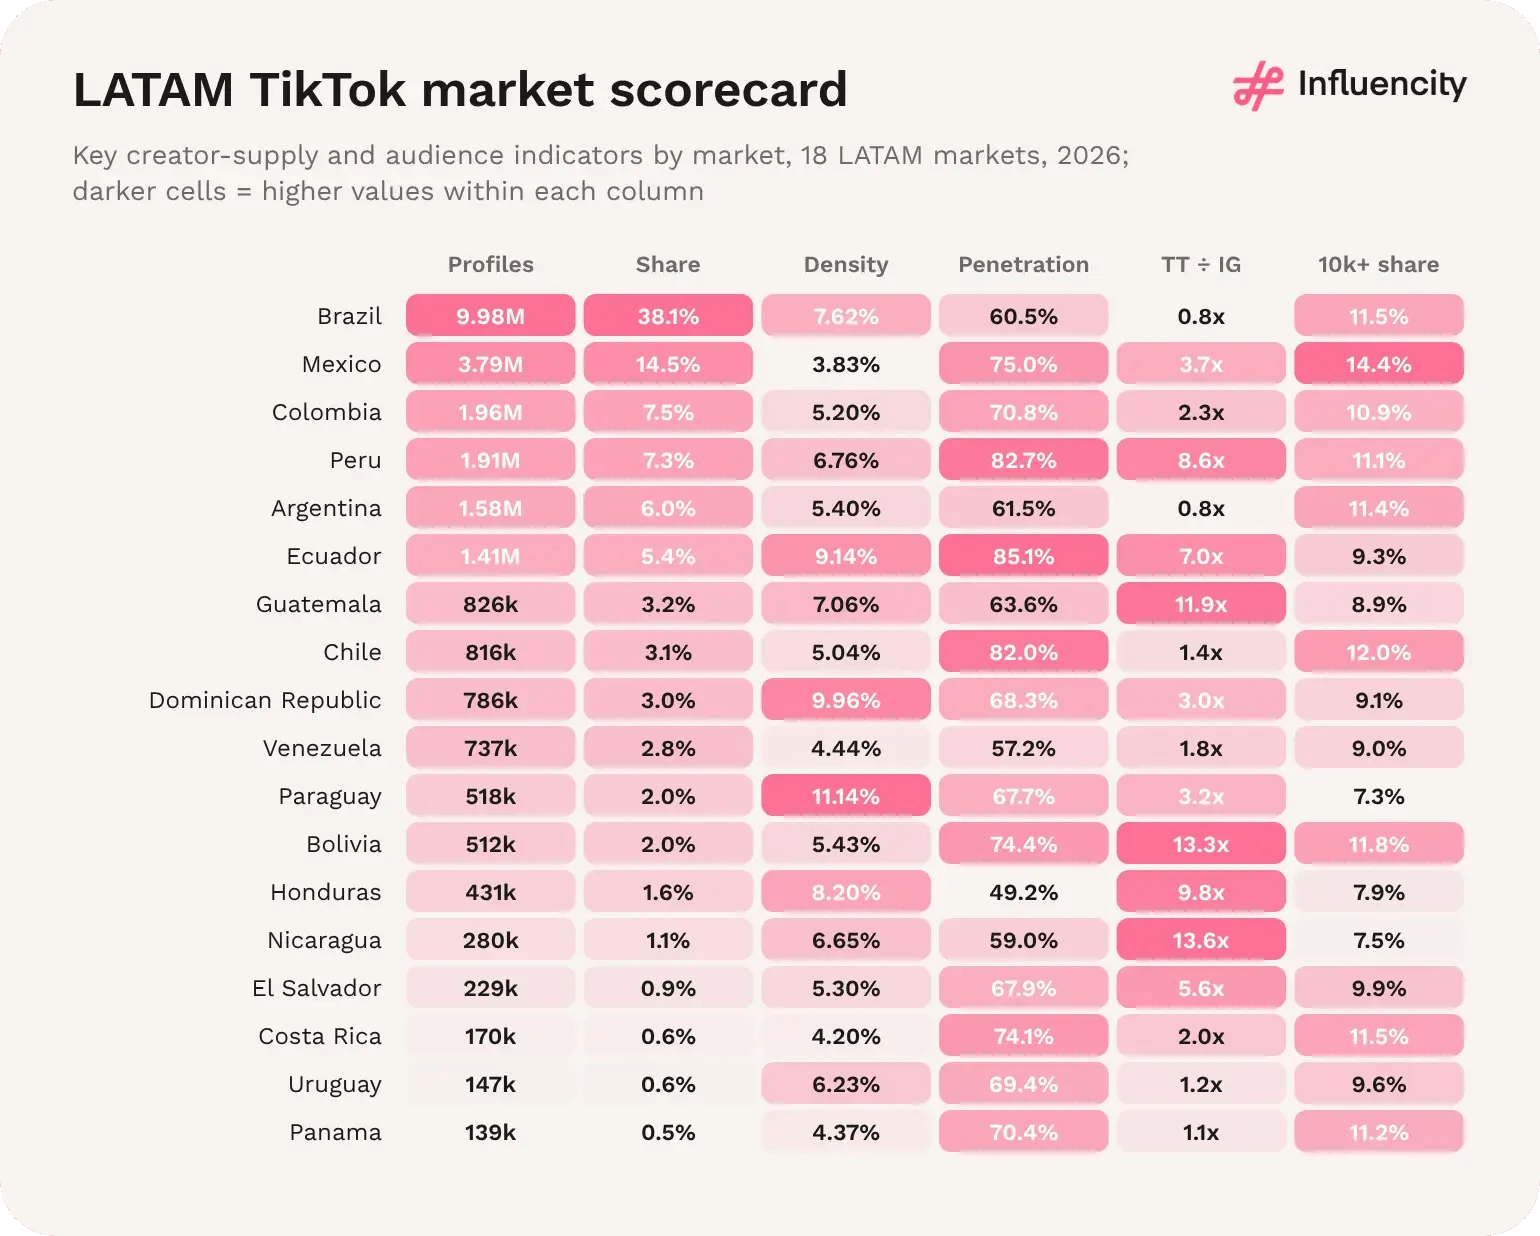
Figure 24 → Creator-supply and audience indicators by market, 18 LATAM markets, 2026. Darker cells show higher values within each column; 10k+ share uses tier records. Sources: [1, 2].
Largest pools: Brazil (9,980,579) and Mexico (3,793,376) eligible TikTok profiles (Influencity, 2026). [1]
Balanced markets: Chile, Venezuela, Costa Rica, Uruguay and Panama hold 7.7% of eligible TikTok profiles, at a combined creator density of 4.74%. [1, 2]
Instagram-leaning markets: Brazil and Argentina each record about 0.8 TikTok profiles per Instagram profile. [1, 2]
TikTok-led scale markets: Mexico, Colombia, Peru and Ecuador hold 9.07M eligible profiles and 41.9% of estimated LATAM TikTok users. [1]
TikTok-first markets: seven mid-sized and small markets hold 3.58M eligible TikTok profiles, 5.6 times their combined Instagram pool. [1, 2]
1. Platform choice is a market-level decision. The same regional brief can call for an Instagram-led plan in Argentina and a TikTok-led plan in Peru or Guatemala. [1, 2]
2. In the TikTok-led scale markets, audience runs ahead of creators. These four markets hold 41.9% of estimated users but 34.6% of eligible profiles, so creator recruitment is more likely than audience reach to be the constraint. [1]
3. Small markets matter more on TikTok than on Instagram. The seven TikTok-first markets hold 13.7% of LATAM TikTok profiles but only 3.4% of Instagram profiles. [1, 2]
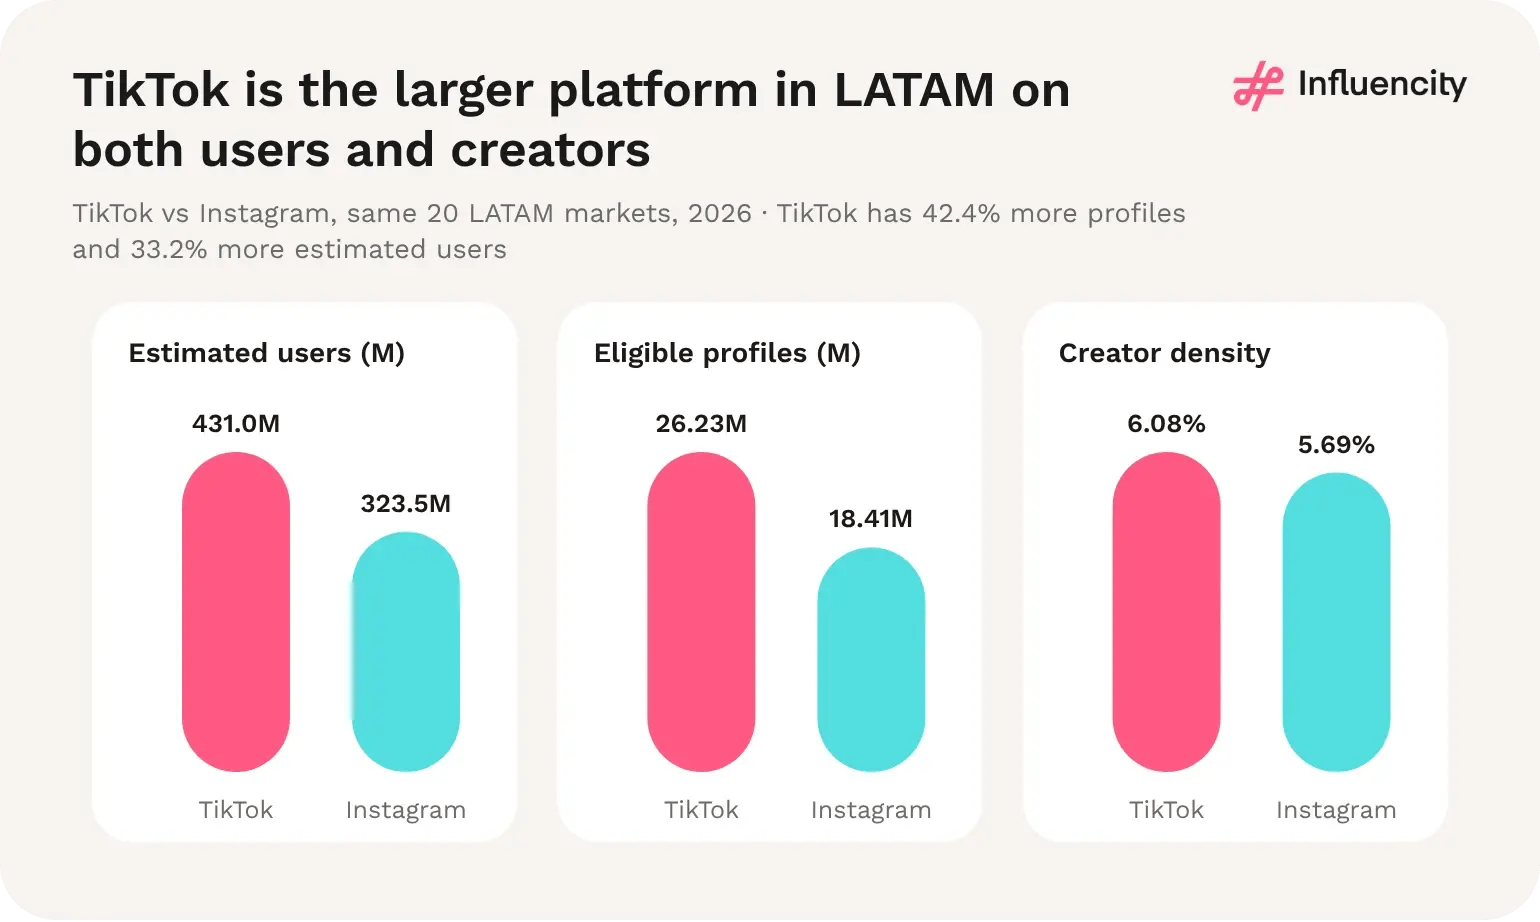
Figure 25 → TikTok has 42.4% more profiles and 33.2% more estimated users; the density ratio is 1.07x. Sources: [1, 2].
Creators and users can appear on both platforms, so their totals must not be added as unique people. [1, 2]
On recorded supply, TikTok. Across the same 20 markets, Influencity's 2026 data, collected in October–November 2026, record 26.23M eligible TikTok profiles against 18.41M on Instagram, 1.42 times as many, and 431.0M estimated TikTok users against 323.5M (1.33 times). Because both creators and audience are larger, TikTok's creator density is only 1.07 times Instagram's (6.08% vs 5.69%). [1, 2]
Much larger. Excluding Brazil, the 19 Spanish-speaking markets record 2.61 times as many eligible TikTok as Instagram profiles (16.25M vs 6.23M) and 1.65 times as many estimated users. Brazil, with 2.20M more Instagram than TikTok profiles, pulls the regional ratio down; Argentina adds a further 0.32M in Instagram's favour. [1, 2]
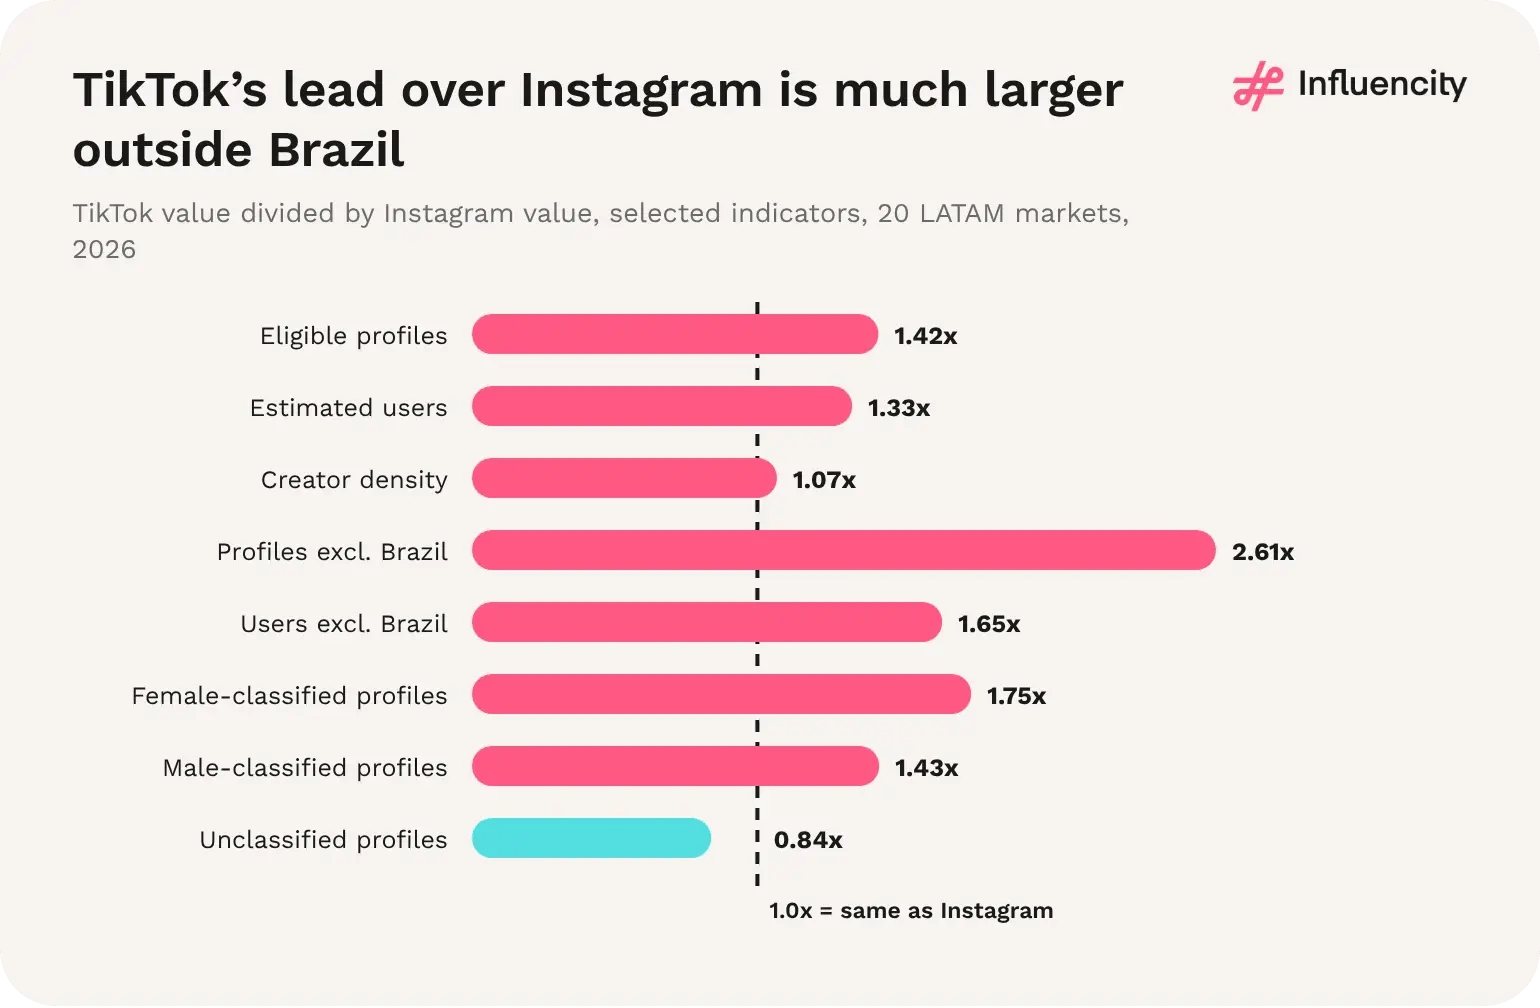
Figure 26 → Ratio of TikTok to Instagram values for selected indicators, 20 LATAM markets, 2026. A value above 1.0 means TikTok is larger. Sources: [1, 2].
TikTok records 7.81M more eligible profiles than Instagram across the region. The Andean markets contribute 4.82M of that difference, Mexico 2.76M, Central America 1.69M, the Caribbean 0.48M and the Southern Cone 0.27M, while Brazil subtracts 2.20M. [1, 2]
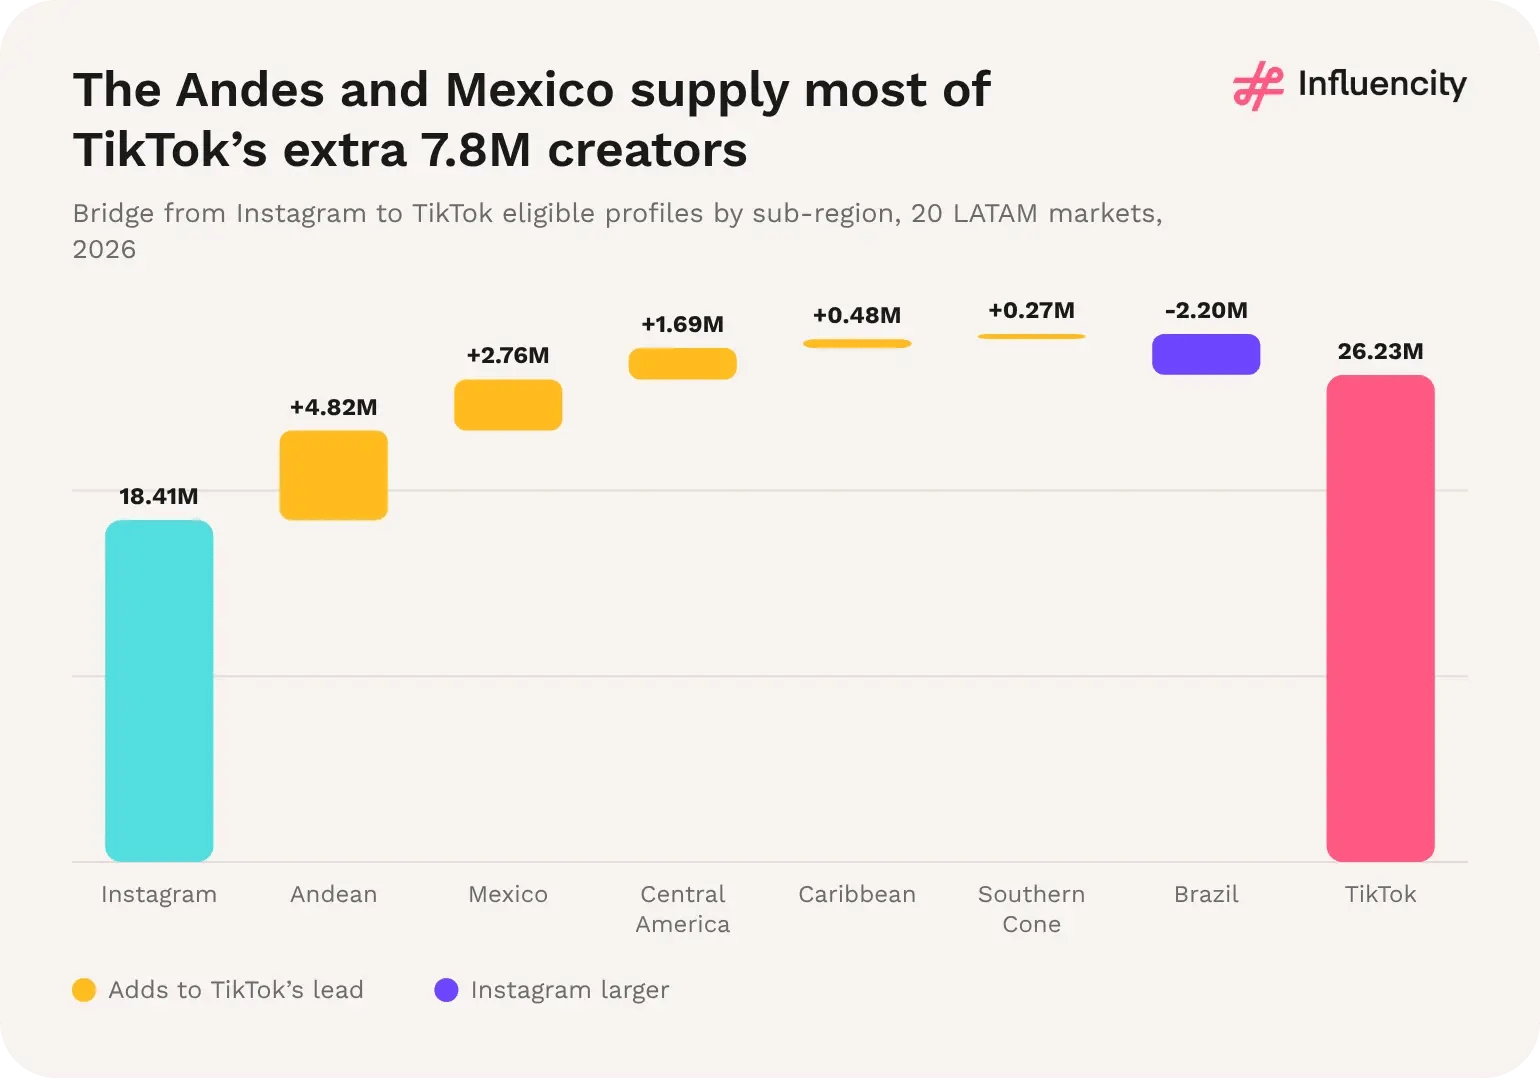
Figure 27 → Bridge from Instagram to TikTok eligible profiles by sub-region, 20 LATAM markets, 2026. Andean: Colombia, Peru, Ecuador, Bolivia, Venezuela. Southern Cone: Argentina, Chile, Uruguay, Paraguay. Caribbean: Dominican Republic, Puerto Rico, Cuba. Sources: [1, 2].
TikTok profiles are more often classified, and more often classified as female. Female-classified profiles make up 56.0% of all eligible TikTok profiles against 45.6% on Instagram, male-classified profiles are 29.0% and 28.9%, and unclassified profiles fall from 25.4% on Instagram to 15.0% on TikTok. Among classified profiles only, the female share is 65.9% on TikTok and 61.2% on Instagram. Gender classification is a dataset field, not creators' self-identification. [1, 2]
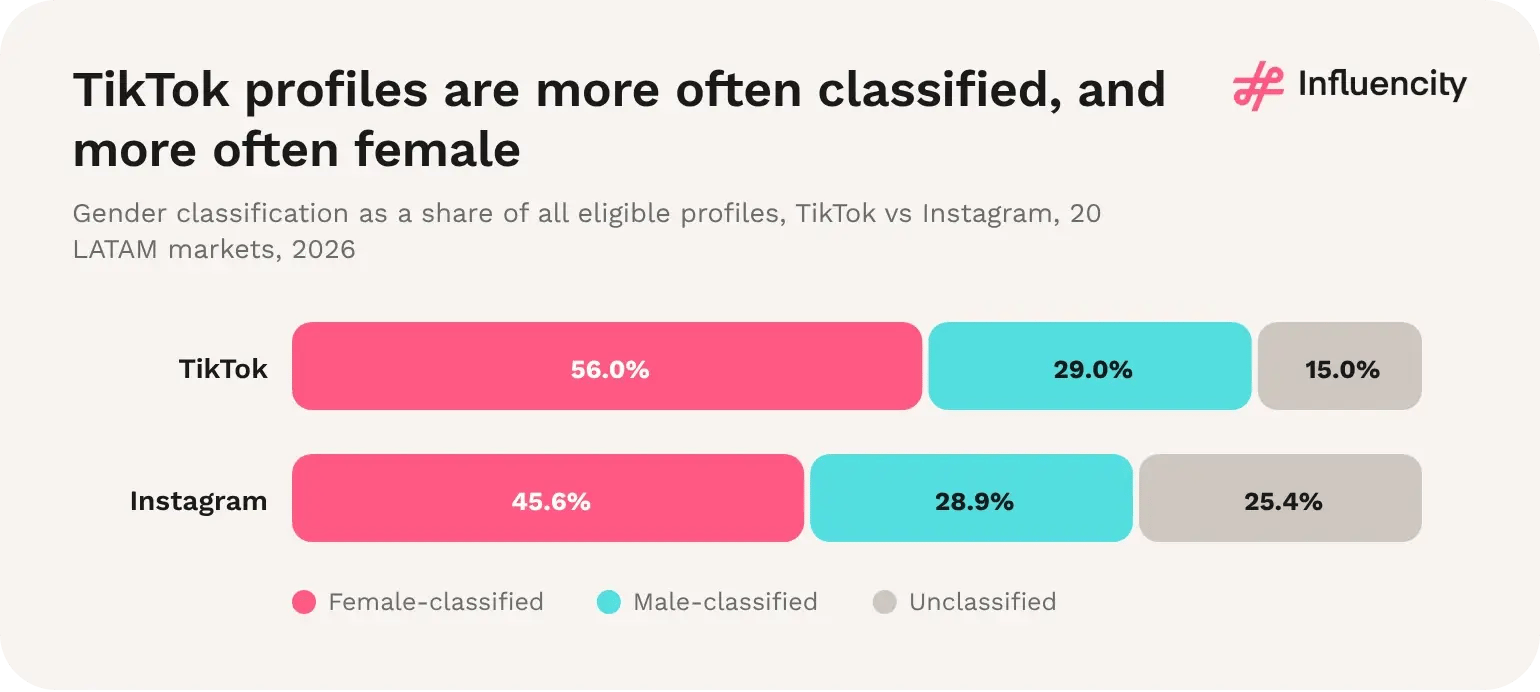
Figure 28 → Gender classification as a share of all eligible profiles, TikTok vs Instagram, 20 LATAM markets, 2026. Sources: [1, 2].
Creator supply: 26.23M eligible TikTok profiles against 18.41M on Instagram, 1.42 times as many (Influencity, 2026). [1, 2]
Audience: 431.0M estimated TikTok users against 323.5M on Instagram, 1.33 times as many. [1, 2]
Density: 6.08% on TikTok and 5.69% on Instagram, a ratio of 1.07. [1, 2]
Spanish-speaking LATAM: 2.61 times as many eligible TikTok as Instagram profiles once Brazil is excluded. [1, 2]
Extra supply: the Andean markets account for 4.82M of TikTok's 7.81M additional eligible profiles. [1, 2]
1. TikTok's lead is breadth, not density. TikTok has more creators and more users, so supply per user is similar on both platforms; the difference is that TikTok has scale in many more markets. [1, 2]
2. Brazil hides the size of the shift. The regional profile ratio is 1.42; outside Brazil it is 2.61. Region-wide averages understate how TikTok-led Spanish-speaking LATAM has become. [1, 2]
3. TikTok's female lead is partly a classification effect. TikTok has 1.75 times as many female-classified profiles as Instagram and 1.43 times as many male-classified ones, but it also leaves fewer profiles unclassified, so part of the gap reflects classification coverage. [1, 2]
TikTok has more eligible profiles than Instagram in 16 of the 19 markets with comparable data. The exceptions are Brazil (0.82x), Argentina (0.83x) and Puerto Rico (0.13x); Cuba is a data gap. The largest TikTok multiples are in Nicaragua (13.6x), Bolivia (13.3x), Guatemala (11.9x), Honduras (9.8x) and Peru (8.6x). [1, 2]
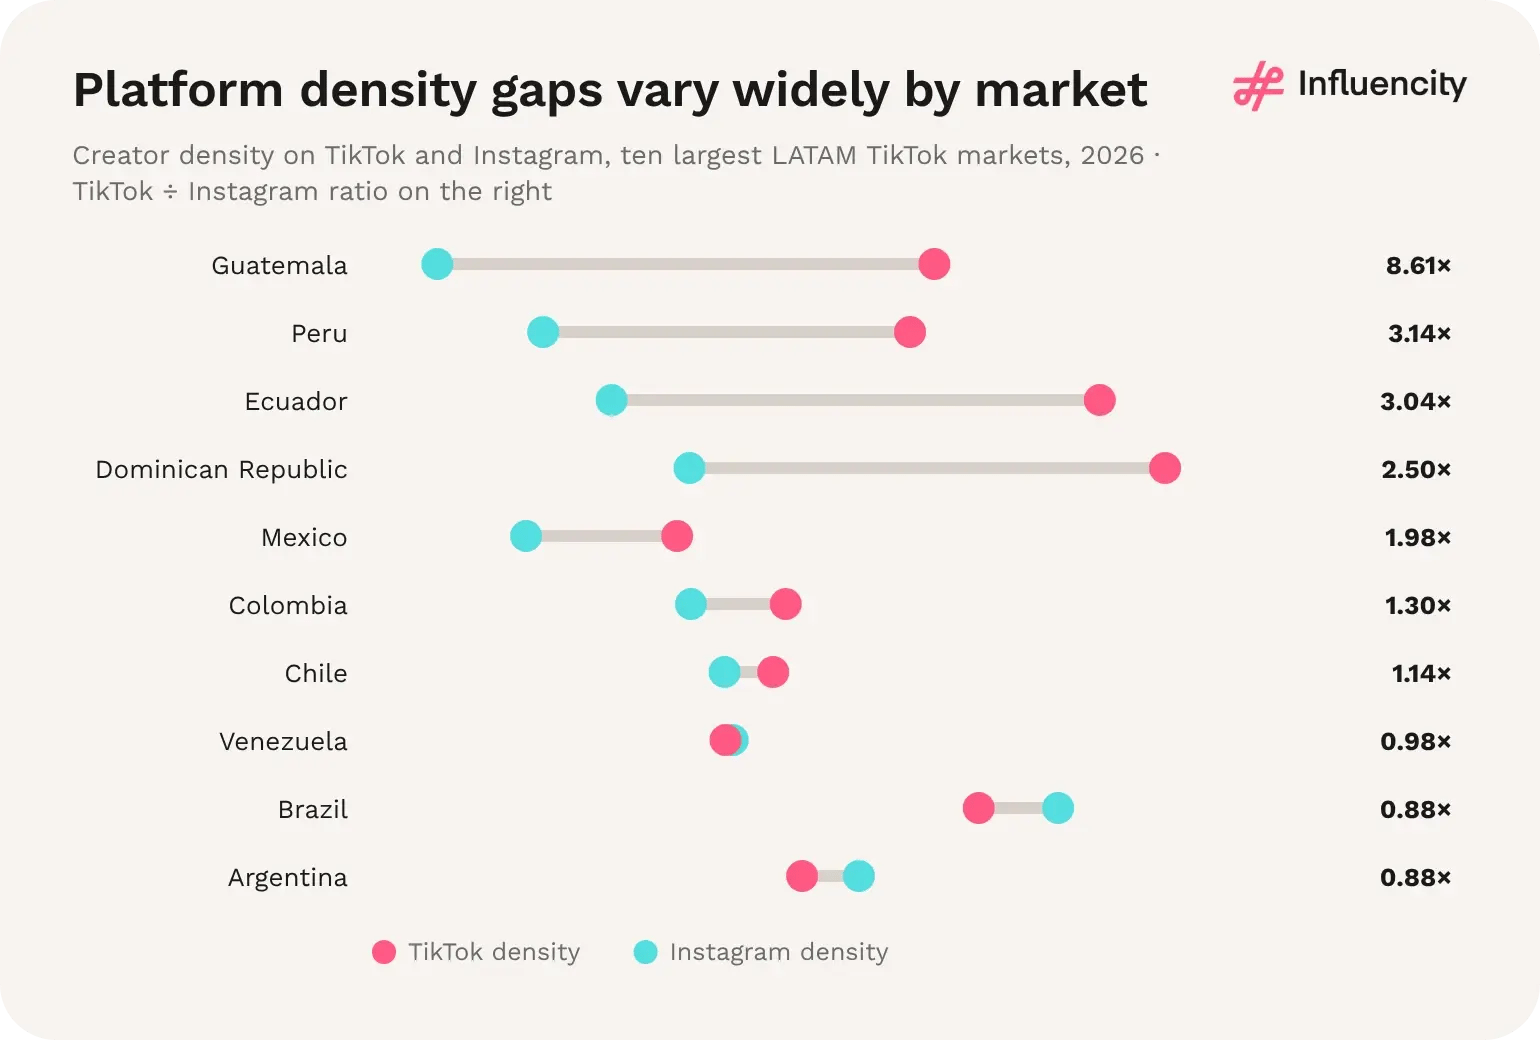
Figure 29 → Platform-density differences vary widely by market; the regional 1.07x ratio is not a local rule. Sources: [1, 2].
Brazil is the main reason the regional ratio is close to parity: its Instagram density (8.62%) is higher than its TikTok density (7.62%), and it dominates the Instagram total. In Spanish-speaking LATAM, TikTok's density advantage is closer to what the US and Europe show. Treat platform selection as a market-and-category decision, and see Appendix D for every market. [1, 2]
TikTok records more eligible creators than Instagram in 16 of the 19 markets with comparable data; Cuba is excluded because its TikTok record is too small to compare. Only Brazil (0.82x), Argentina (0.83x) and Puerto Rico (0.13x) record more Instagram profiles. Influencity's 2026 data, collected in October–November 2026, show the gap ranges from 13.59 times in Nicaragua to near parity in Panama (1.10x). [1, 2]
By the ratio of eligible TikTok to Instagram profiles, the 19 markets fall into four groups. These bands are an editorial grouping for planning, not a dataset field. They use the ratio alone, whereas the archetypes in section 07 also weigh pool size: Paraguay and the Dominican Republic are TikTok-first archetypes but sit in the TikTok-led band, as do Venezuela and Costa Rica, which are balanced archetypes. [1, 2]
TikTok-dominant (more than 5x): Nicaragua, Bolivia, Guatemala, Honduras, Peru, Ecuador and El Salvador. Together they hold 21.3% of LATAM's eligible TikTok profiles but only 3.5% of Instagram's. [1, 2]
TikTok-led (1.5x to 5x): Mexico, Paraguay, the Dominican Republic, Colombia, Costa Rica and Venezuela, with 30.4% of TikTok profiles and 15.1% of Instagram profiles. [1, 2]
Close to parity (0.8x to 1.5x): Chile, Uruguay, Panama, Argentina and Brazil, with 48.3% of TikTok profiles and 81.1% of Instagram profiles. [1, 2]
Instagram-led (below 0.8x): Puerto Rico only, where TikTok records 4,941 eligible profiles against 39,517 on Instagram. [1, 2]
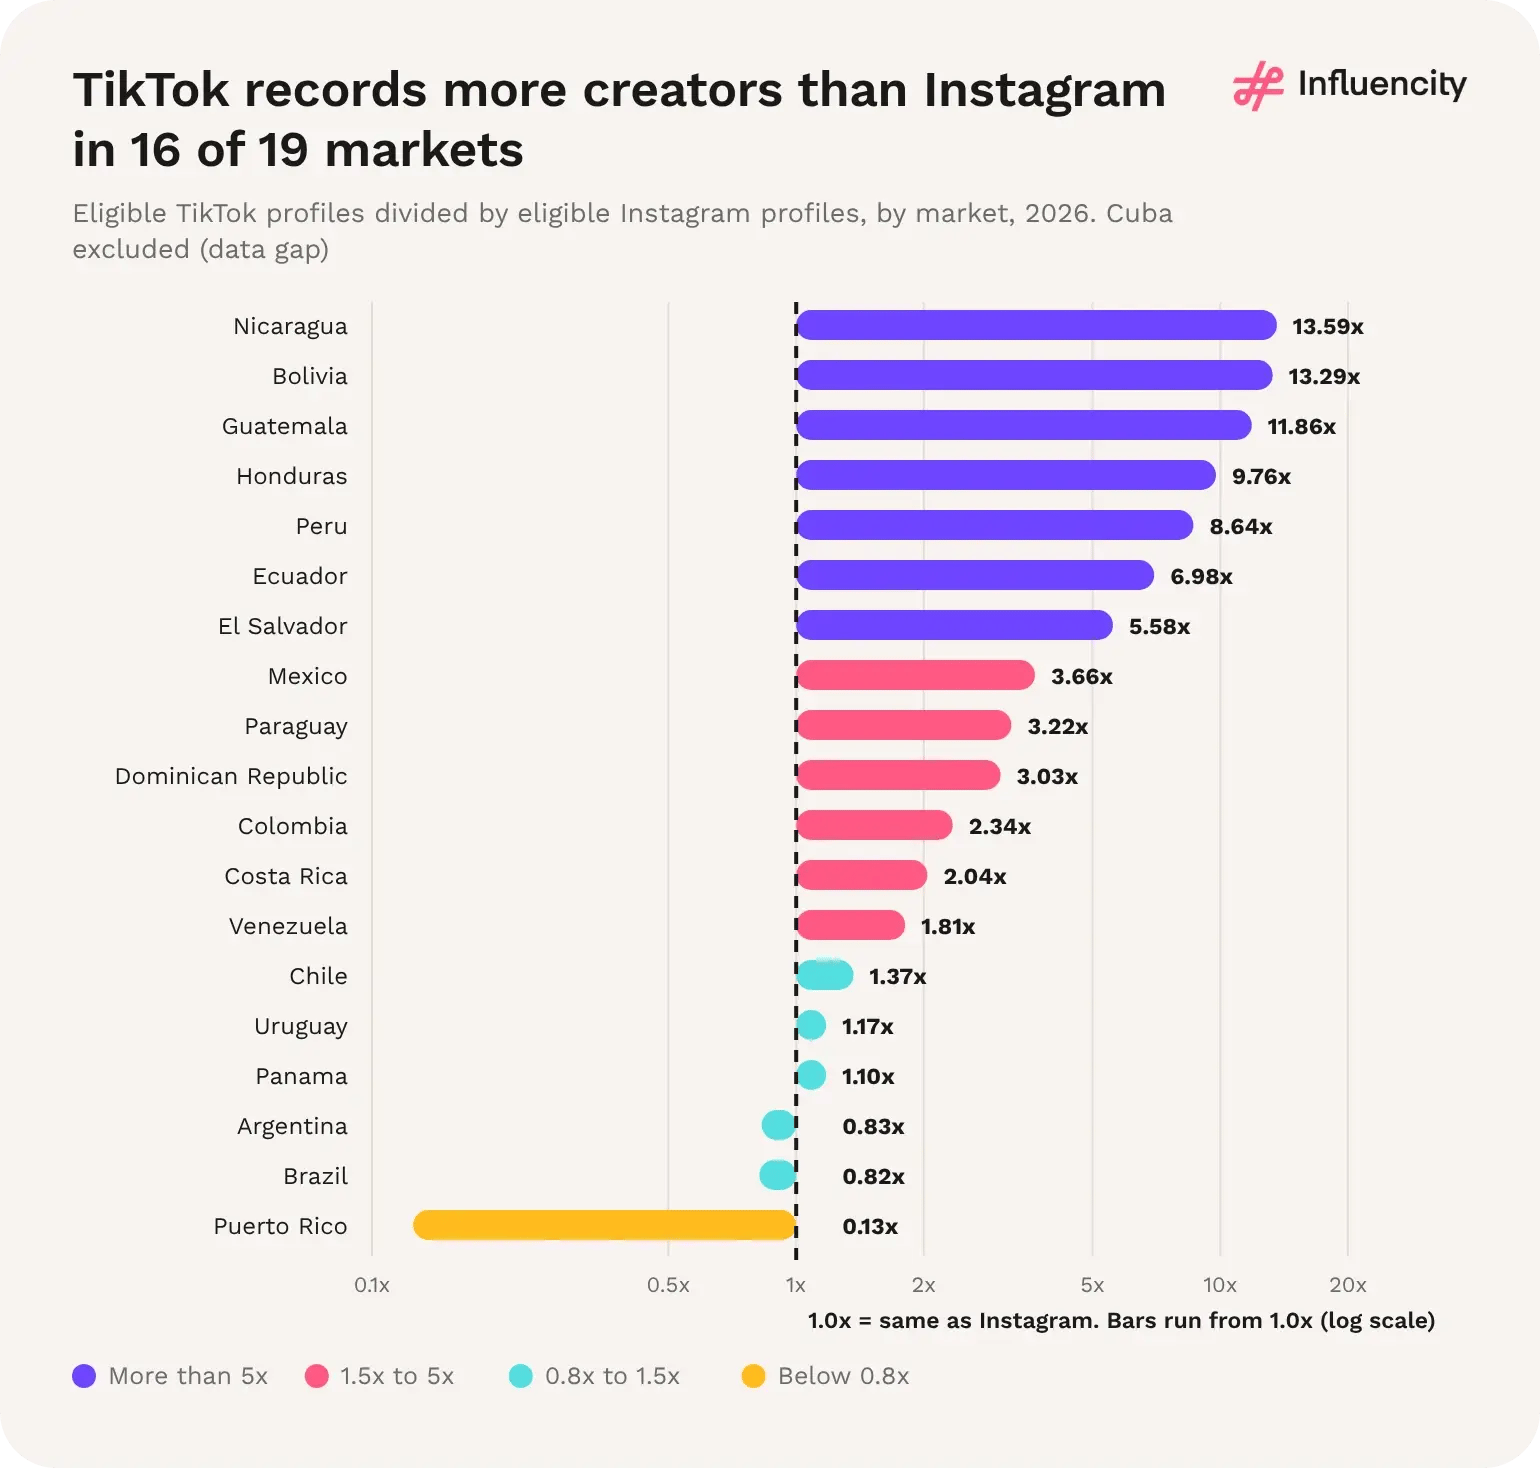
Figure 30 → Eligible TikTok profiles divided by eligible Instagram profiles, by market, 2026 (log scale). Cuba excluded because of a TikTok data gap. Sources: [1, 2].
Mostly by influencers. In 14 of the 19 markets, TikTok's lead in eligible profiles is larger than its lead in estimated users. Guatemala is the clearest case: TikTok has 1.38 times as many estimated users as Instagram but 11.86 times as many eligible profiles, because Instagram's recorded creator density there is only 0.82%. In the TikTok-dominant group, the profile ratio is 8.79 against a user ratio of 2.40. [1, 2]
The five exceptions, where the creator ratio is below the audience ratio, are Brazil, Argentina, Venezuela, Panama and Puerto Rico. In these markets Instagram converts its audience into eligible creators at least as well as TikTok does. [1, 2]
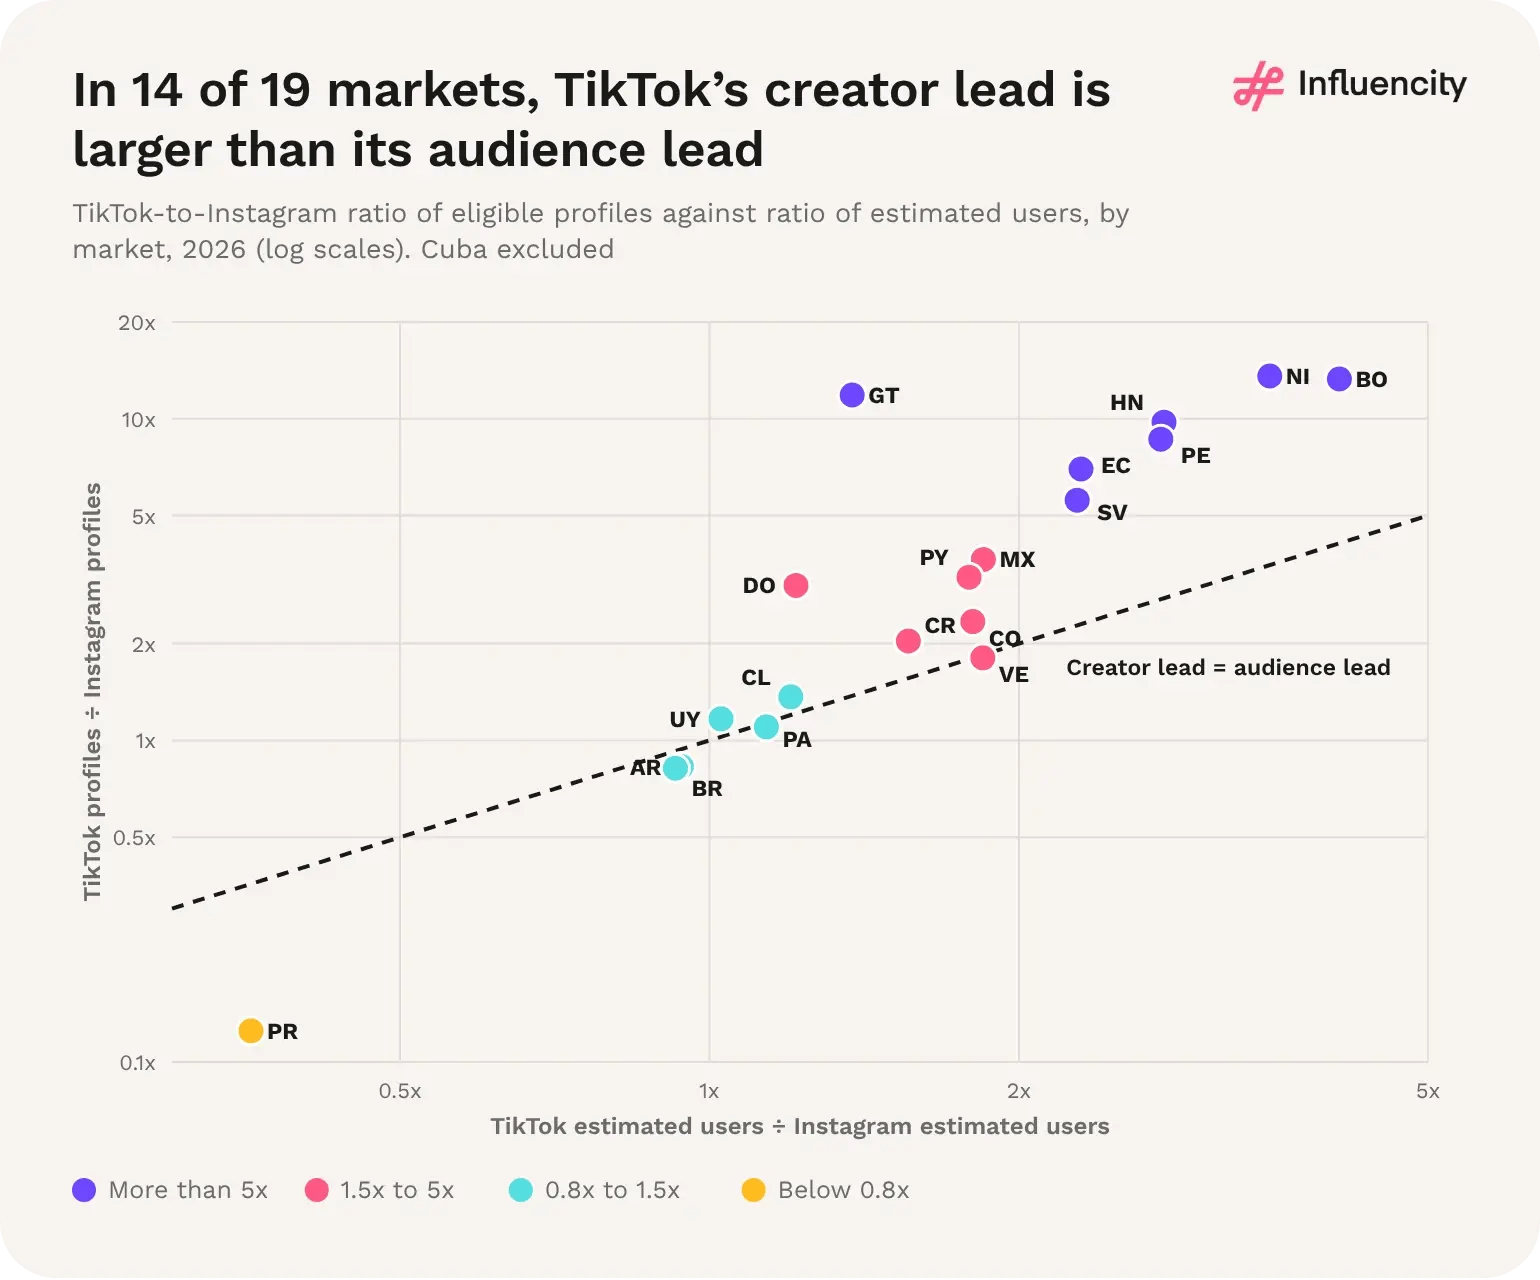
Figure 31 → TikTok-to-Instagram ratio of eligible profiles plotted against the ratio of estimated users, by market, 2026 (log scales). Points above the dashed line show a creator lead larger than the audience lead. Cuba excluded. Sources: [1, 2].
Brazil holds 66.2% of LATAM's eligible Instagram profiles but 38.1% of TikTok's. Mexico moves the other way, from 5.6% of Instagram's pool to 14.5% of TikTok's, and Peru rises from 1.2% to 7.3%. Argentina falls from 10.3% to 6.0%. Brazil and Argentina together account for 76.5% of Instagram's regional pool and 44.1% of TikTok's. [1, 2]
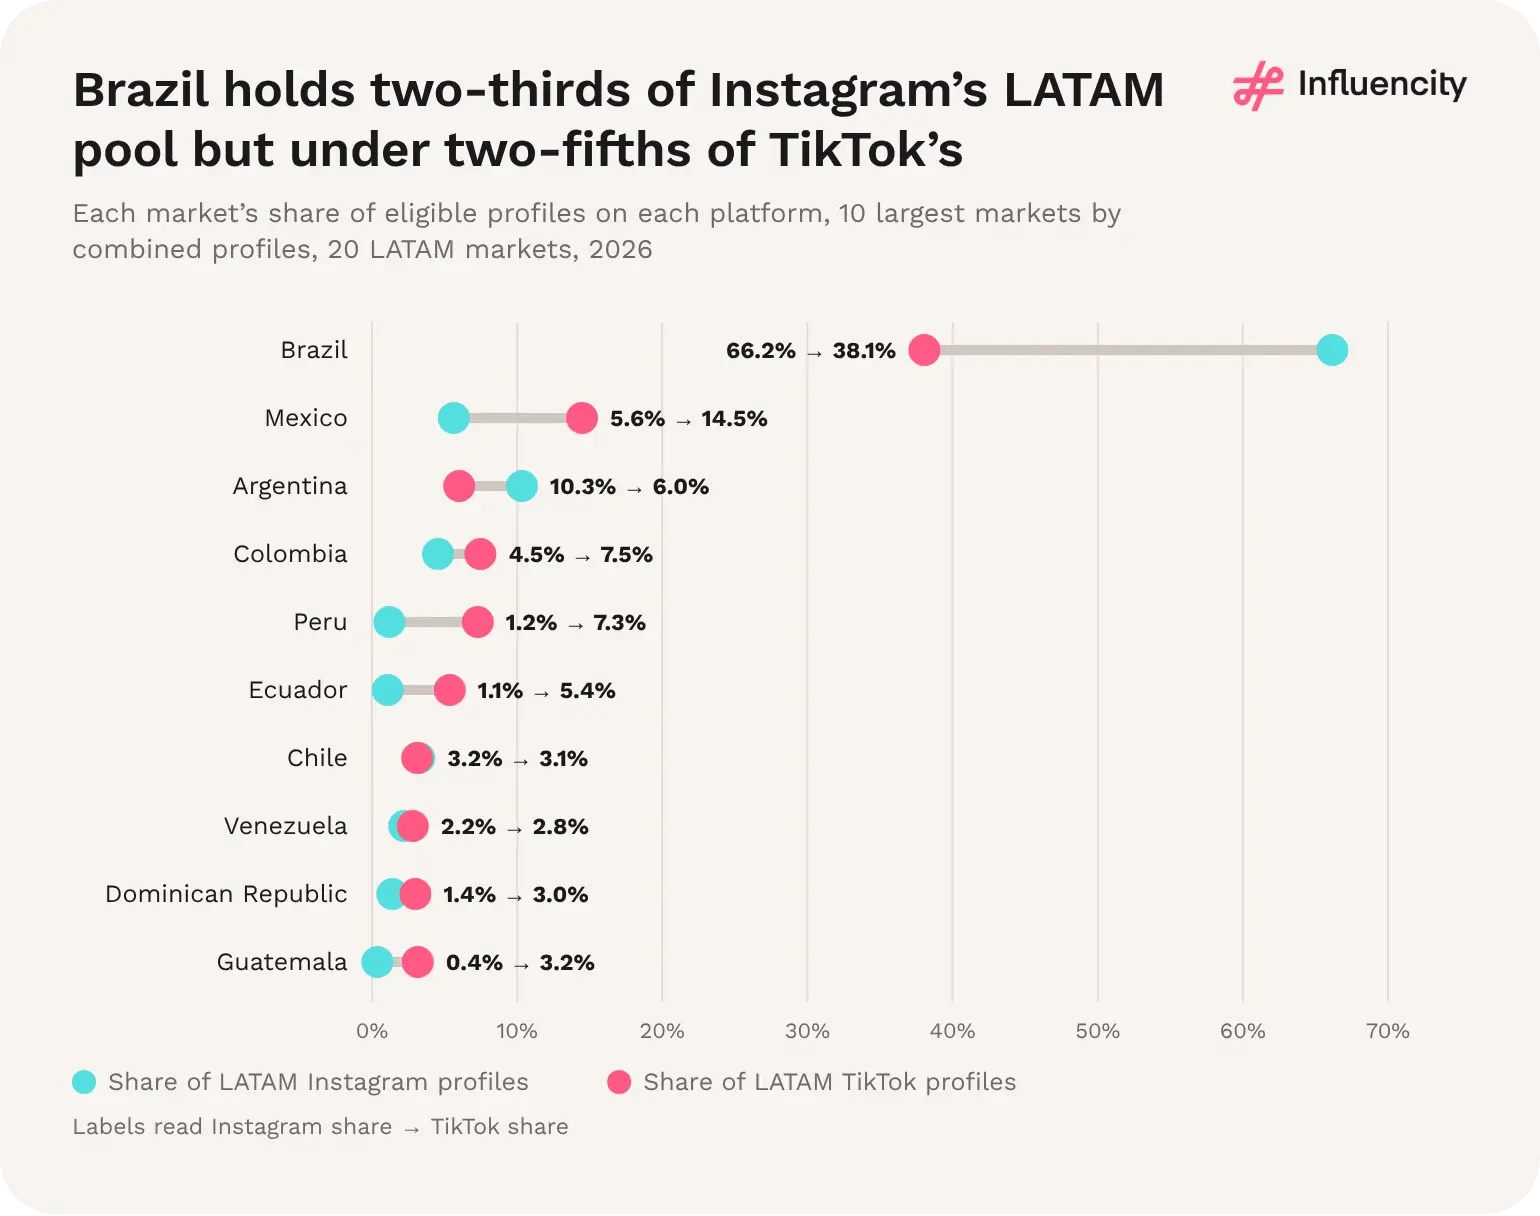
Figure 32 → Each market’s share of eligible profiles on each platform, 10 largest markets by combined eligible profiles, 20 LATAM markets, 2026. Sources: [1, 2].
Platform balance: TikTok records more eligible creators than Instagram in 16 of 19 LATAM markets with comparable data (Influencity, 2026). [1, 2]
Largest TikTok leads: Nicaragua (13.59x), Bolivia (13.29x) and Guatemala (11.86x) eligible TikTok profiles per Instagram profile. [1, 2]
Instagram-leaning markets: Brazil (0.82x), Argentina (0.83x) and Puerto Rico (0.13x). [1, 2]
Pool concentration: Brazil and Argentina hold 76.5% of LATAM's eligible Instagram profiles and 44.1% of TikTok's. [1, 2]
Mexico: 14.5% of LATAM's eligible TikTok profiles against 5.6% of Instagram's, 3.66 times as many TikTok as Instagram profiles. [1, 2]
1. The platform map splits along language and market size. The two largest Instagram markets, Brazil and Argentina, are the only large markets where Instagram records more creators; almost every Spanish-speaking market from Mexico to Bolivia leans to TikTok. [1, 2]
2. Very high ratios say as much about Instagram as about TikTok. In Guatemala, Bolivia and Nicaragua, Instagram's recorded creator density is below 2%, against a regional 5.69%. A ratio above 10x signals a thin Instagram creator base as much as a deep TikTok one. [1, 2]
3. Regional rankings change with the platform. Peru ranks fourth on TikTok and eighth on Instagram; Guatemala seventh and fourteenth. Argentina ranks second on Instagram and fifth on TikTok. A shortlist built from one platform will miss markets that matter on the other. [1, 2]
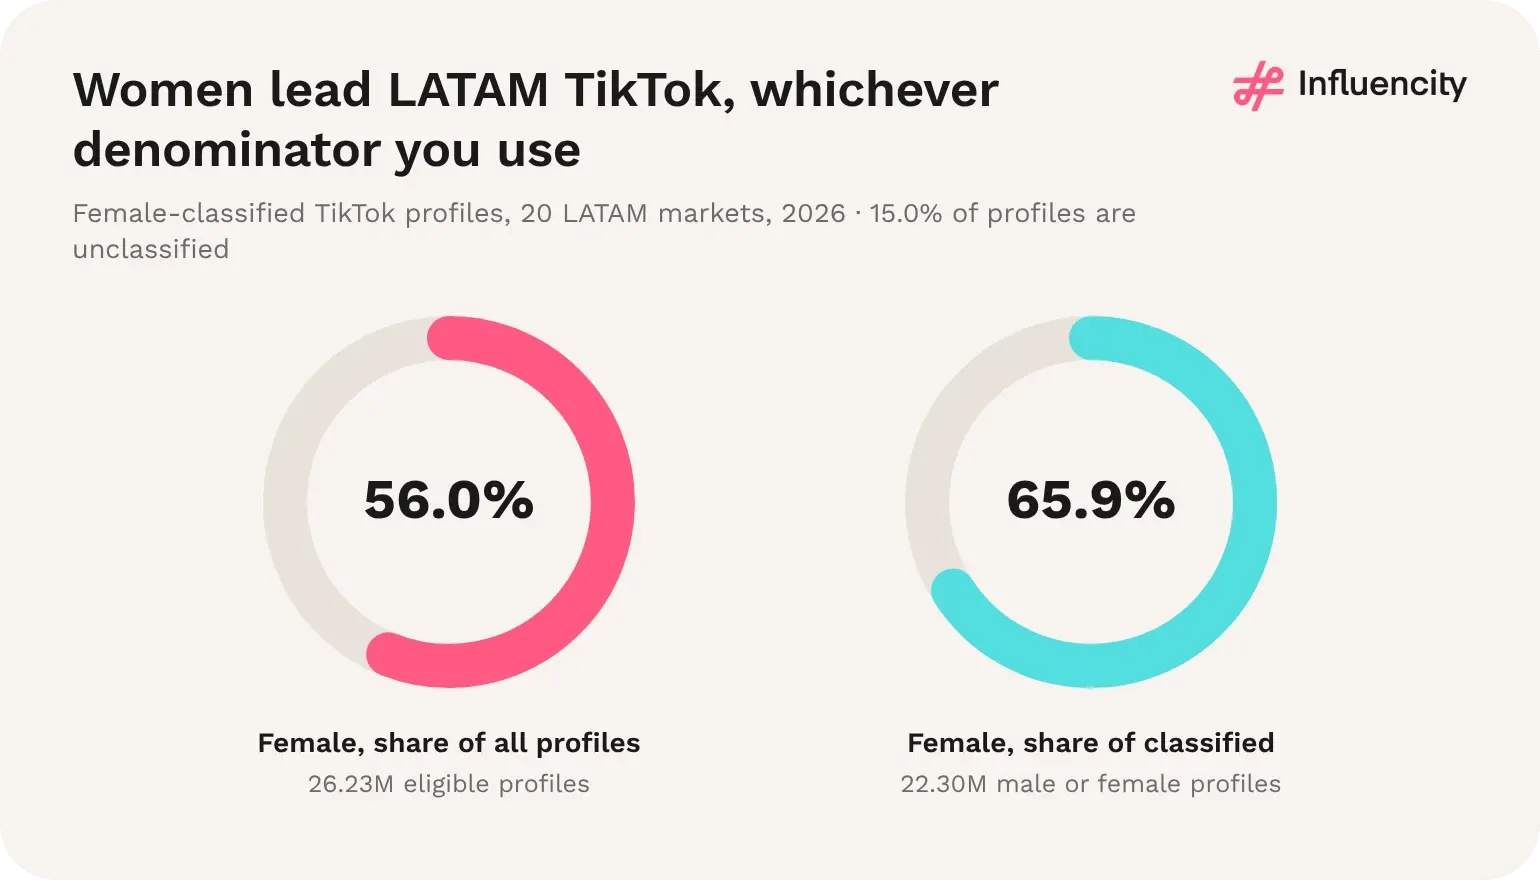
Figure 33 → Classified-only shares differ from shares of all eligible profiles. Classification is not self-identified gender. Source: [1].
LATAM TikTok is the most female-skewed of Influencity's 2026 datasets: 65.9% against 63.1% for US TikTok, 61.2% for LATAM Instagram, 60.2% for US Instagram, 59.8% for Europe Instagram and 54.4% for Europe TikTok. It also has the smallest unclassified share. [1–7]
The female share of classified tier entries falls from 66.6% in nano to 60.9% in micro and 53.3% in macro, and is 48.3% in mega (7,401 male, 6,905 female, 2,278 unclassified). Thirteen markets have male majorities among classified mega entries and six female majorities. Mexico (1,653 male, 1,609 female) and Brazil (3,241, 2,963) both lean male; Argentina (385, 415) leans female. [1]
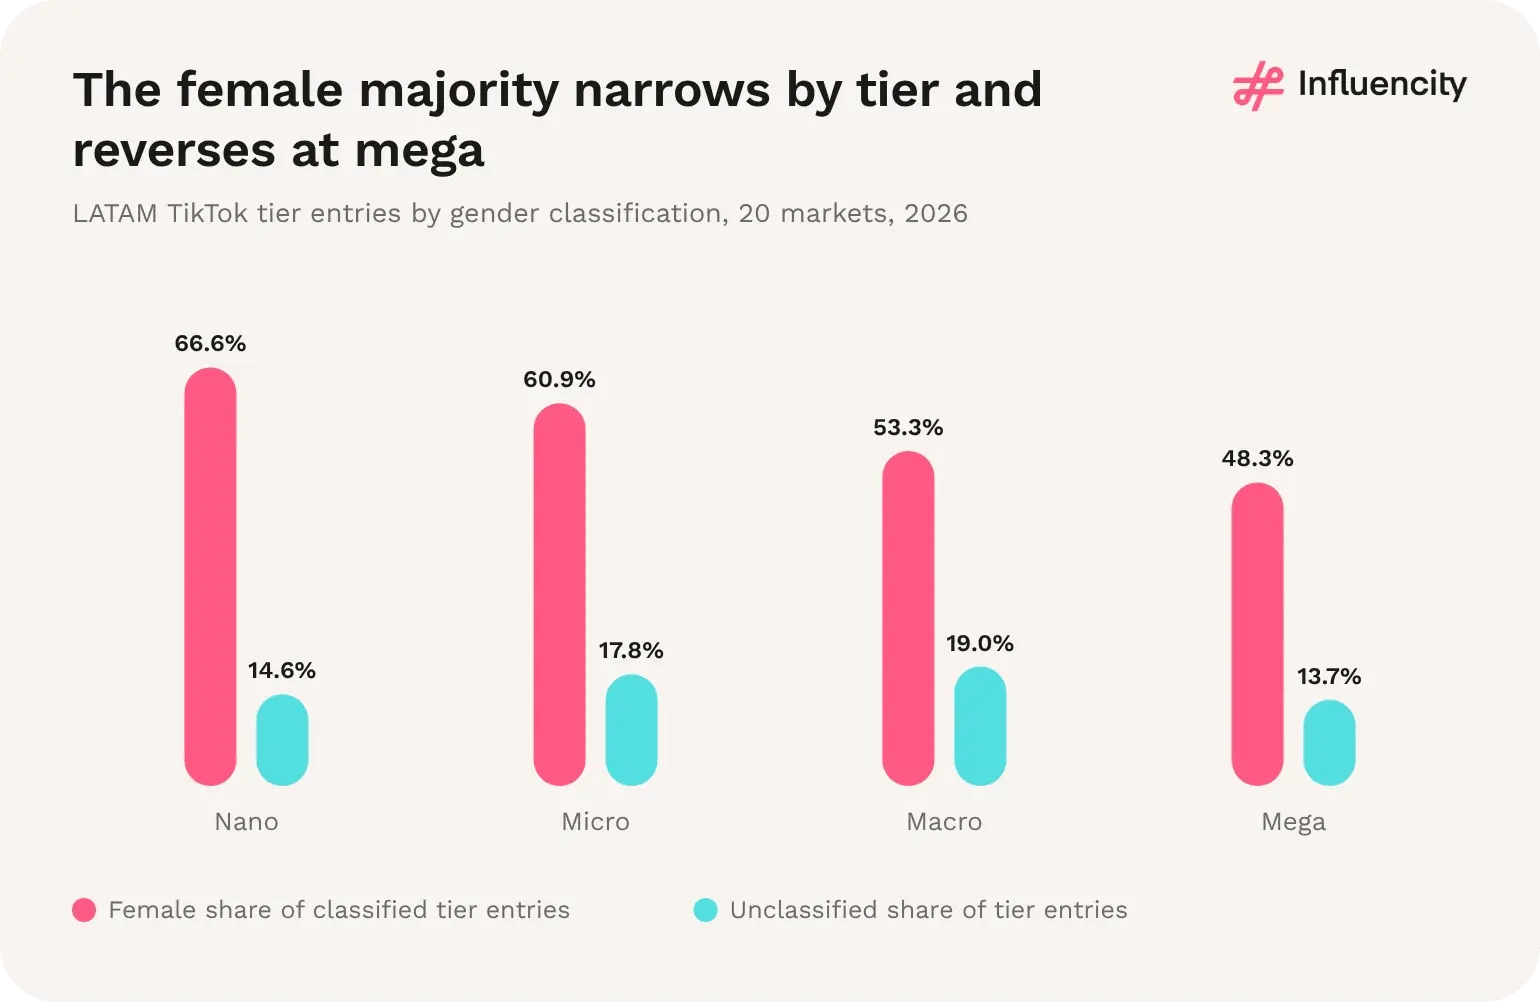
Figure 34 → Female share among classified tier entries falls with audience size and reverses at mega. Source: [1].
Among classified profiles, yes. Influencity's 2026 data, collected in October–November 2026, record 14,692,596 female-classified and 7,606,324 male-classified eligible TikTok profiles across 20 LATAM markets, 1.93 female-classified profiles for every male-classified one. A further 3,927,233 profiles (15.0%) have no gender classification. Gender here is a dataset classification, not creators' self-identification. [1]
Yes. Among classified profiles, the female share ranges from 61.4% in the Dominican Republic to 75.4% in Puerto Rico, against 65.9% for the region. Eleven markets sit above the regional share, led by Venezuela (70.4%), Colombia (70.0%) and Ecuador (69.6%). Brazil (64.1%), Chile (62.0%) and Guatemala (61.6%) are among the eight below it. Cuba is excluded because of its very small TikTok count. [1]
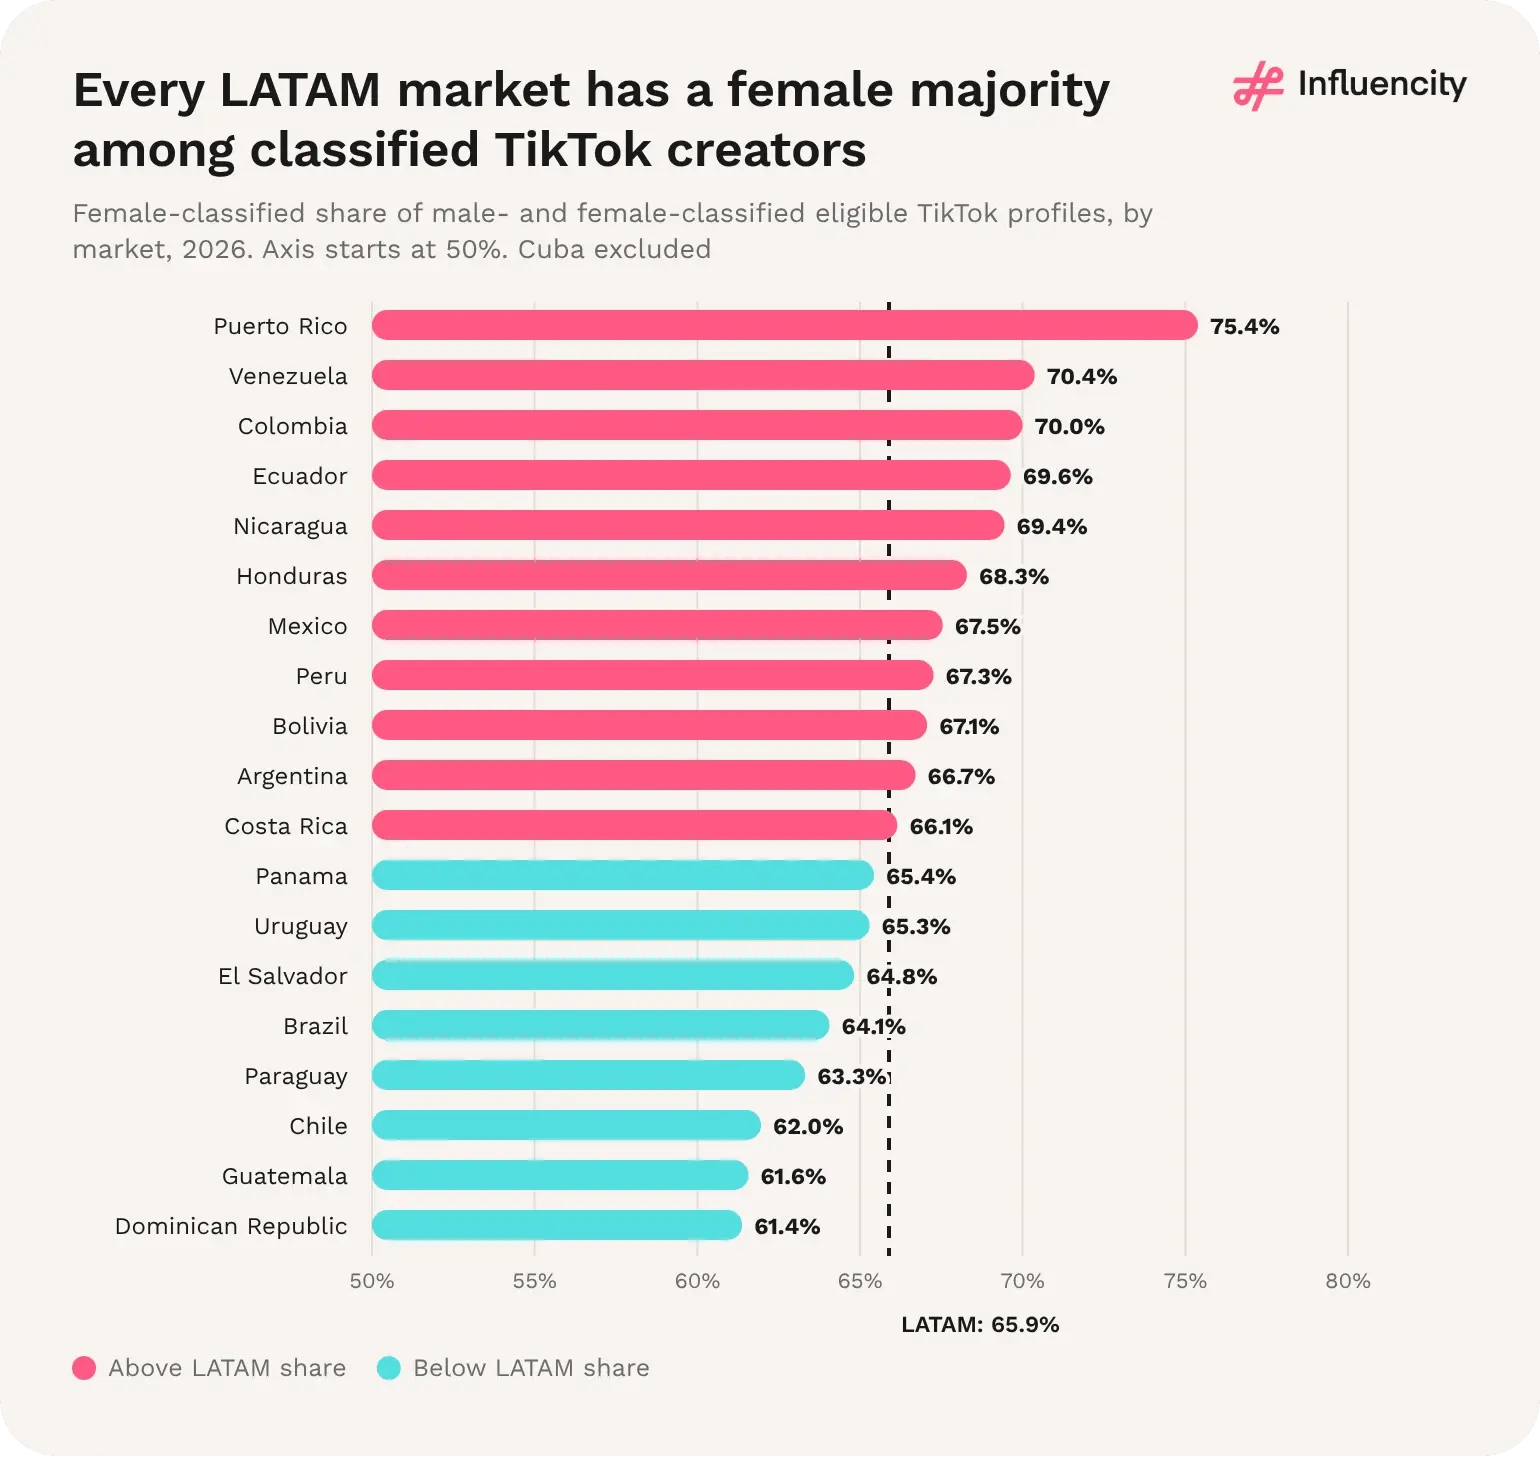
Figure 35 → Female-classified share of male- and female-classified eligible TikTok profiles, by market, 2026. Unclassified profiles excluded from the denominator. Cuba excluded. Source: [1].
In almost every market. The female share of classified profiles is 65.9% on TikTok and 61.2% on Instagram across LATAM, and TikTok's share is higher in 18 of 19 markets. The widest gaps are in Puerto Rico (18.9 points), Colombia (12.5) and Panama (11.1). Paraguay is the only exception, 0.6 points lower on TikTok. [1, 2]
TikTok also leaves fewer profiles unclassified in every market: 15.0% of eligible profiles regionally, against 25.4% on Instagram. Because classification coverage differs, compare gender mix on classified profiles only. [1, 2]
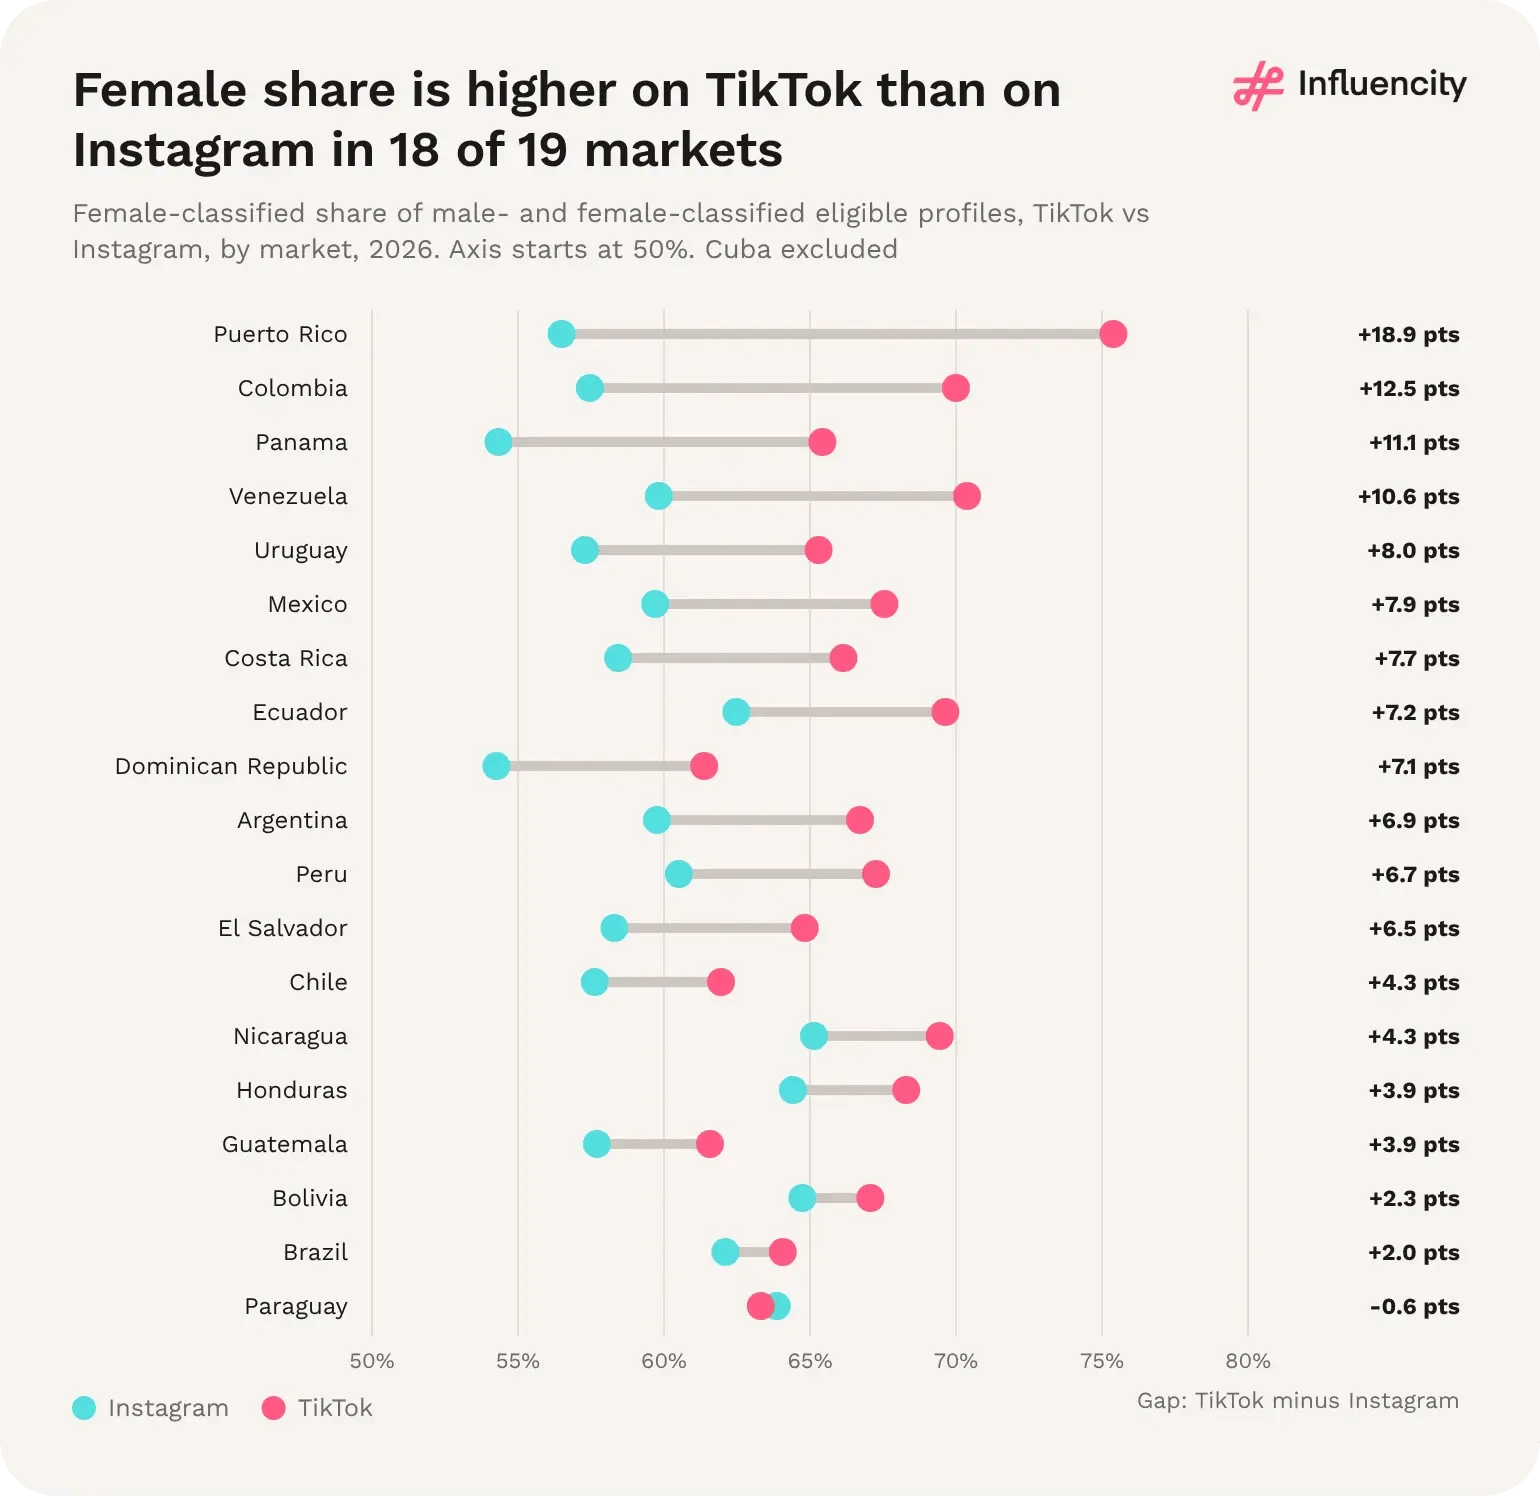
Figure 36 → Female-classified share of male- and female-classified eligible profiles, TikTok vs Instagram, by market, 2026. Gap in percentage points. Cuba excluded. Sources: [1, 2].
Paraguay records 62.9 female-classified eligible TikTok profiles per 1,000 estimated TikTok users, almost twice the regional 34.1. Ecuador (55.7), the Dominican Republic (54.4) and Honduras (51.0) follow. Mexico has the second-largest female pool, 2.15M profiles, but the lowest rate among large markets (21.8 per 1,000 users) because its estimated audience is so large. [1]
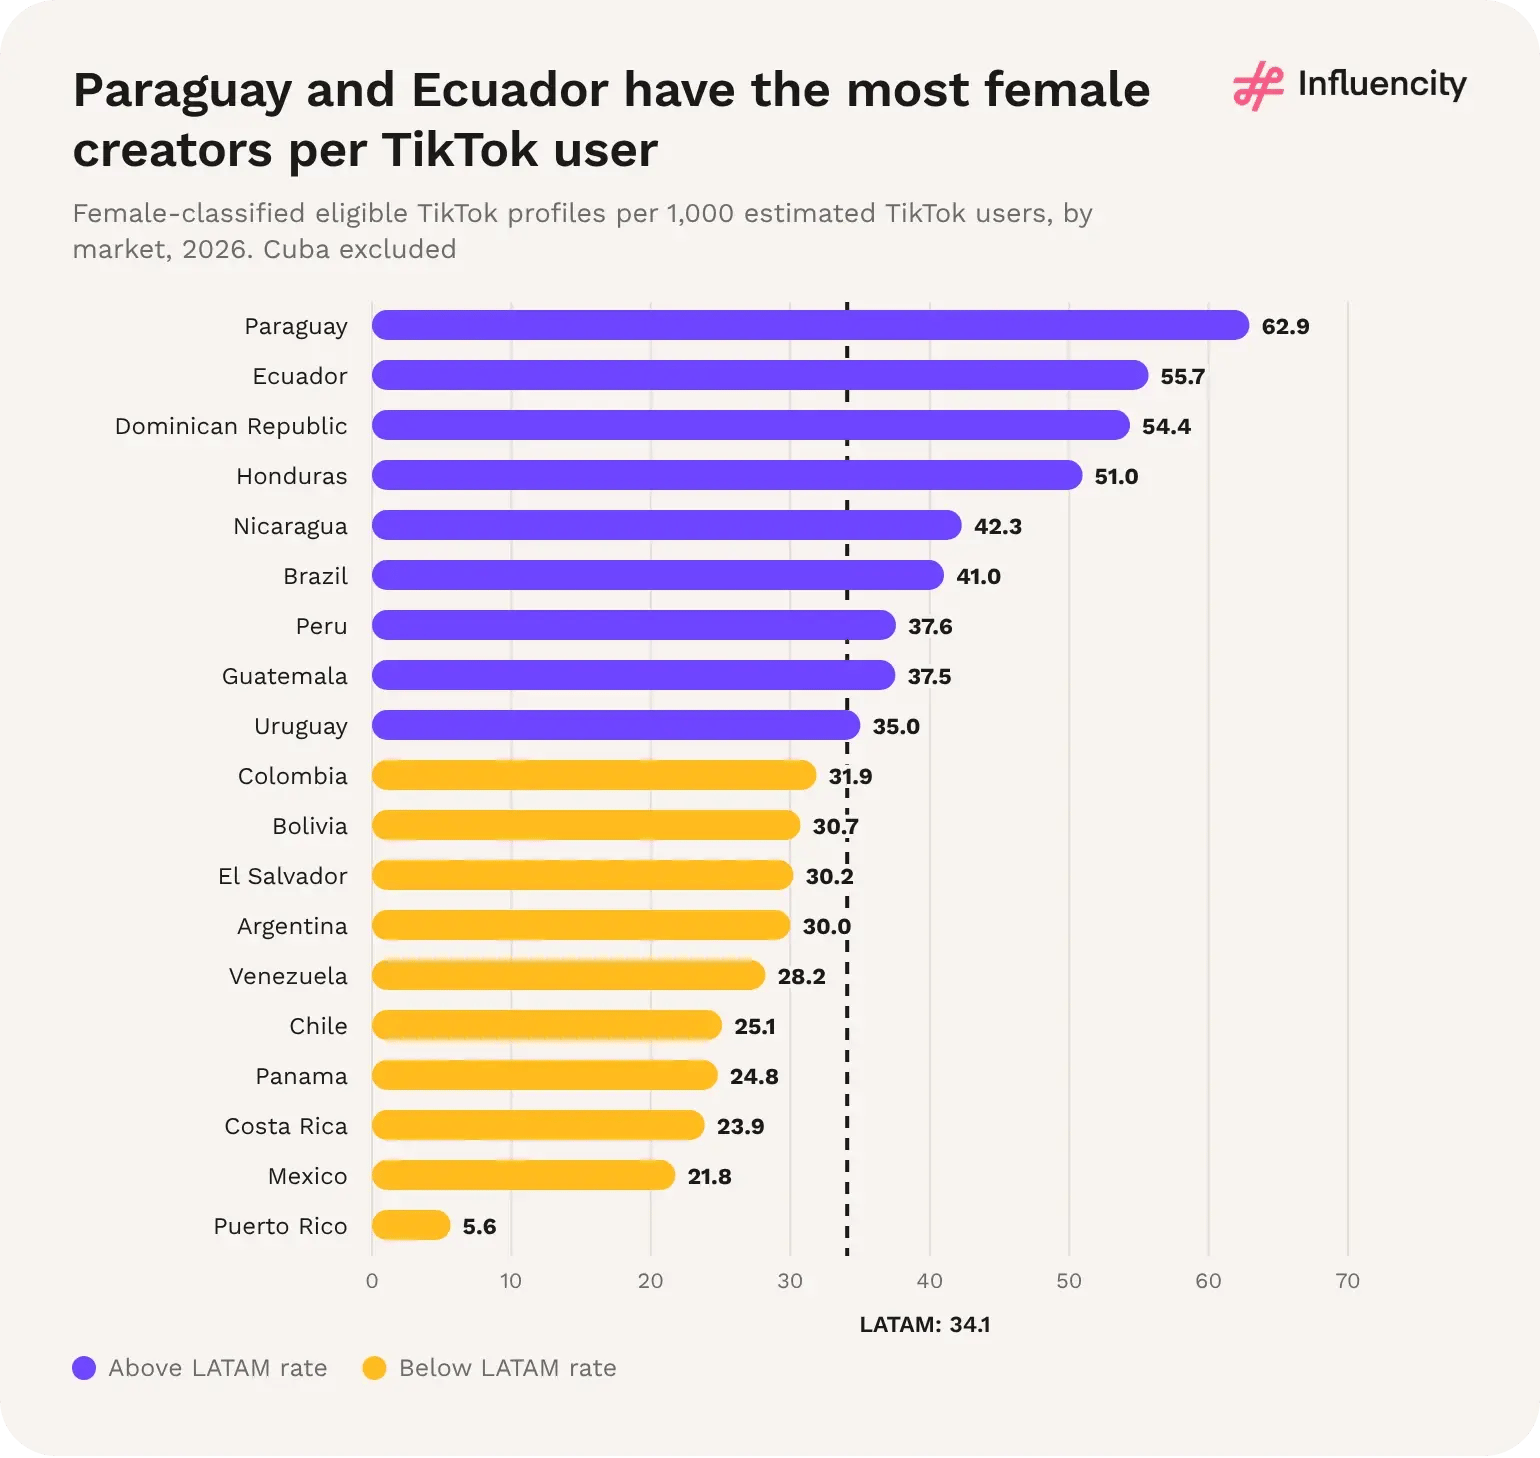
Figure 37 → Female-classified eligible TikTok profiles per 1,000 estimated TikTok users, by market, 2026. Cuba excluded. Source: [1].
Female majority: 65.9% of classified eligible LATAM TikTok profiles are female-classified (Influencity, 2026). [1]
Ratio: 1.93 female-classified profiles for every male-classified profile. [1]
Unclassified: 15.0% of eligible LATAM TikTok profiles have no gender classification, against 25.4% on Instagram. [1, 2]
Market range: 61.4% (Dominican Republic) to 75.4% (Puerto Rico) female among classified profiles. [1]
Platform gap: the female share of classified profiles is higher on TikTok than on Instagram in 18 of 19 markets. [1, 2]
Pool size: Brazil (5.37M) and Mexico (2.15M) hold 51.2% of LATAM's female-classified eligible TikTok profiles. [1]
1. The female majority is regional, not a few large markets. Every one of the 19 markets with reliable records has a female share above 61%, so the pattern does not depend on Brazil or Mexico. [1]
2. The majority sits in the smaller tiers. The female share falls from 66.6% in nano to 48.3% in mega (see Figure 34), so the overall split mostly describes nano and micro creators. [1]
3. Part of the platform gap is classification. TikTok both classifies more profiles and records a higher female share, so raw counts of female-classified profiles overstate the difference between platforms. [1, 2]
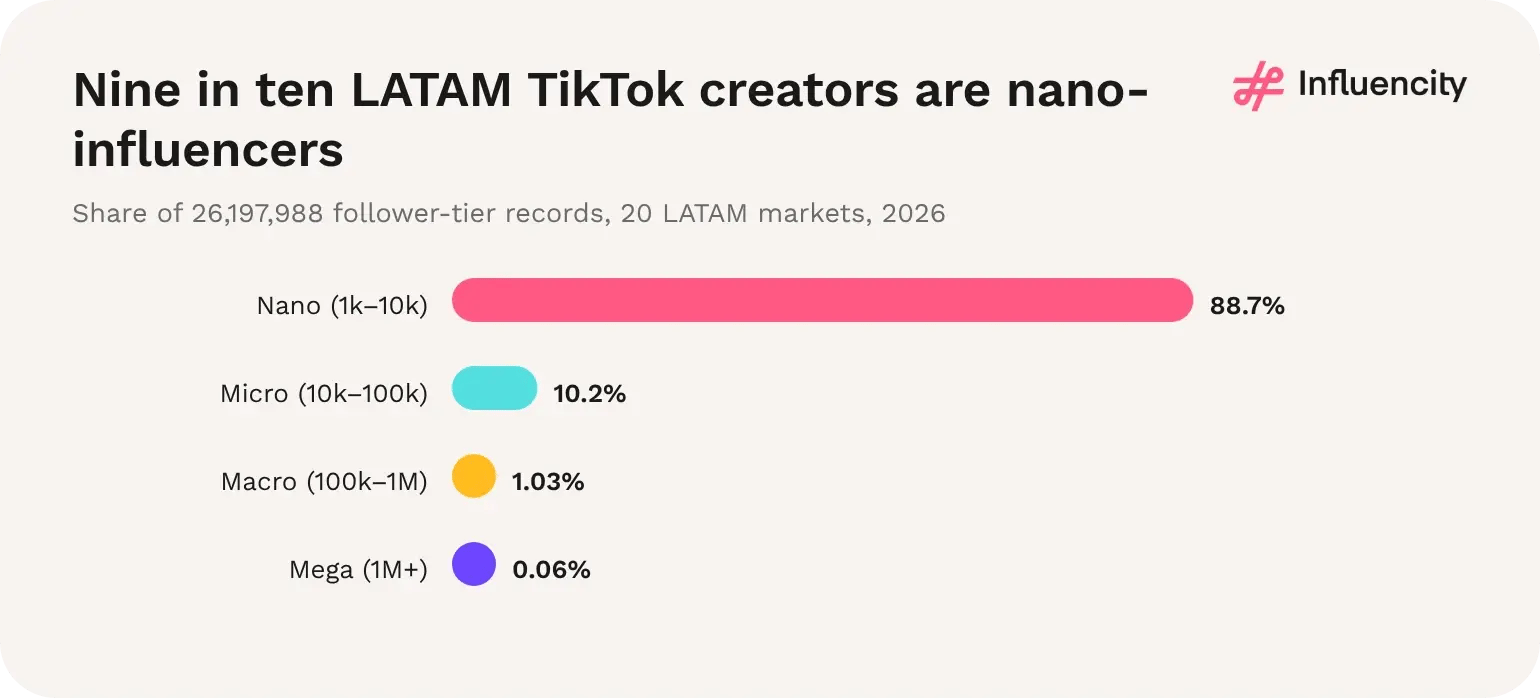
Figure 38 → Tier distribution: 26,197,988 tier records, not 26,226,153 headline profiles. Source: [1].
About 2.96M. Influencity's 2026 data, collected in October–November 2026, record 2,963,133 micro, macro and mega tier entries across 20 LATAM markets, 11.3% of 26,197,988 tier records. Of these, 268,673 are macro (100,000 to 1M followers) and 16,584 are mega (1M+). Tier records total 28,165 fewer than the headline count of eligible profiles because a small number of profiles are not assigned to a tier. [1]
Roughly tenfold at each step. There are 8.7 times as many nano as micro entries, 10.0 times as many micro as macro, and 16.2 times as many macro as mega. The drop is steepest at the top: for every mega creator there are 16 macro creators, 161 micro creators and 1,401 nano creators. [1]
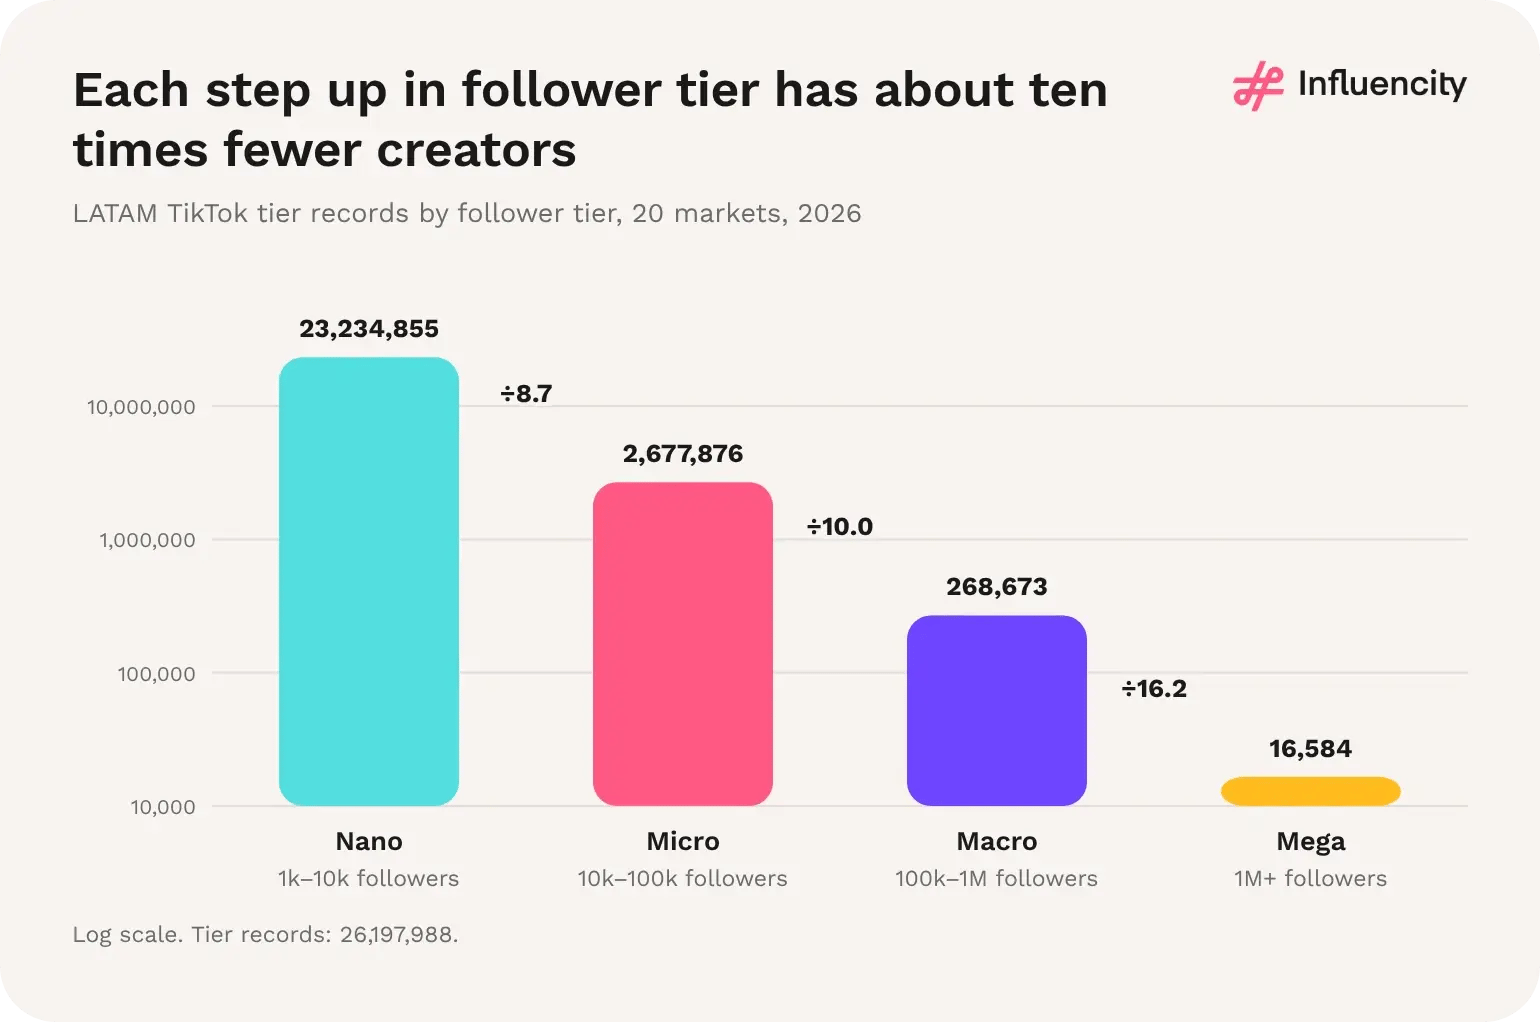
Figure 39 → LATAM TikTok tier records by follower tier, 20 markets, 2026, on a log scale. Labels between bars show the ratio between adjacent tiers. Source: [1].
Among large markets, Mexico has the highest share of tier records at 10,000+ followers (14.4%), against 11.3% for LATAM. Chile (12.0%), Bolivia (11.8%), Brazil (11.5%) and Argentina (11.4%) also sit above the regional share. Paraguay (7.3%), Nicaragua (7.5%) and Honduras (7.9%) have the lowest. Puerto Rico's 24.9% rests on fewer than 5,000 tier records. [1]
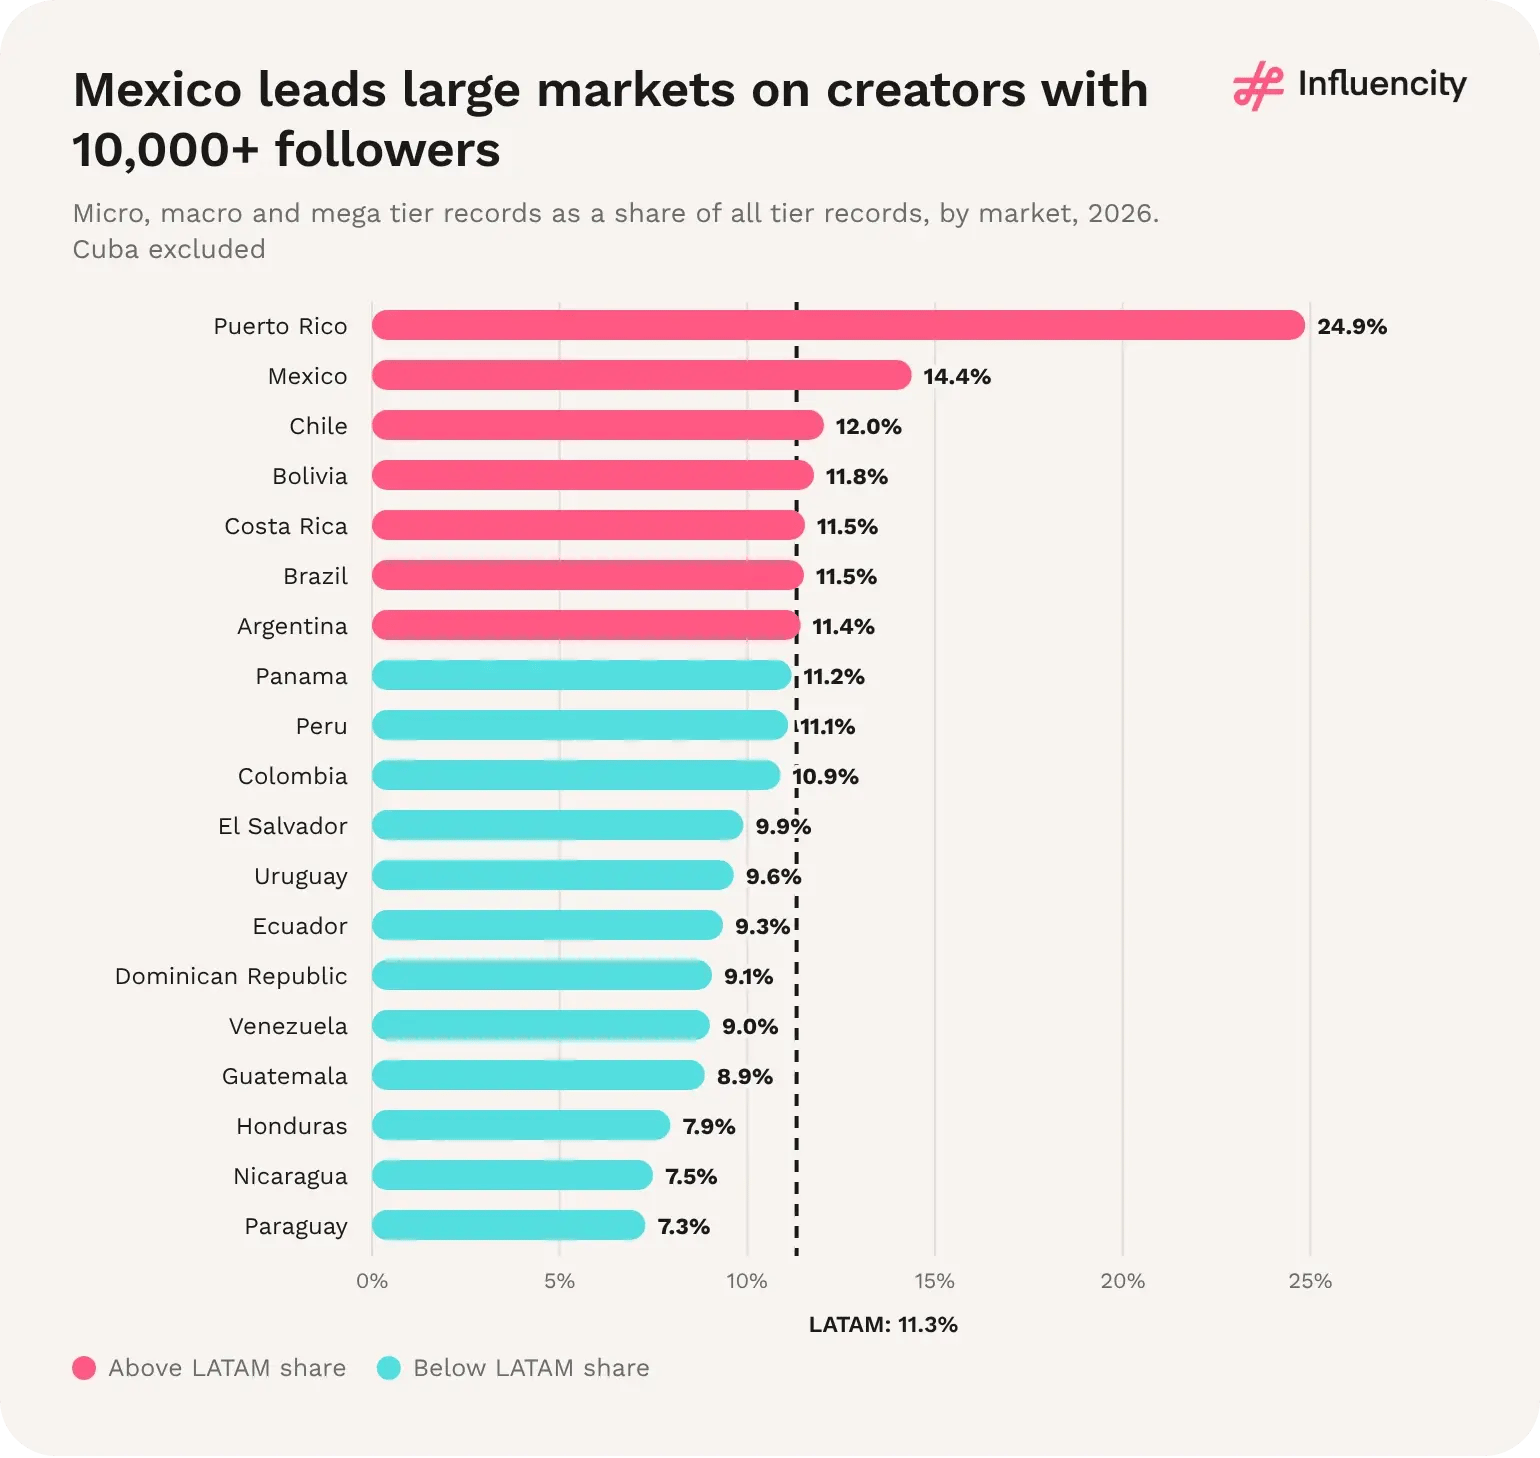
Figure 40 → Micro, macro and mega tier records as a share of all tier records, by market, 2026. Cuba excluded. Source: [1].
Brazil (7,085) and Mexico (3,831) hold 65.8% of LATAM's 16,584 mega-tier records, more than their combined 52.5% share of all tier records. Mexico's share rises from 14.5% of all records to 23.1% of mega records, and Colombia's from 7.5% to 9.6%. Peru, Ecuador and Chile are the reverse: each holds a smaller share of mega records than of all records. [1]
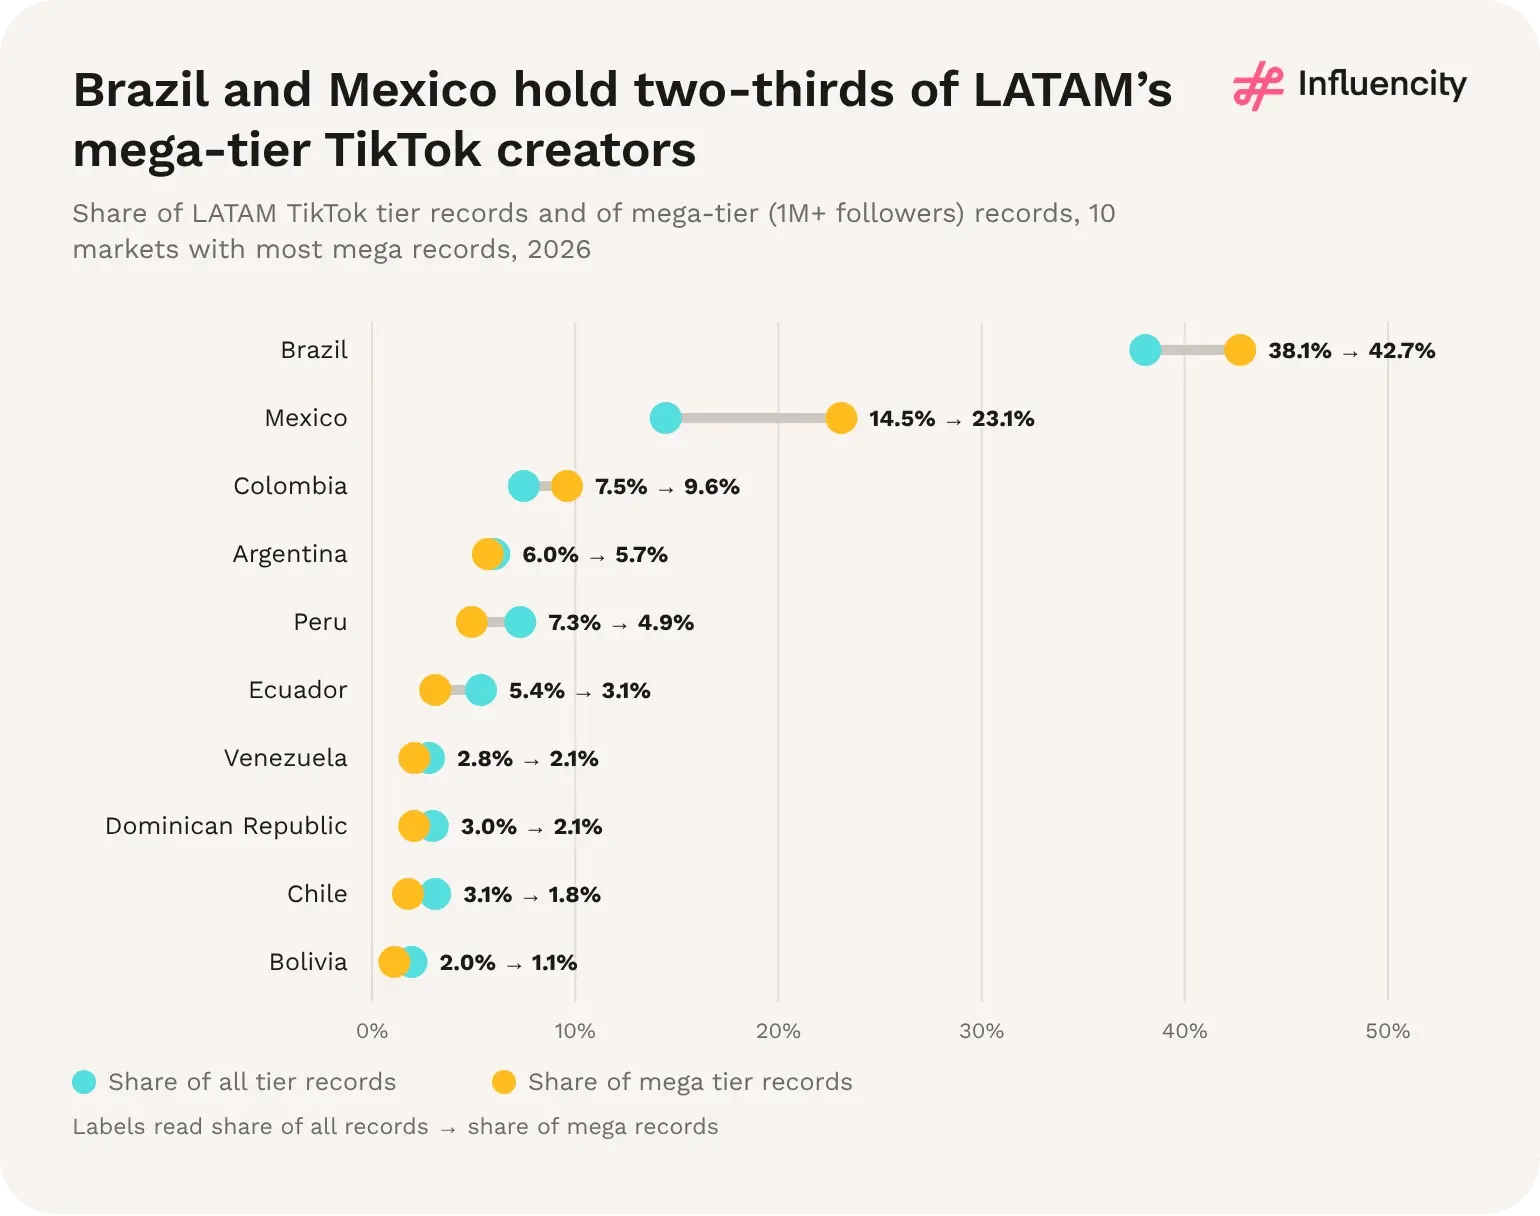
Figure 41 → Share of LATAM TikTok tier records and of mega-tier (1M+ followers) records, 10 markets with the most mega records, 2026. Source: [1].
Nano majority: 88.7% of LATAM TikTok tier records are nano (1,000 to 10,000 followers) (Influencity, 2026). [1]
10,000+ followers: 2,963,133 tier records, 11.3% of the total. [1]
Mega tier: 16,584 tier records with 1M+ followers, 0.06% of the total. [1]
Mega concentration: Brazil and Mexico hold 65.8% of mega-tier records. [1]
Market depth: Mexico has the highest 10,000+ share among large markets (14.4%). [1]
1. The top of the pyramid is thinner than the base suggests. The macro-to-mega step (16.2 times) is much steeper than the nano-to-micro step (8.7 times), so mega creators are scarce even in a pool of 26M. [1]
2. Large markets have deeper top tiers. Brazil and Mexico hold a larger share of mega records than of all records, while most smaller markets hold less. Scale and reach go together at the top. [1]
3. Small TikTok-first markets are nano-heavy. Paraguay, Nicaragua and Honduras have high creator density (section 05) but the lowest shares of 10,000+ creators, so their supply is broad rather than deep. [1]
The eight markets hold 19.5 million eligible TikTok profiles, 74.5% of the 20-market pool. Niche tags equal 1.02 per eligible profile across them, but coverage ranges from 0.31 tags per profile in Paraguay and 0.32 in Mexico to 1.37 in Brazil, so absolute counts partly reflect how fully each market's content is categorised. The comparisons below therefore use each market's niche mix and shares within each niche. [1]
Wellness, everywhere except Brazil. Wellness is the largest niche in seven of the eight markets, from 26.6% of Mexico's niche tags to 35.7% of Paraguay's. In Brazil, beauty (3,344,347 profiles) edges ahead of wellness (3,337,633), each about 24.4% of its niche tags. Travel is the second-largest niche in six markets, led by Argentina (23.1%), and tech and gaming is the smallest or second-smallest niche in all eight. [1]
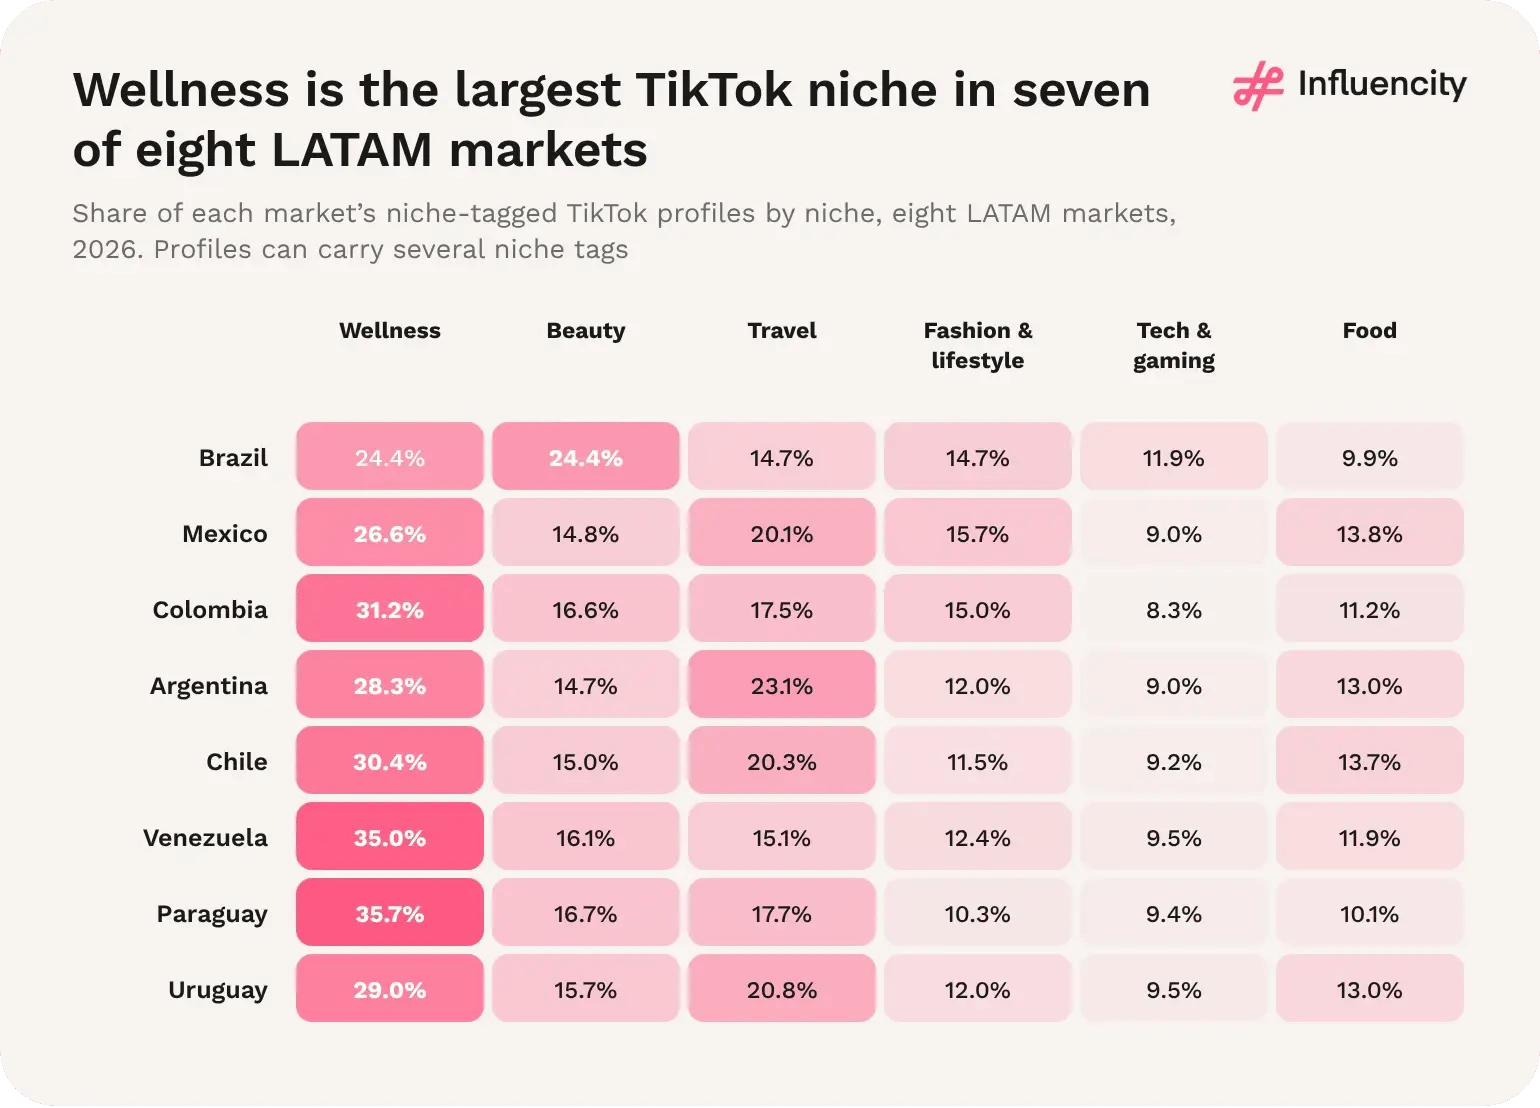
Figure 42 → Share of each market’s niche-tagged TikTok profiles by niche, eight LATAM markets, 2026. Profiles can carry several niche tags. Source: [1].
Every niche has a female majority overall, but by very different margins. Among male- and female-classified niche-tagged profiles, beauty is 74.1% female across the eight markets, from 67.3% in Mexico and Colombia to 77.5% in Paraguay. Tech and gaming is closest to parity at 52.2%, and it is the only niche with a male majority in any market: Mexico (47.7% female) and Colombia (48.2%). [1]
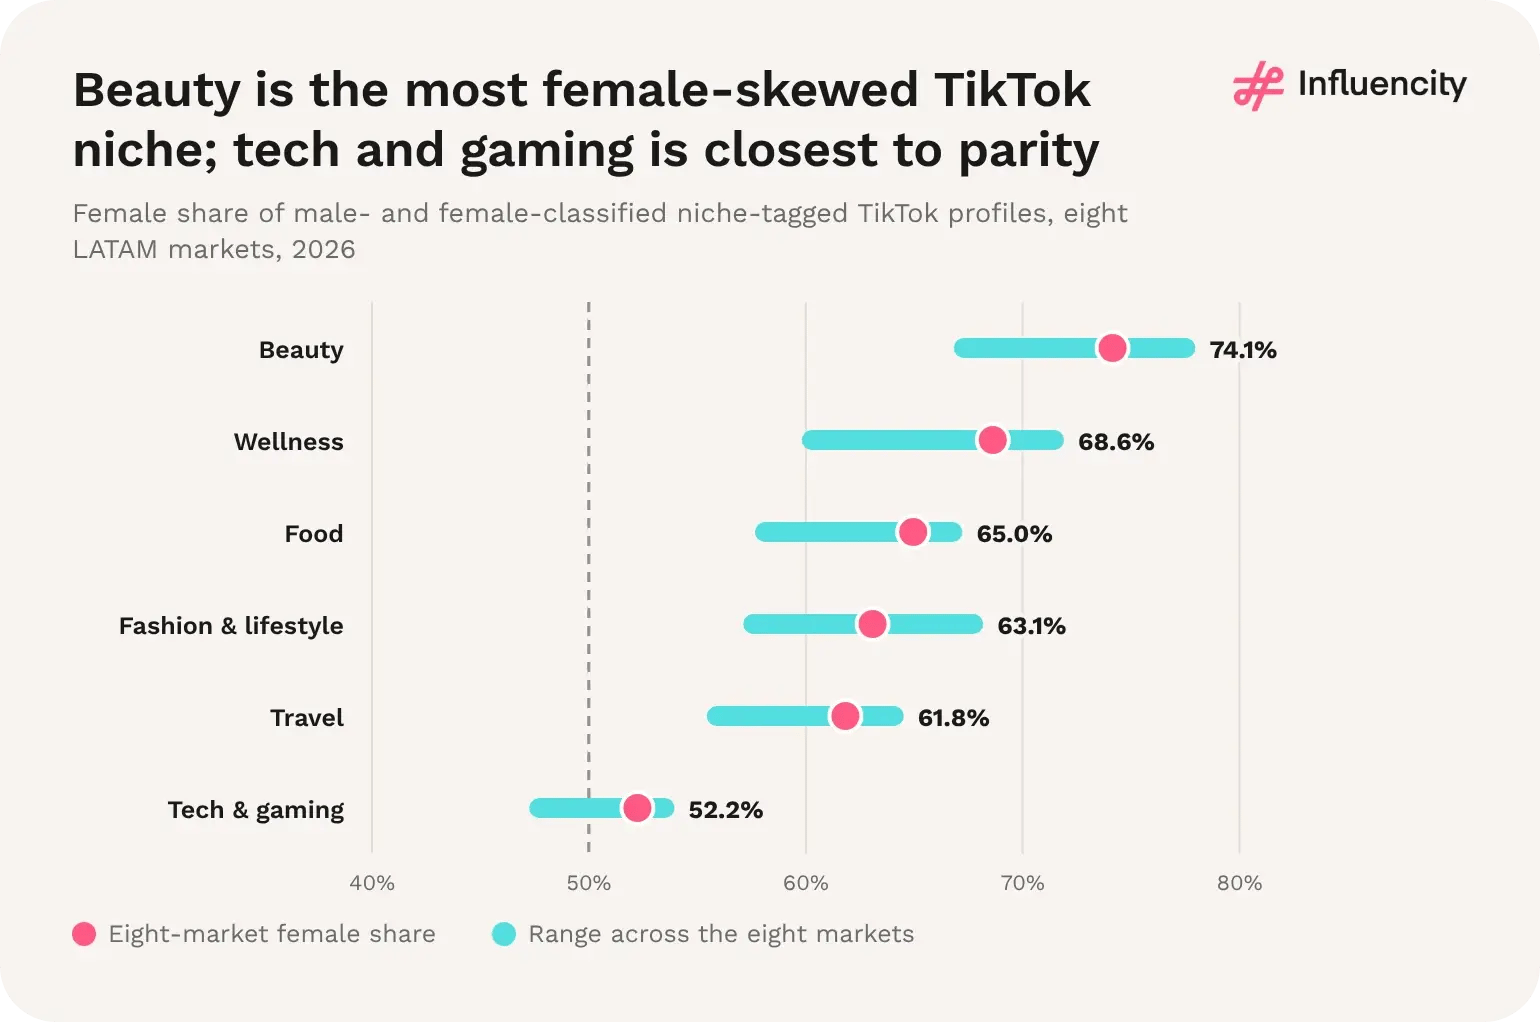
Figure 43 → Female share of male- and female-classified niche-tagged TikTok profiles, eight-market figure and range across markets, 2026. Classification labels, not self-identified gender. Source: [1].
Tech and gaming, and fashion and lifestyle. In the eight markets, 24.6% of tech and gaming tier records and 23.4% of fashion and lifestyle records have 10,000 or more followers, against 17.6% for beauty. Every niche is above the 11.8% share for all eligible profiles in the same markets, so niche-tagged creators skew towards larger accounts. By market, the highest shares are in Paraguay (32.0% for tech and gaming, 31.8% for fashion and lifestyle) and Colombia, and the lowest in Brazil and Argentina. [1]
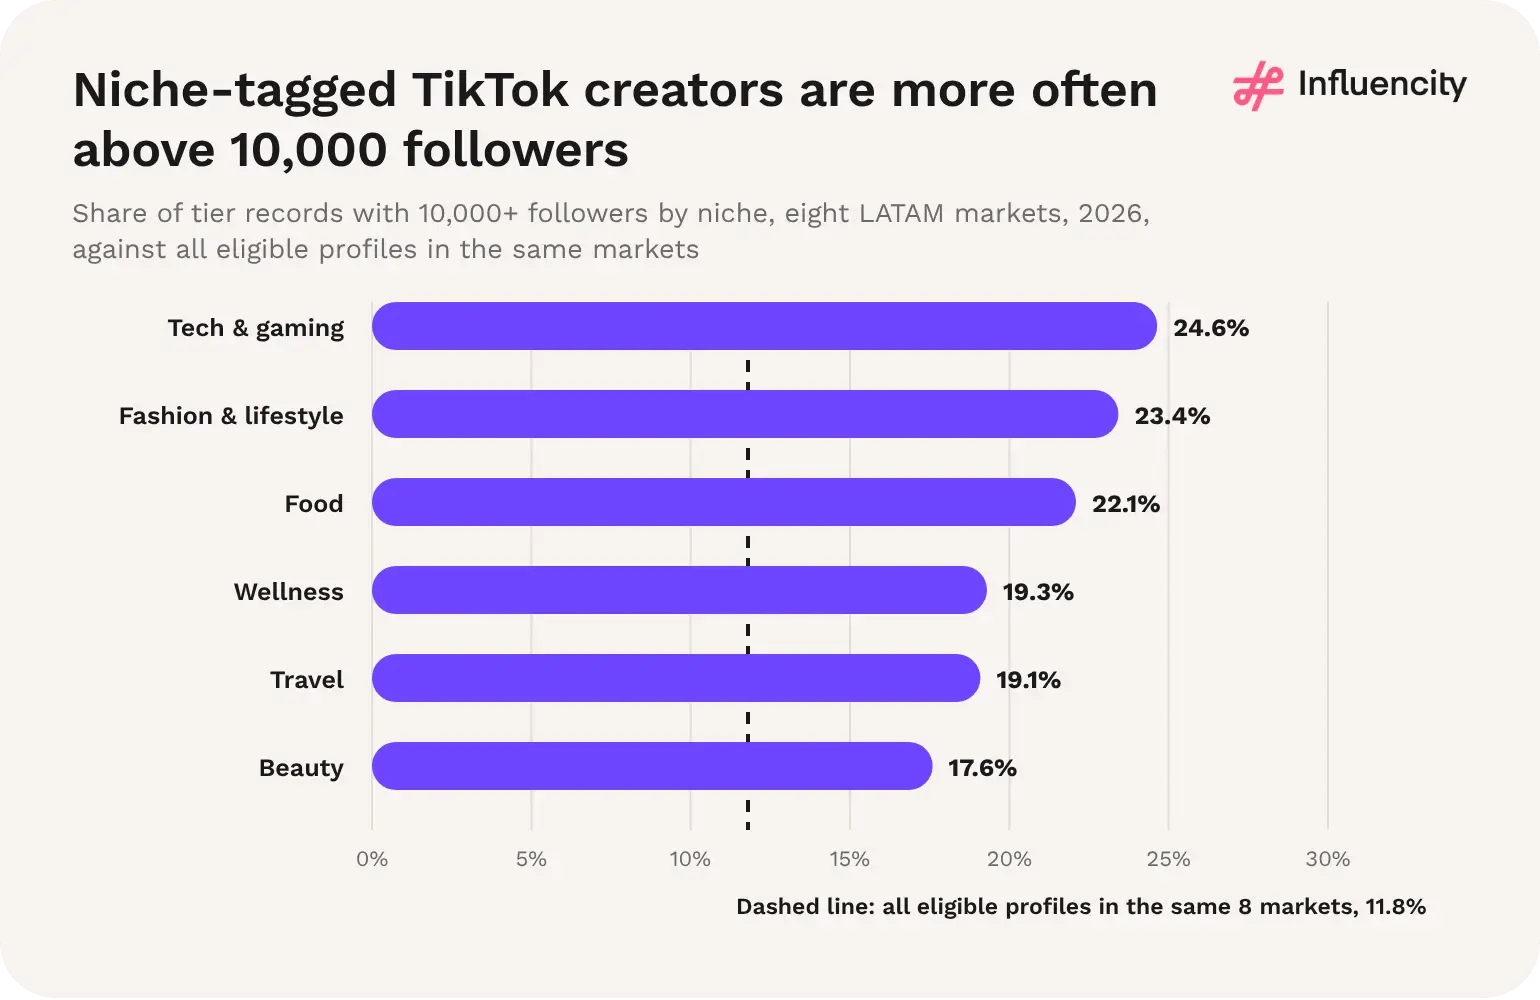
Figure 44 → Share of niche-tagged tier records with 10,000+ followers by niche, eight LATAM markets, 2026, against all eligible profiles in the same markets. Source: [1].
Largest niches: 5,190,149 wellness-tagged and 4,300,047 beauty-tagged TikTok profiles across eight LATAM markets (Influencity, October–November 2026). [1]
Gender: beauty is 74.1% female among classified niche-tagged profiles; tech and gaming is 52.2%. [1]
Larger accounts: 24.6% of tech and gaming tier records have 10,000+ followers, against 11.8% for all eligible profiles in the same markets. [1]
1. Brazil dominates the counts more than the pool. Brazil holds 51.1% of eligible profiles in the eight markets but 77.8% of beauty-tagged and 74.5% of tech and gaming-tagged profiles, partly because its profiles carry more niche tags (1.37 per profile). [1]
2. Wellness is the regional default; travel is the usual runner-up. Wellness leads in seven markets, and travel takes more than 20% of niche tags in Argentina, Uruguay, Chile and Mexico. [1]
3. Niche-tagged creators are larger than the average profile. Every niche has a 10,000+ share between 17.6% and 24.6%, against 11.8% overall. One hypothesis is that larger, more active accounts are easier to categorise; the data cannot test this.
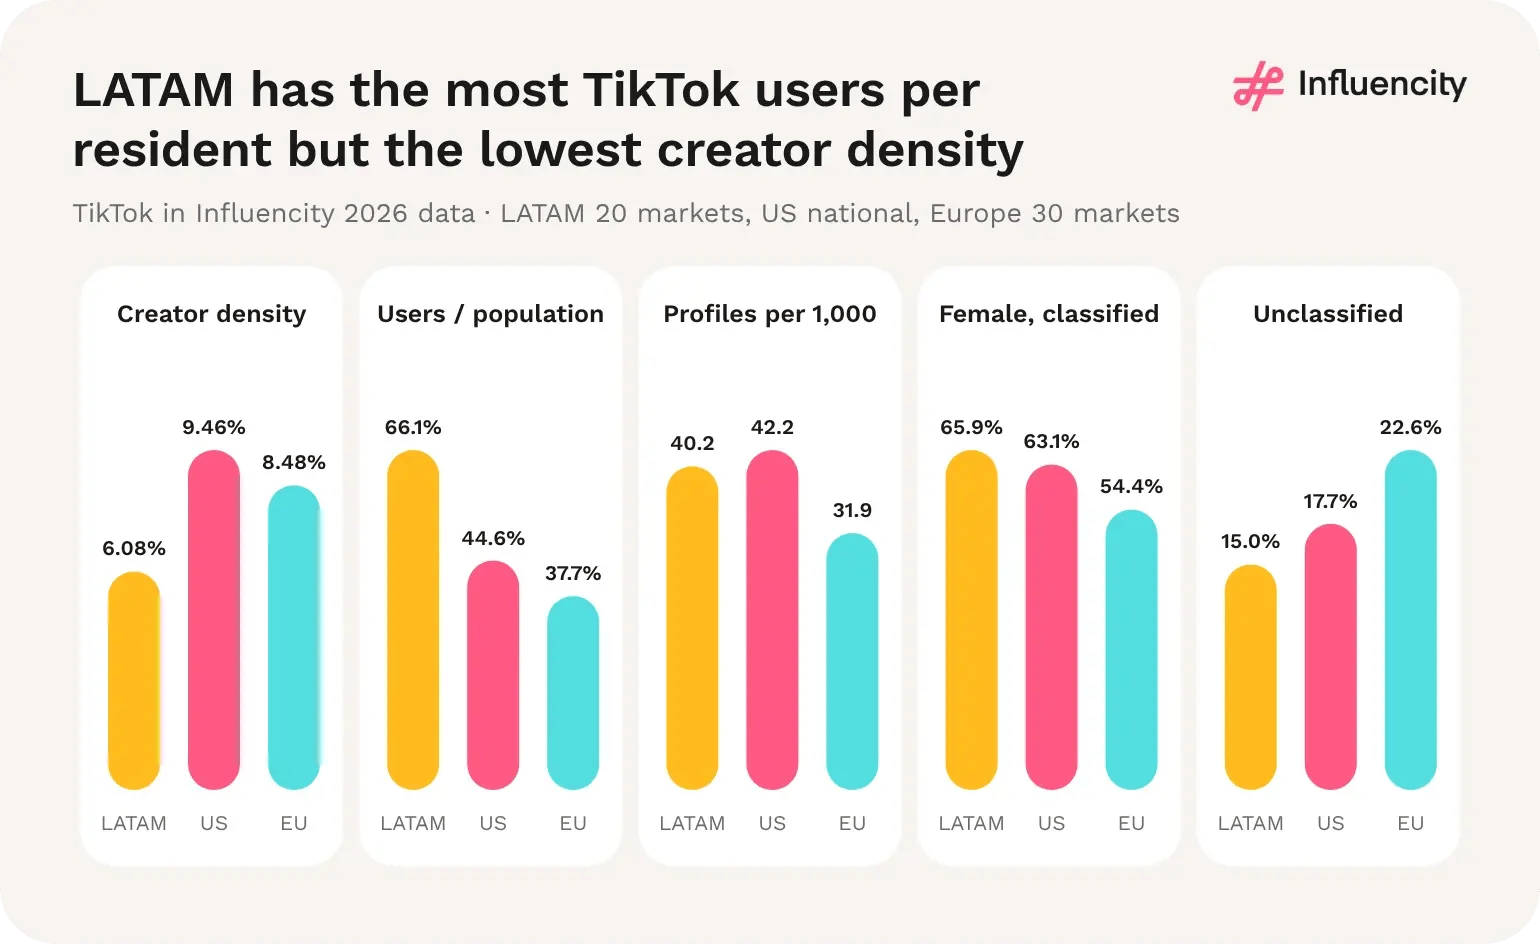
Figure 45 → Five comparable TikTok ratios for the three regions. Sources: [1, 4, 5].
Per resident, LATAM's TikTok creator supply (40.2 per 1,000) is close to the US (42.2) and above Europe (31.9). Its lower density comes entirely from the much larger estimated audience. In practice, this means a LATAM TikTok creator is competing for attention in a larger estimated audience than a US or European one; whether that helps or hurts reach is not measured here. [1, 4, 5]
In the US and Europe, TikTok has fewer users than Instagram and about twice the creator density. In LATAM, TikTok has more users and only 1.07 times the density, or 1.58 times excluding Brazil; in Europe, excluding Russia raises the ratio to 2.33. Of all the cross-region results in Influencity's 2026 data, this is the clearest sign that platform benchmarks from one region should not be applied to another. [1, 2, 4–7]
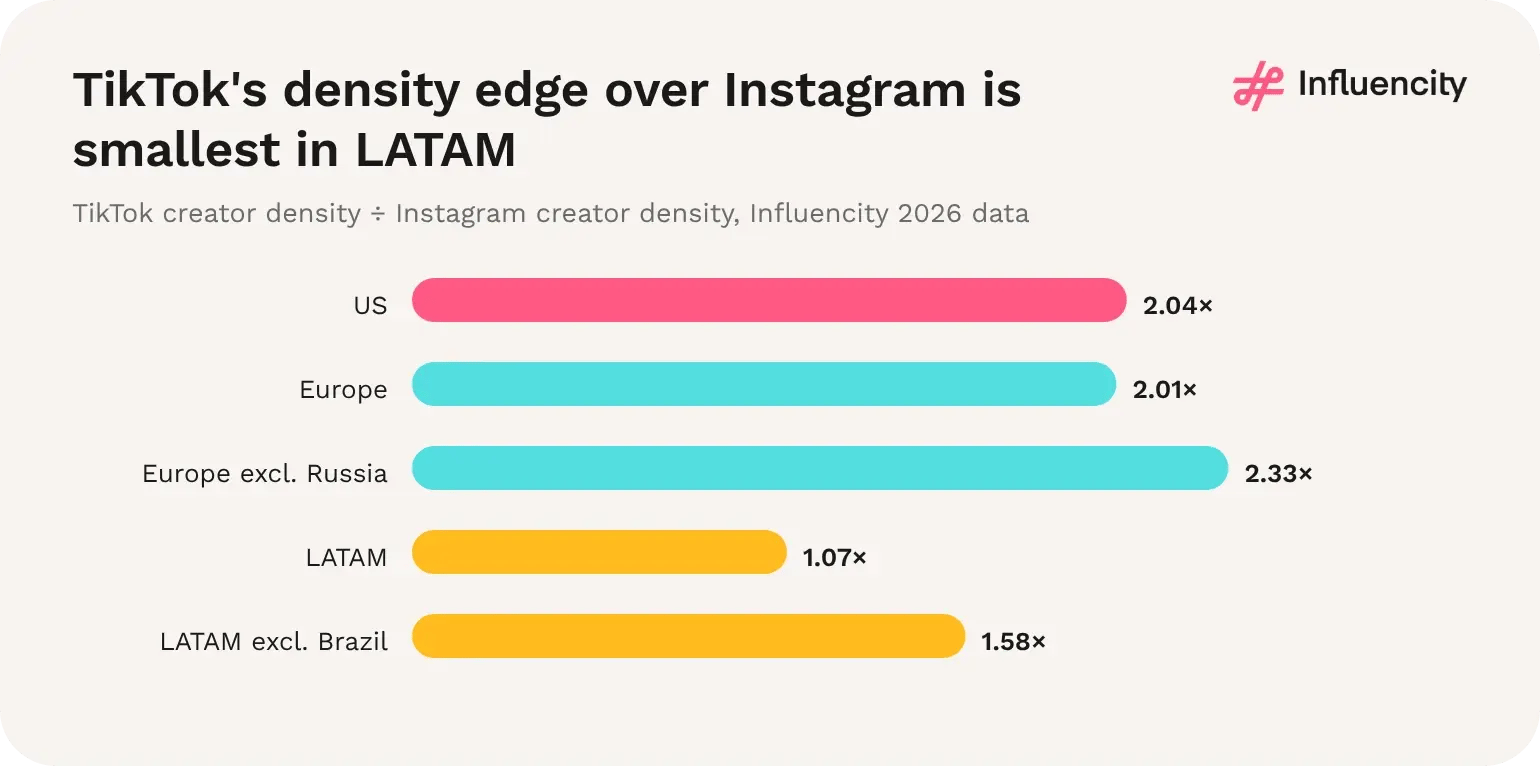
Figure 46 → TikTok density divided by Instagram density in each region, 2026 datasets. Sources: [1, 2, 4–7].
LATAM TikTok has the highest female share and lowest unclassified share of the three TikTok datasets, and a nano share between the US and Europe. All three have male majorities among classified mega entries, from 51.7% in LATAM to 55.9% in Europe. Larger accounts are scarcer relative to audience in LATAM: 11.3% of tier records have 10,000+ followers (US 14.0%, Europe 10.0%), and there are 621 micro, 62 macro and 3.8 mega profiles per 100,000 estimated users, against 1,179, 135 and 11.7 in the US and 761, 80 and 5.3 in Europe. [1, 4, 5]
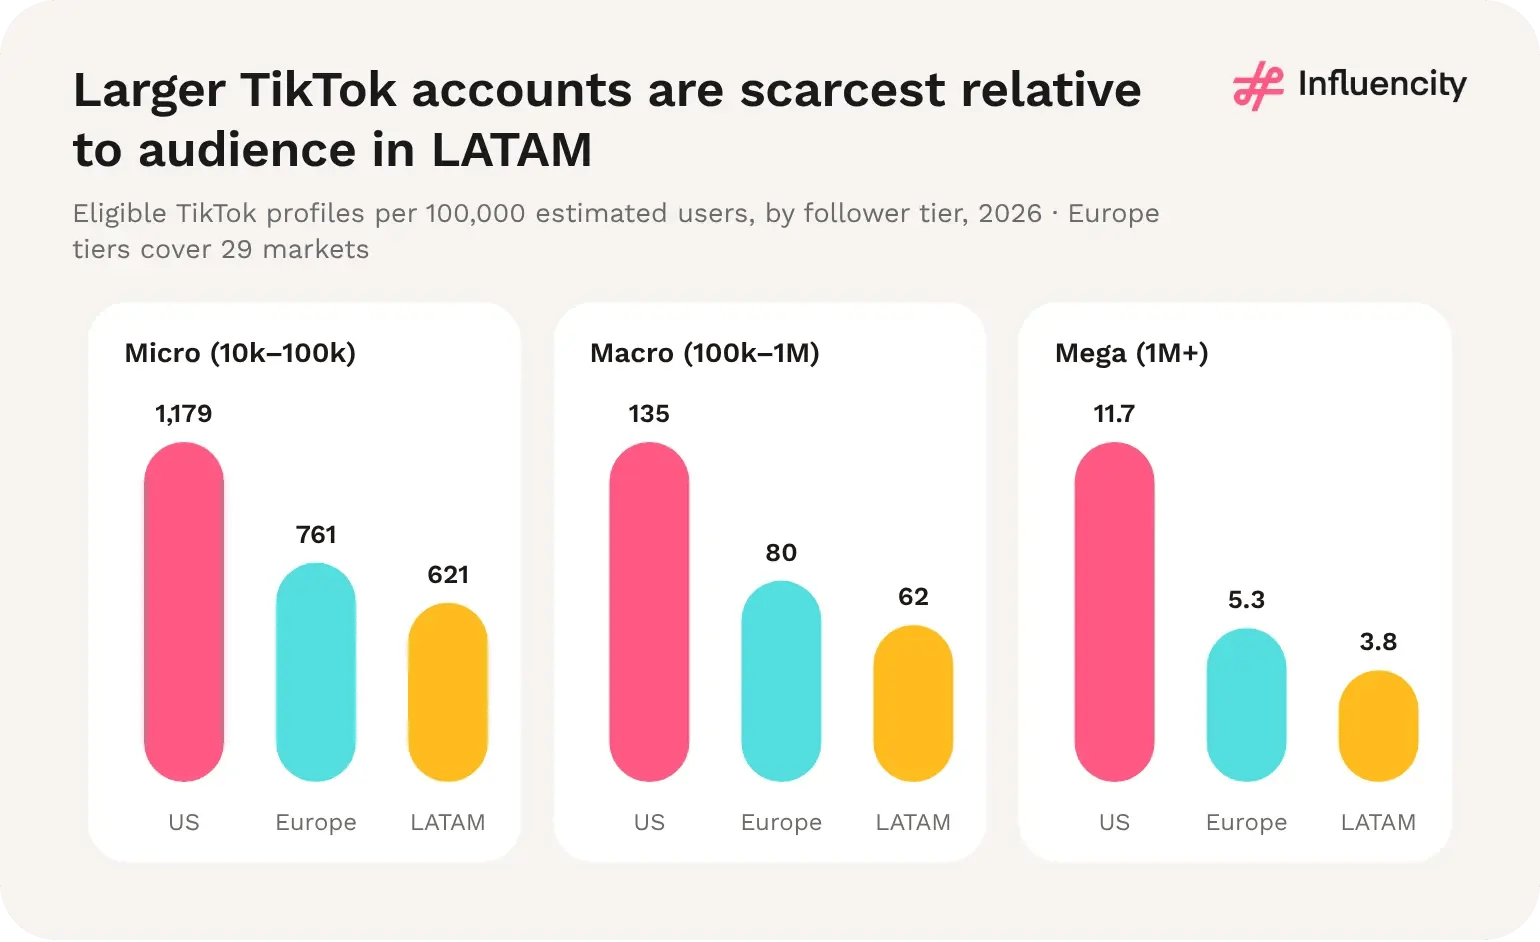
Figure 47 → Eligible TikTok profiles per 100,000 estimated users by follower tier; Europe tiers cover 29 markets. Sources: [1, 4, 5].
Yes, on both audience and creator supply. Influencity's 2026 data record 431.0M estimated TikTok users and 26.23M eligible TikTok profiles across 20 LATAM markets, against 153.0M and 14.47M in the US and 252.3M and 21.40M across 30 European markets. LATAM is also the only one of the three regions where TikTok has more estimated users than Instagram. [1, 2, 4–7]
On creators everywhere, on audience only in LATAM. TikTok records 42.4% more eligible profiles than Instagram in LATAM, 61.8% more in the US and 72.5% more in Europe. On estimated users, TikTok is 33.2% larger than Instagram in LATAM but 20.6% smaller in the US and 14.3% smaller in Europe. [1, 2, 4–7]
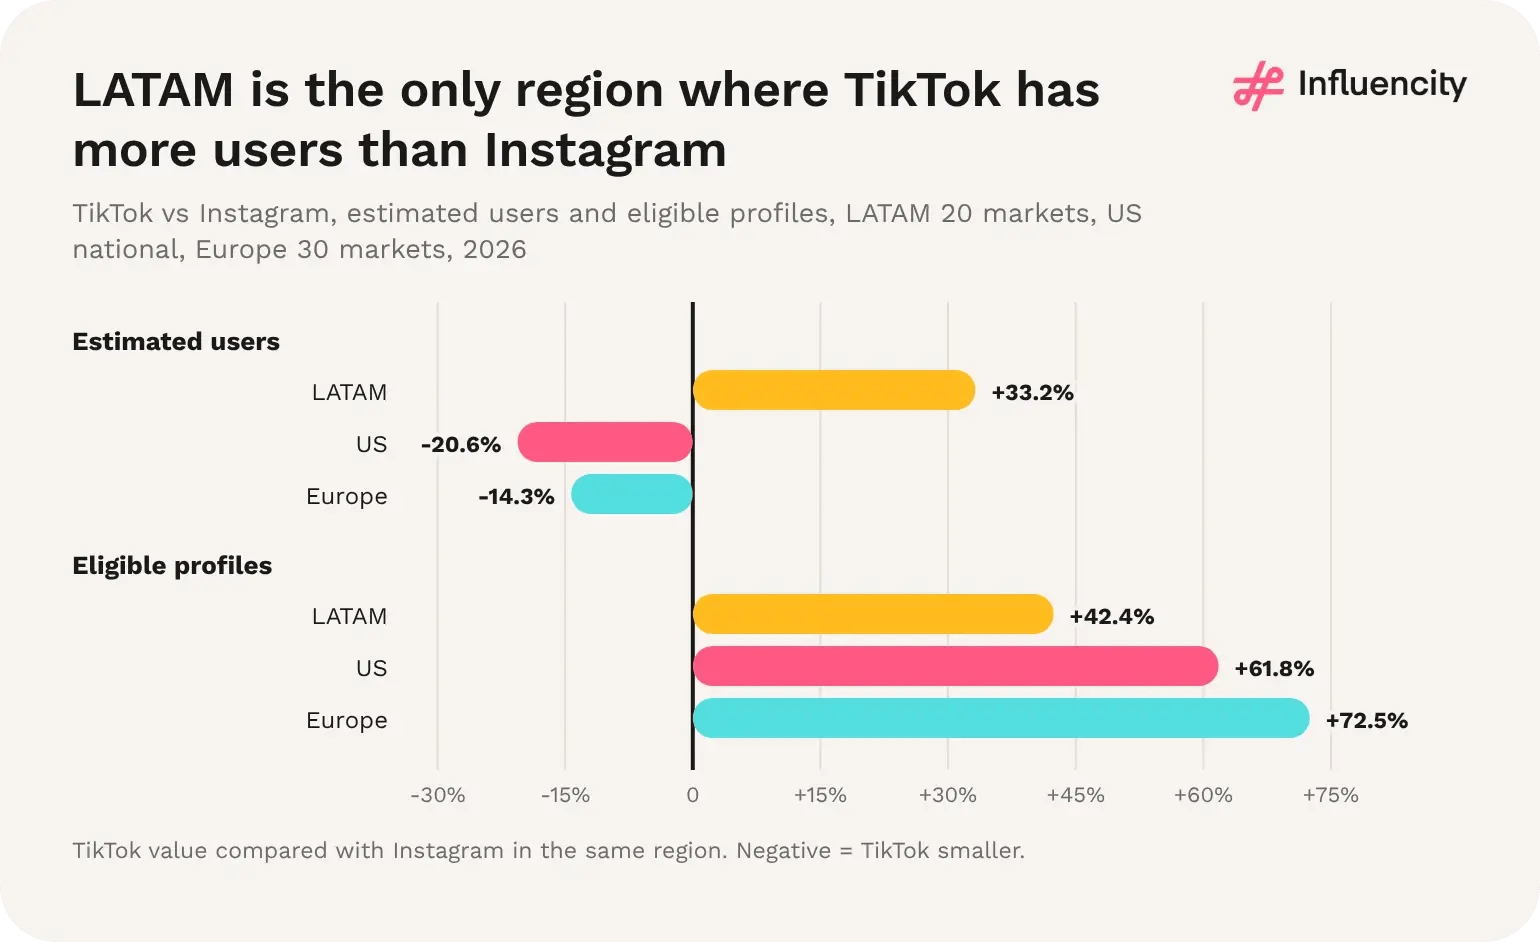
Figure 48 → TikTok compared with Instagram in the same region, estimated users and eligible profiles, LATAM 20 markets, US national, Europe 30 markets, 2026. Sources: [1, 2, 4–7].
In opposite directions. Excluding Brazil lowers LATAM's TikTok density from 6.08% to 5.41%, because Brazil is denser than the rest of the region. Excluding Russia raises Europe's from 8.48% to 9.63%. LATAM's market densities also span a lower range, from 0.86% to 11.14% (Cuba excluded), against 5.28% to 18.11% in Europe. [1, 5]
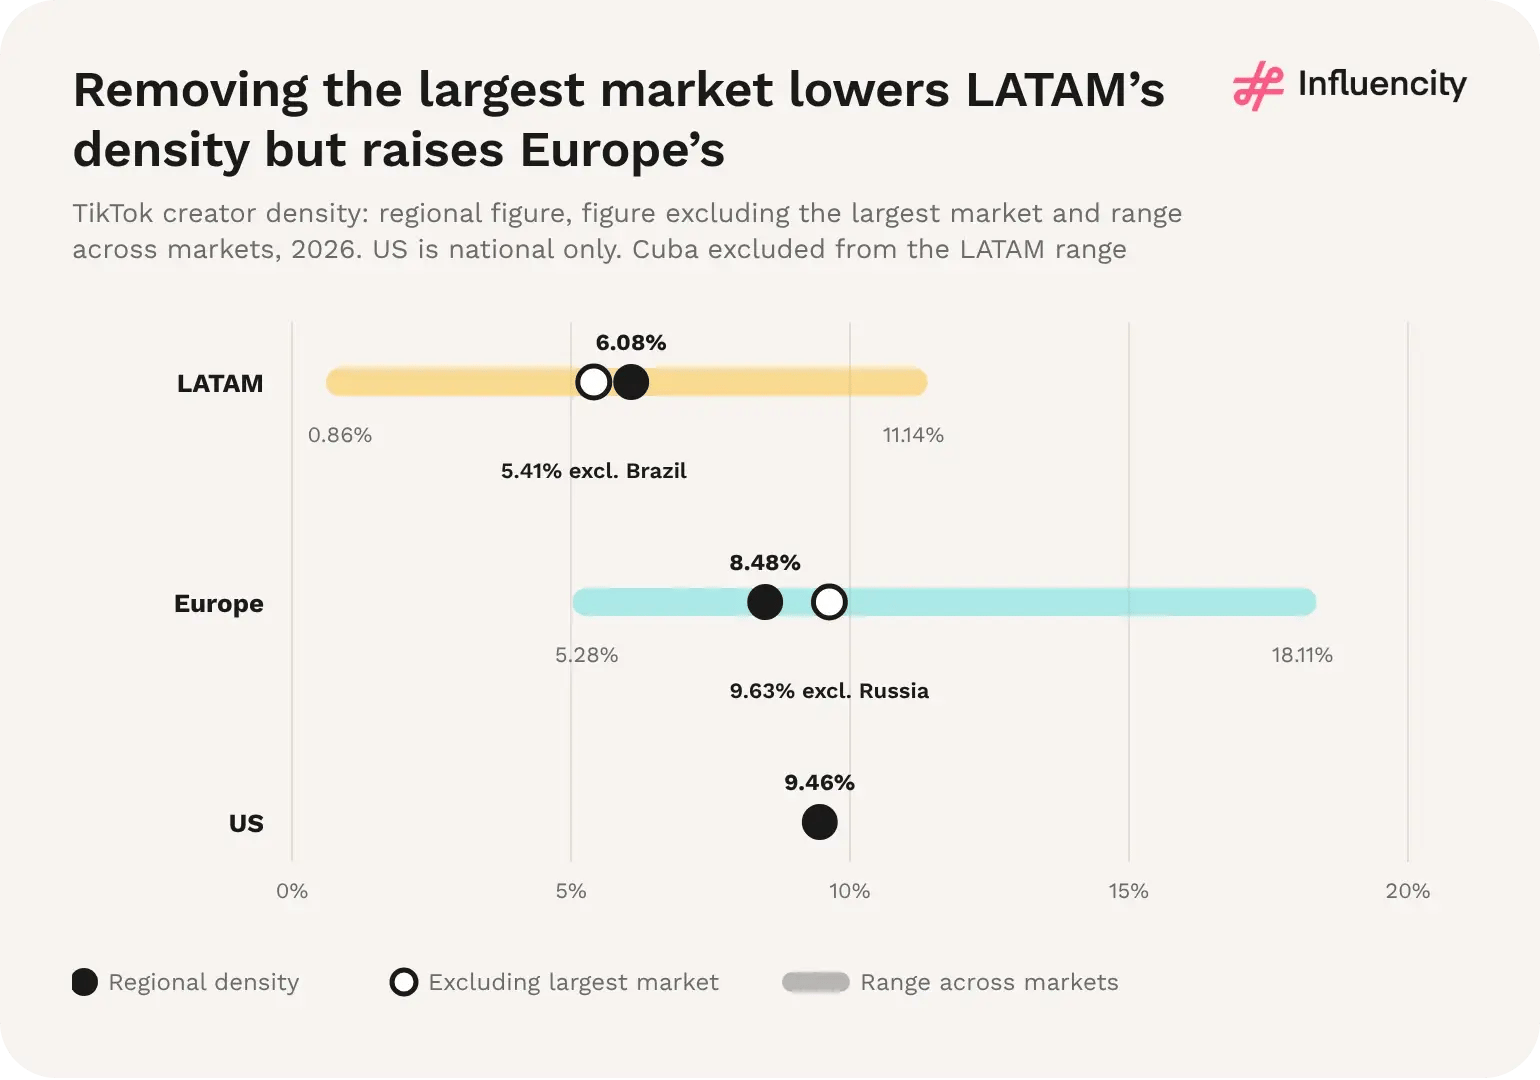
Figure 49 → TikTok creator density: regional figure, figure excluding the largest market and range across markets, 2026. The US dataset is national only. Cuba excluded from the LATAM range. Sources: [1, 4, 5].
Yes, and it reverses at the top in all three. The female share of classified profiles is 65.9% in LATAM, 63.1% in the US and 54.4% in Europe. Among classified mega-tier entries it falls to 48.3%, 47.6% and 44.1%. LATAM has both the largest female majority overall and the largest drop at mega level, 17.6 percentage points. [1, 4, 5]
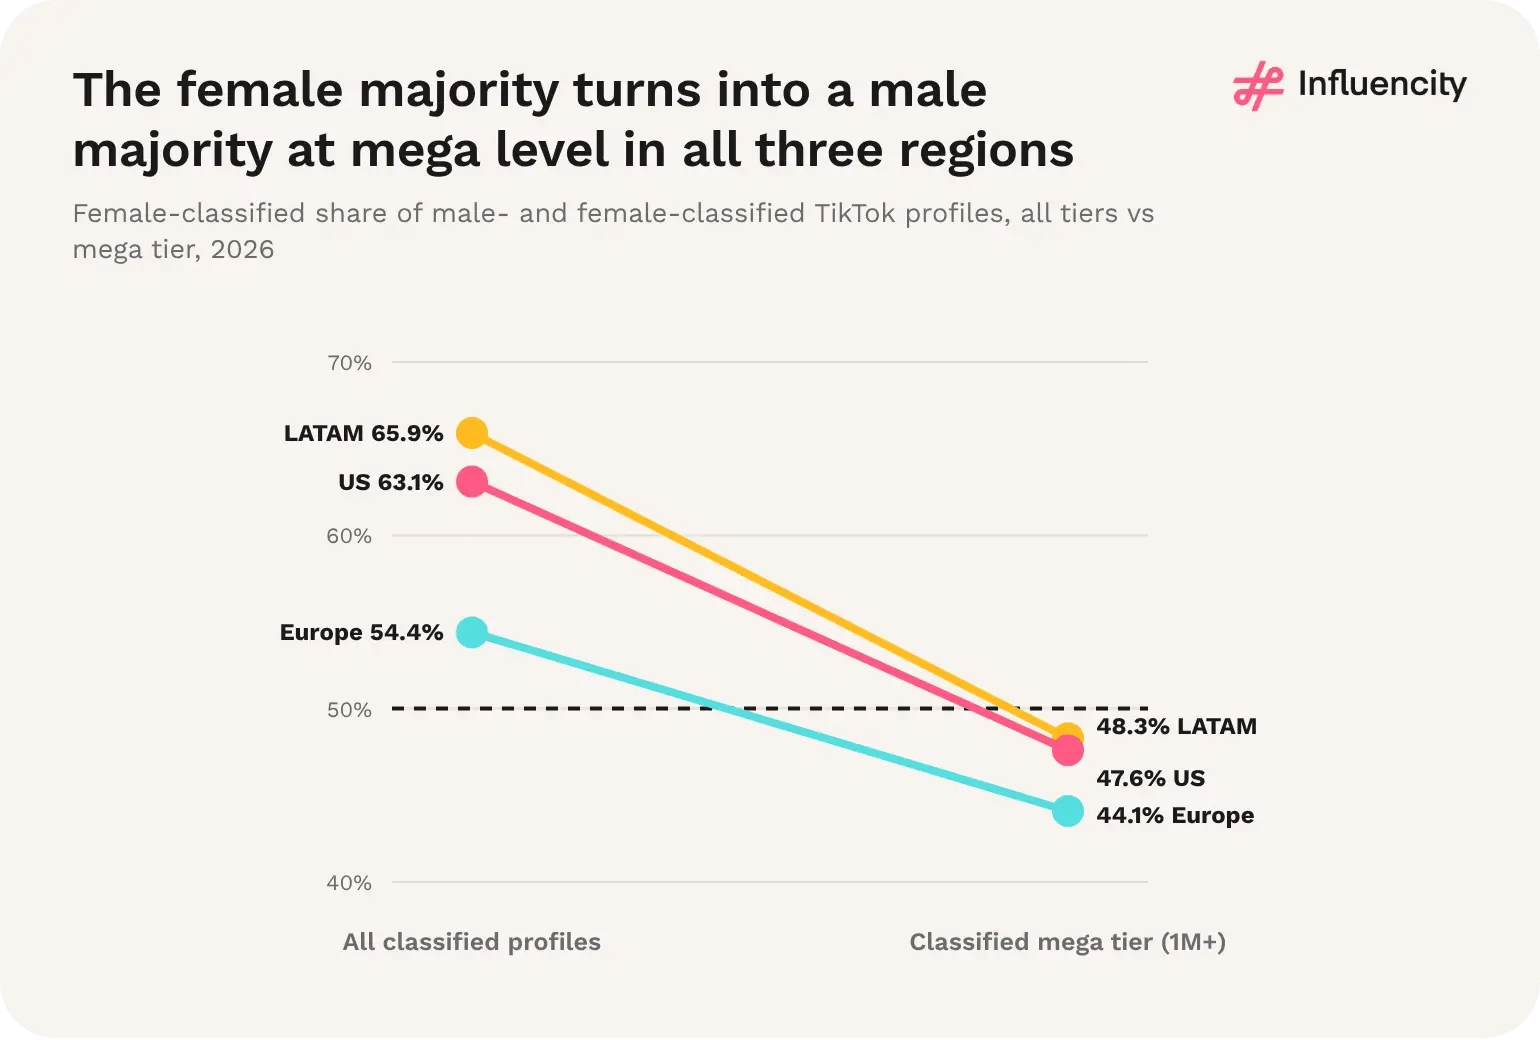
Figure 50 → Female-classified share of male- and female-classified TikTok profiles, all tiers vs mega tier (1M+ followers), LATAM, US and Europe, 2026. Sources: [1, 4, 5].
Audience: LATAM has 431.0M estimated TikTok users, 2.8 times the US figure (Influencity, 2026). [1, 4]
Creator supply: 26.23M eligible TikTok profiles in LATAM, against 21.40M in Europe and 14.47M in the US. [1, 4, 5]
Platform audience: TikTok has 33.2% more estimated users than Instagram in LATAM, but fewer in the US (−20.6%) and Europe (−14.3%). [1, 2, 4–7]
Density: 6.08% in LATAM, 9.46% in the US and 8.48% in Europe. [1, 4, 5]
Gender: LATAM has the highest female share of classified TikTok profiles (65.9%) of the three regions. [1, 4, 5]
1. LATAM is TikTok's audience-led region. In the US and Europe, TikTok's advantage is in creators; in LATAM it is in both creators and users, which is why density looks low. [1, 2, 4–7]
2. Regional averages hide different structures. Brazil pulls LATAM's density up and Russia pulls Europe's down, so a single regional figure can point in the wrong direction for most markets. [1, 5]
3. The top-tier gender gap is universal. Every region has a female majority overall and a male majority among classified mega creators, so it is a platform-wide pattern rather than a LATAM feature. [1, 4, 5]
The supplements study describes engagement in Mexico as TikTok-led and emphasising "energy", "family" and community wellness, often drawing on "natural" and "ancestral" remedy themes; one-size-fits-all messaging underperformed, and Spanish-language comments were more positive towards "energy, family, vitality" narratives. The 2026 dataset is consistent: Mexico's TikTok creator pool is 3.66 times its Instagram pool. [1, 2, 8]
In the pooled US and Mexico sample, TikTok had the lowest share of positive comments (58%), explicit #ad or #sponsored disclosure (66%), properly placed disclosure (58%) and posts avoiding disease claims (81%), and a trust index of 23 out of 100 against 69 for Instagram. Micro-creators outperformed "particularly on TikTok", and disclosed posts performed 12% better on long-term engagement. These pooled figures are not reported separately for Mexico. [8]
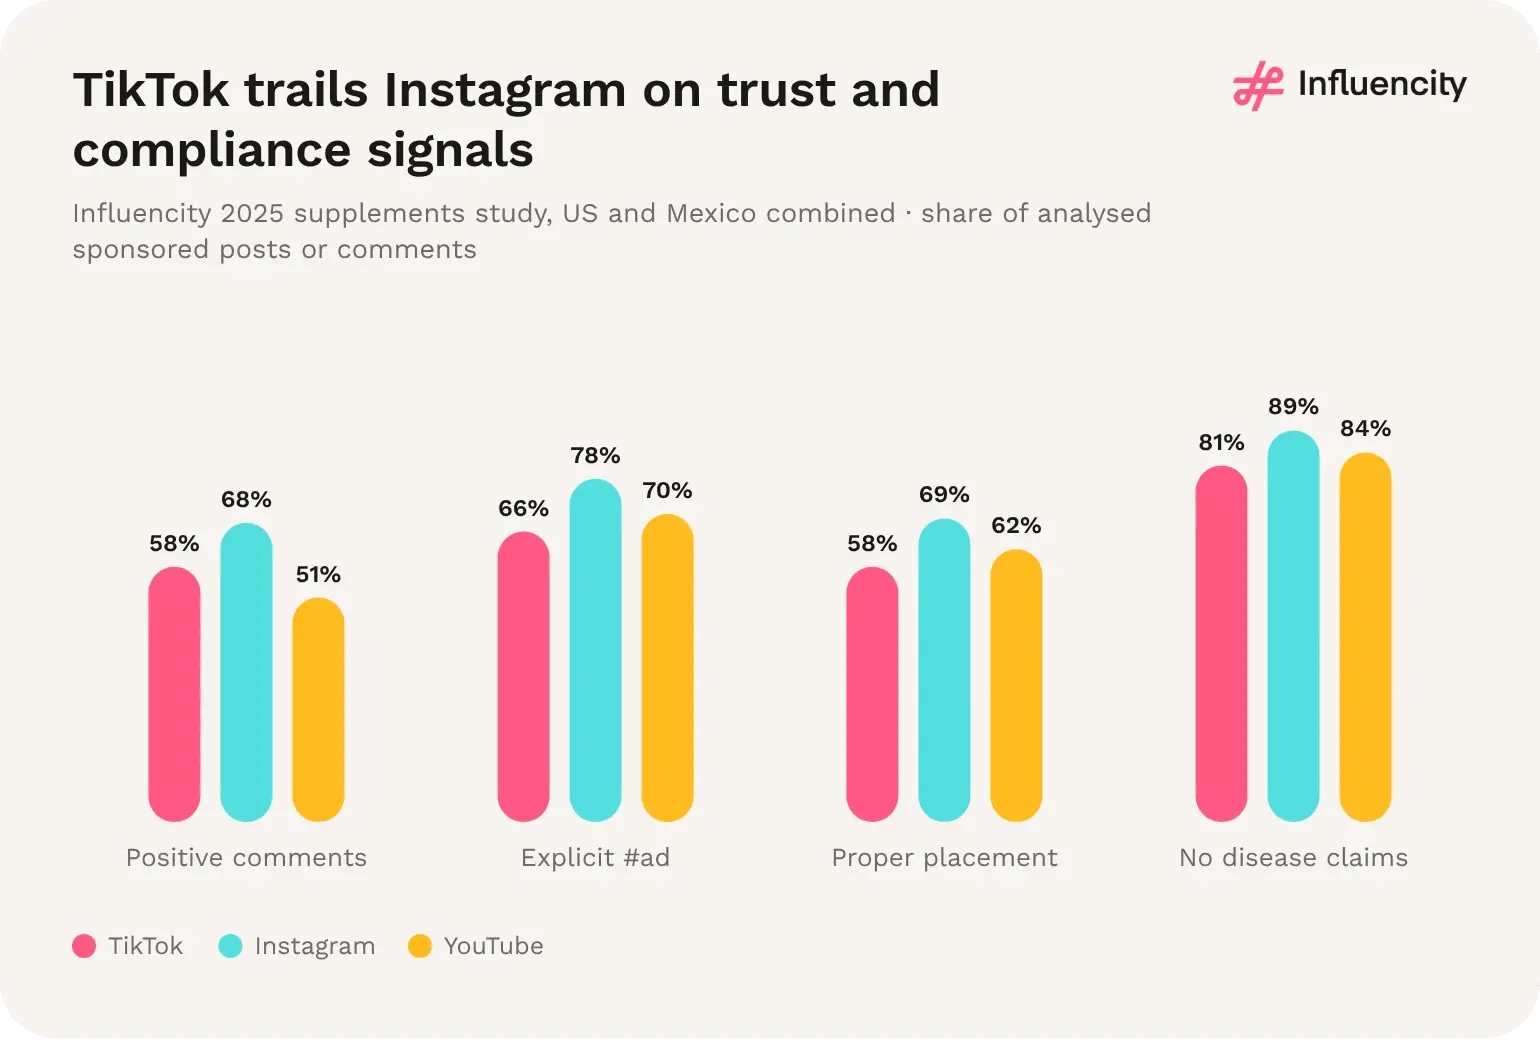
Figure 51 → Sentiment, disclosure and claim compliance by platform in Influencity's supplements study (US and Mexico combined), TikTok shown first. Source: [8].
In Mexico, supplement labelling, claims and advertising fall under COFEPRIS, which, the study notes, prohibits advertising suggesting a supplement can diagnose, treat or cure a disease. With TikTok showing the weakest compliance in the sample, approved claim wording and visible disclosure belong in every Mexican TikTok brief in regulated categories; other LATAM markets have their own regulators. [8]
Influencity's own evidence points to authentic, disclosed content from smaller creators. In the 2025 supplements study, which covered the US and Mexico, routine and lifestyle content earned nearly three times the engagement of hard-sell posts, clearly disclosed posts performed 12% better on long-term engagement, and average engagement fell from a reported 57% for creators under 100,000 followers to 24% above 1M. These are pooled US and Mexico results in one category, not LATAM-wide benchmarks. [8]
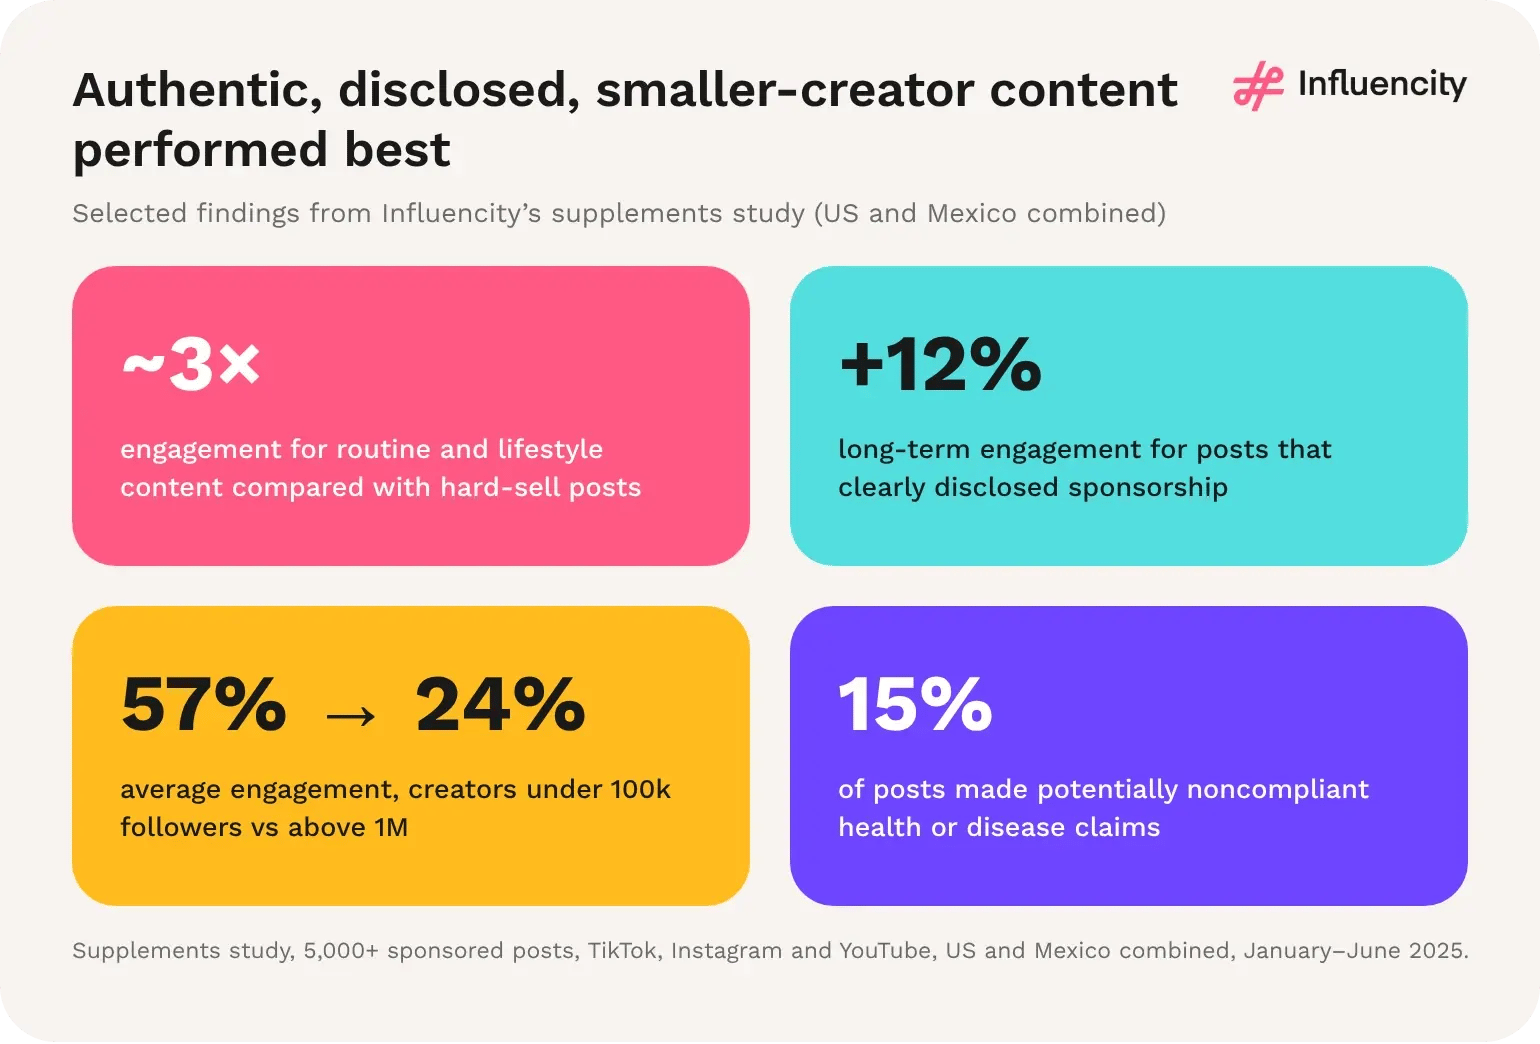
Figure 52 → Selected findings from Influencity’s supplements study: 5,000+ sponsored posts on TikTok, Instagram and YouTube, US and Mexico combined, January–June 2025. Source: [8].
Mostly in Brazil and Mexico, with deep pools in the Andes. Influencity's 2026 data record 2,677,876 micro-tier TikTok records (10,000 to 100,000 followers) across 20 LATAM markets. Brazil holds 1,030,807 and Mexico 490,138; Peru (193,006), Colombia (189,672) and Ecuador (119,876) together add 502,554. Relative to audience, the Dominican Republic (808 per 100,000 estimated users), Brazil (787) and Ecuador (778) are deepest. [1]
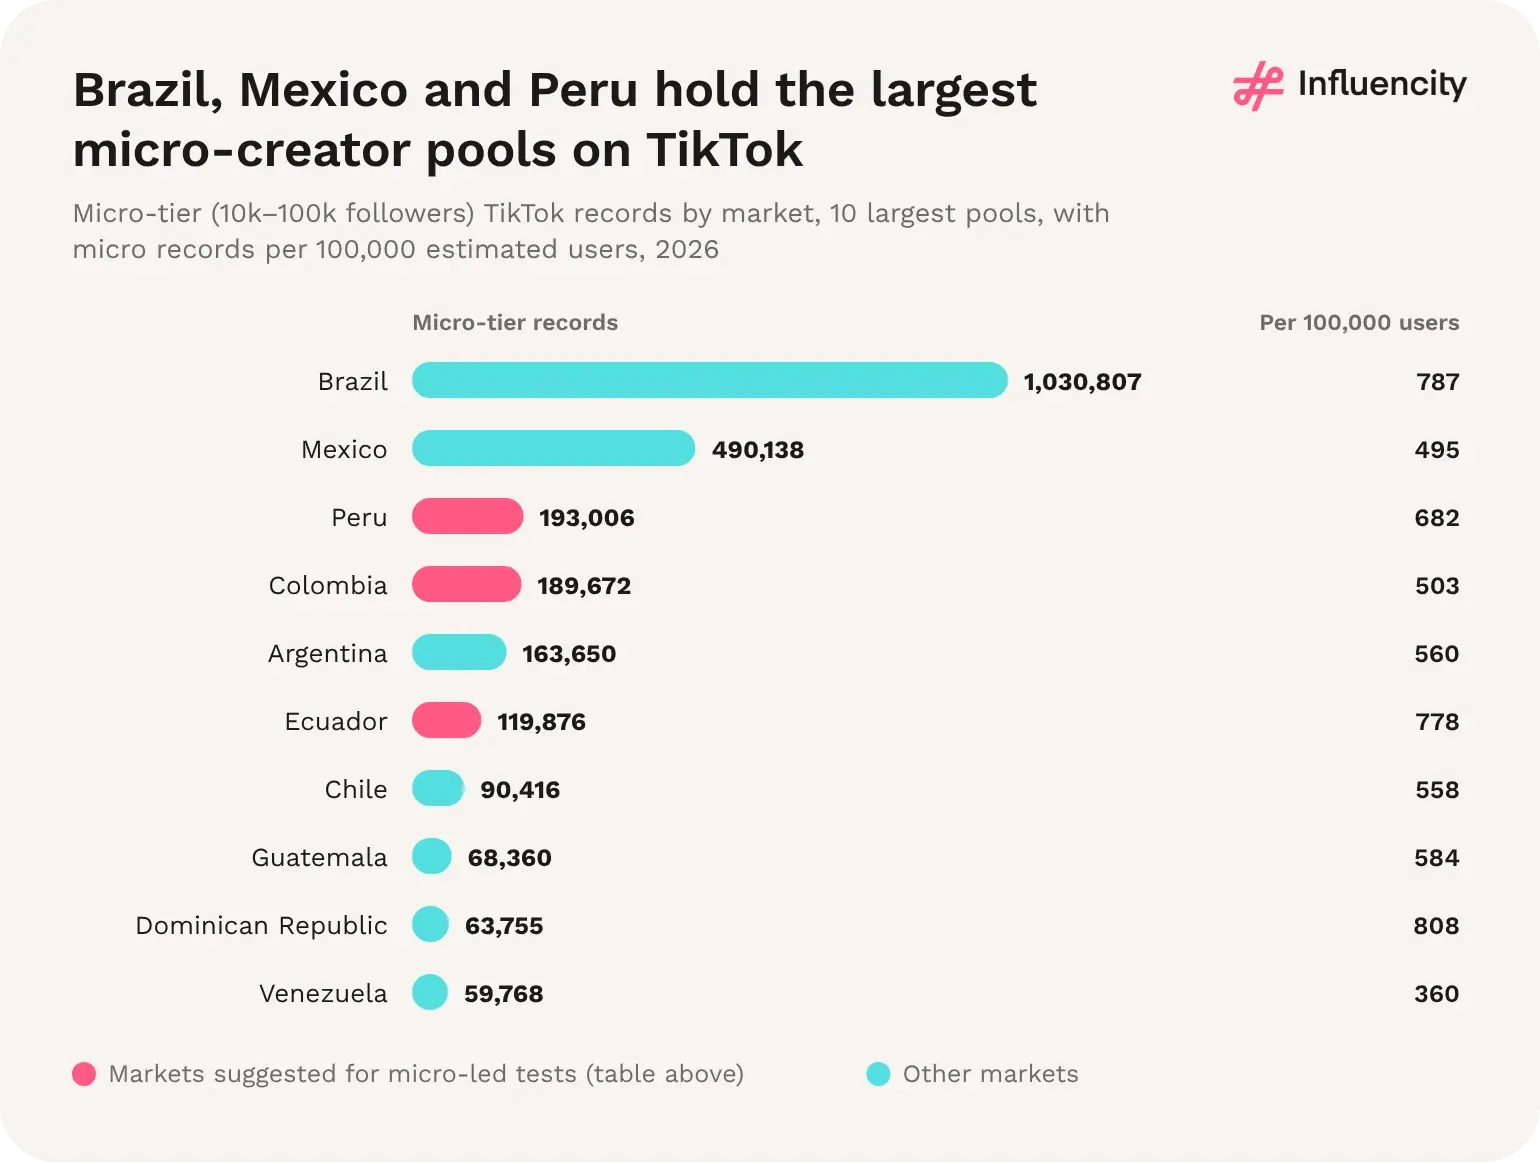
Figure 53 → Micro-tier (10k–100k followers) TikTok records by market, 10 largest pools, with micro records per 100,000 estimated users, 2026. Source: [1].
Lead with community in Mexico and evidence in the US. The supplements study found Mexican engagement was TikTok-led and responded to "energy", "family" and "natural" narratives, while US content leaned on "science-based" and "clinically backed" claims on Instagram. One-size-fits-all messaging underperformed in both markets. [8]
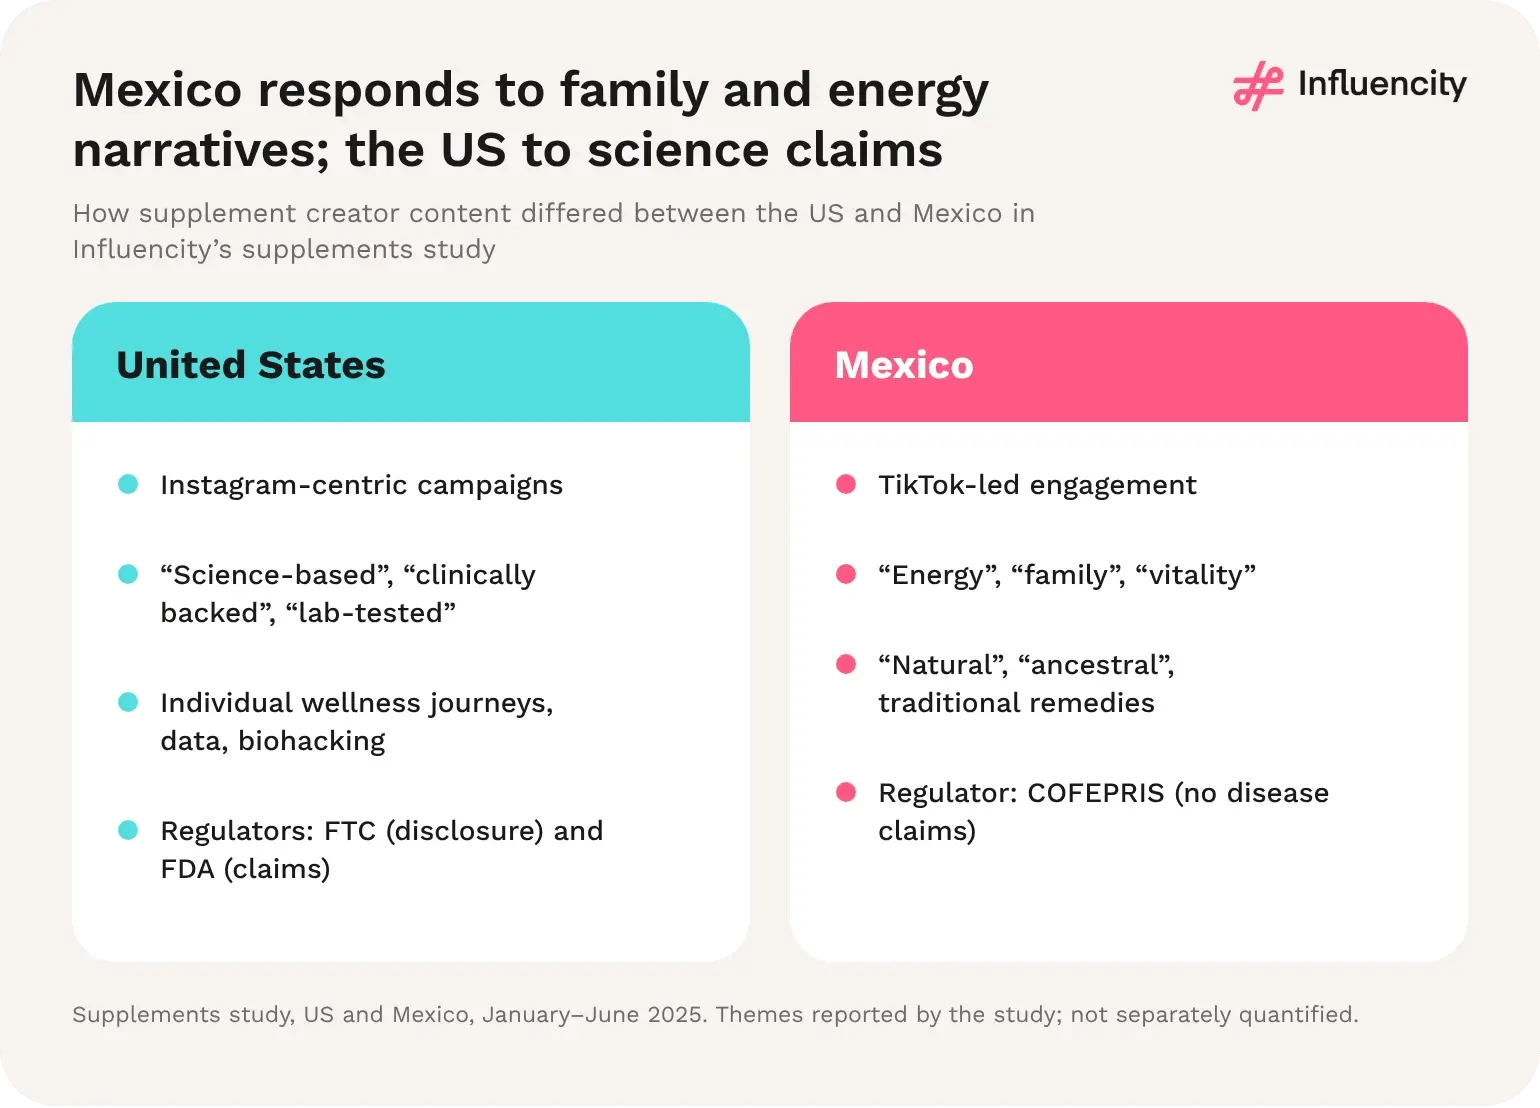
Figure 54 → How supplement creator content differed between the US and Mexico in Influencity’s supplements study, January–June 2025. Themes as reported; not separately quantified. Source: [8].
Content style: routine and lifestyle content drove nearly 3× the engagement of hard-sell supplement posts (Influencity supplements study, US and Mexico, 2025). [8]
Disclosure: posts with clear #ad or #sponsored disclosure performed 12% better on long-term engagement (Influencity supplements study, US and Mexico, 2025). [8]
Creator size: reported average engagement fell from 57% for creators under 100,000 followers to 38% for 100,000–1M and 24% above 1M (Influencity supplements study, US and Mexico, 2025). [8]
Compliance: 15% of analysed supplement posts made potentially noncompliant health or disease claims (Influencity supplements study, US and Mexico, 2025). [8]
Micro supply: 2,677,876 micro-tier TikTok records across 20 LATAM markets in 2026. [1]
1. The evidence and the supply point the same way. The supplements study favours micro-creators, and LATAM has 2.68M micro-tier TikTok records, about ten for every macro creator. [1, 8]
2. Transparency is a performance lever, not only a compliance cost. Disclosed posts performed better over time, yet TikTok had the weakest disclosure in the sample, which leaves room for brands that brief it properly. [8]
3. The evidence base is narrow. Performance findings come from one category and two markets, and are pooled across platforms; they should guide hypotheses for other LATAM markets, not replace testing. [8, 9]
Market by market, micro-led and localised. Influencity's 2026 data show TikTok records more eligible creators than Instagram in 16 of 19 comparable markets, supply is concentrated in Brazil and Mexico, and 98.9% of tier records sit below 100,000 followers. Plans should therefore set platform choice per market, build rosters from nano and micro creators, and reserve mega creators for the few markets that have them. [1, 2]
TikTok in most of Spanish-speaking LATAM; both platforms in Brazil and Argentina. Seven markets, from Nicaragua (13.59x) to El Salvador (5.58x), record more than five eligible TikTok profiles per Instagram profile. Six, including Mexico (3.66x) and Colombia (2.34x), record between 1.5 and 5. Brazil (0.82x), Argentina (0.83x), Chile, Uruguay and Panama are close to parity, and Puerto Rico leans to Instagram (0.13x). [1, 2]
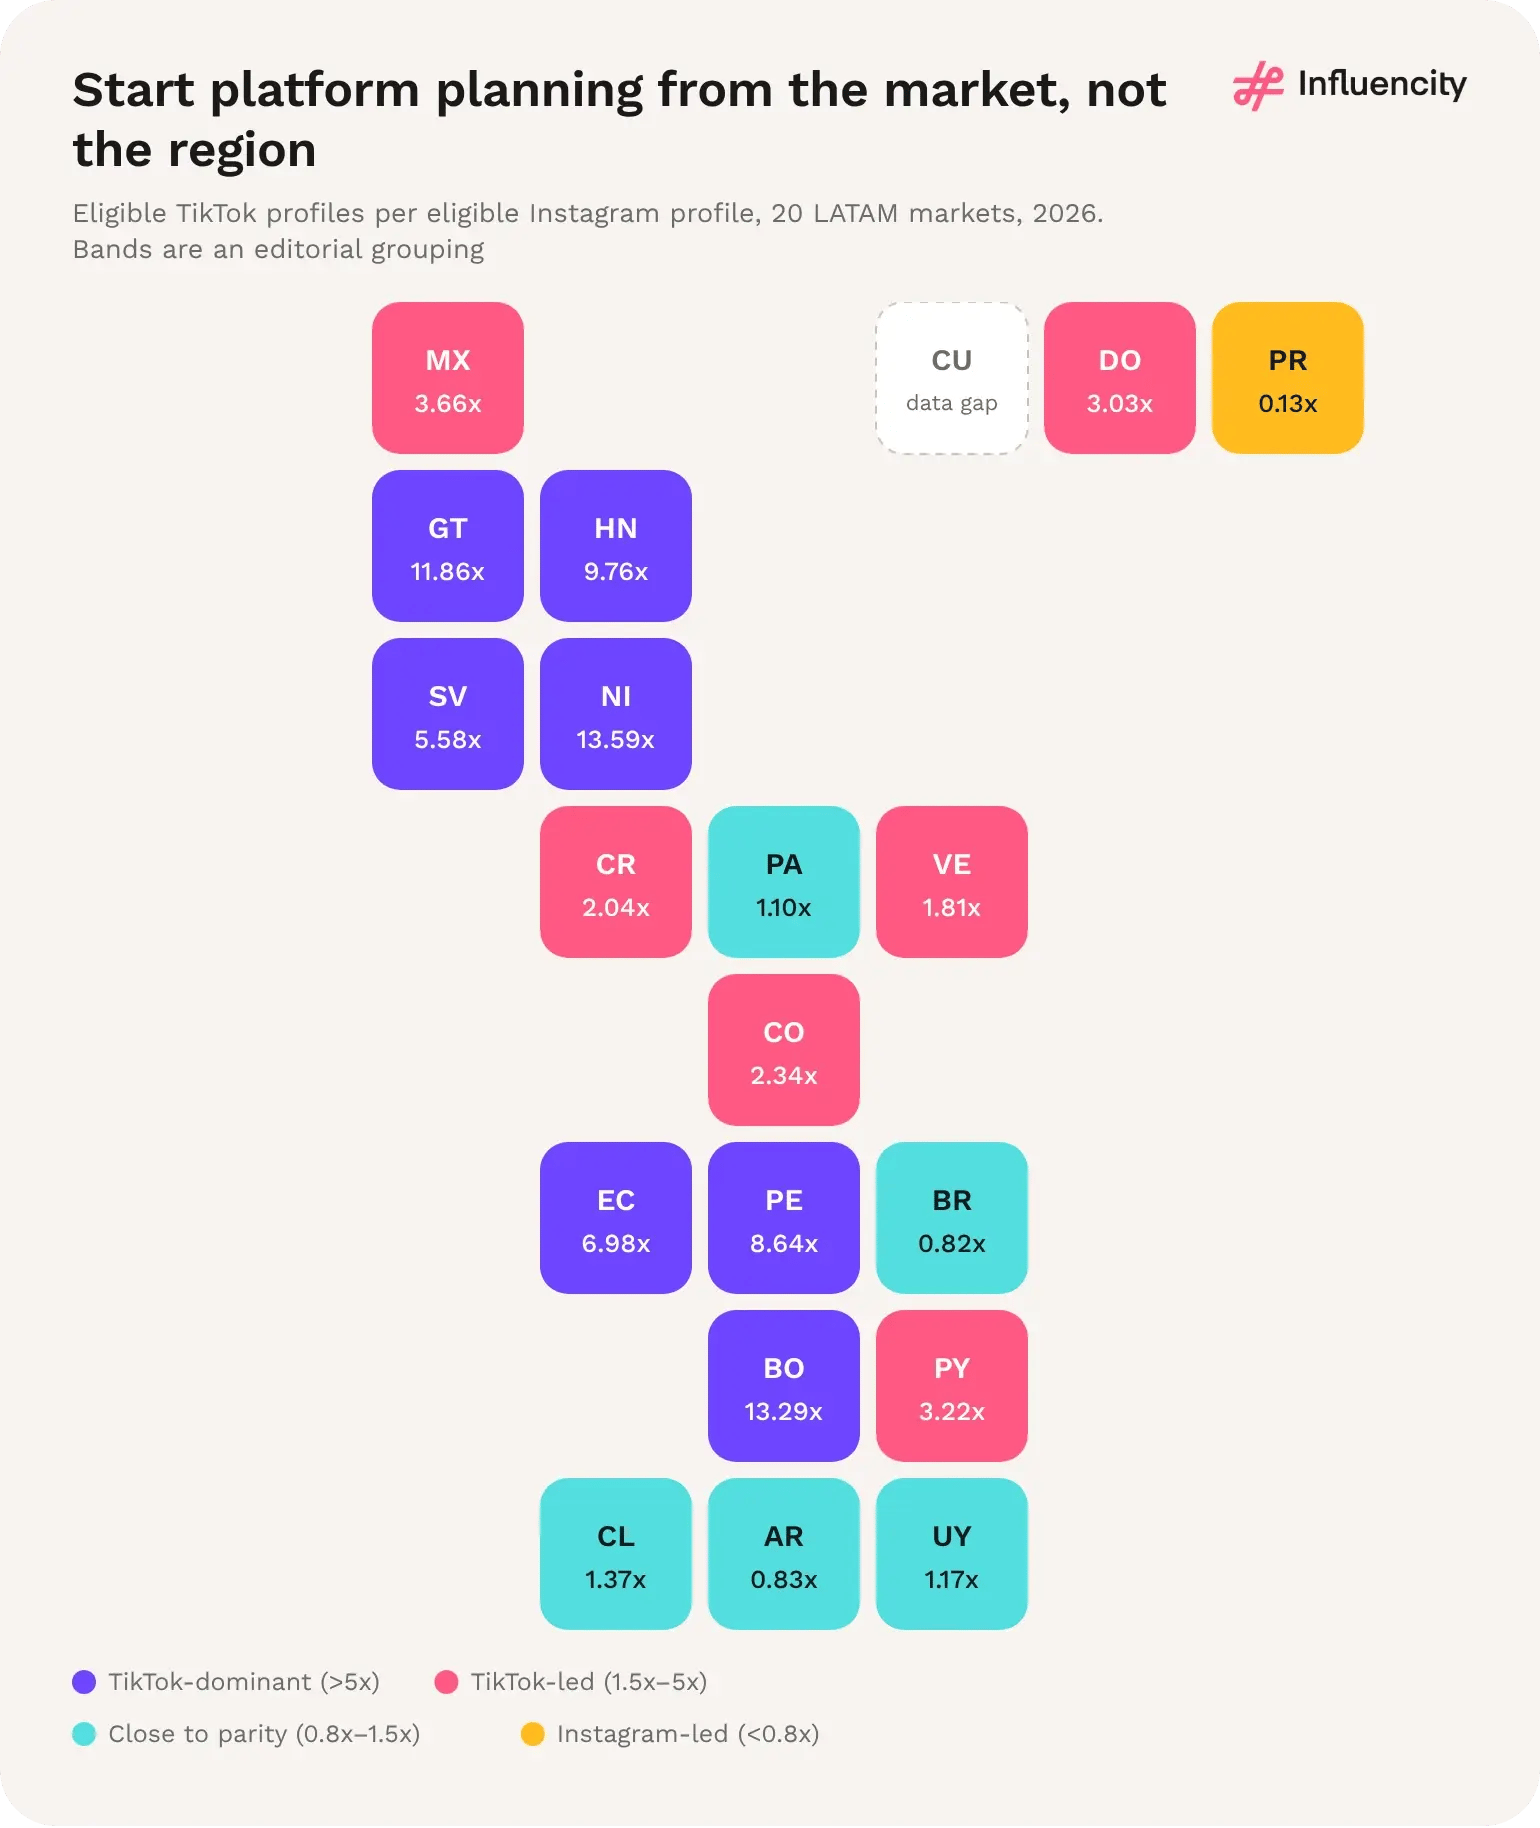
Figure 55 → Eligible TikTok profiles per eligible Instagram profile, 20 LATAM markets, 2026. Bands are an editorial grouping. Cuba shown as a data gap. Sources: [1, 2].
Deep at micro level, thin at the top outside Brazil and Mexico. The eight largest markets each record at least 68,000 micro-tier TikTok records, but mega-tier supply falls from 7,085 in Brazil and 3,831 in Mexico to 1,592 in Colombia, 945 in Argentina, 815 in Peru and 140 in Guatemala. The other 18 markets hold 5,668 mega-tier records between them. [1]
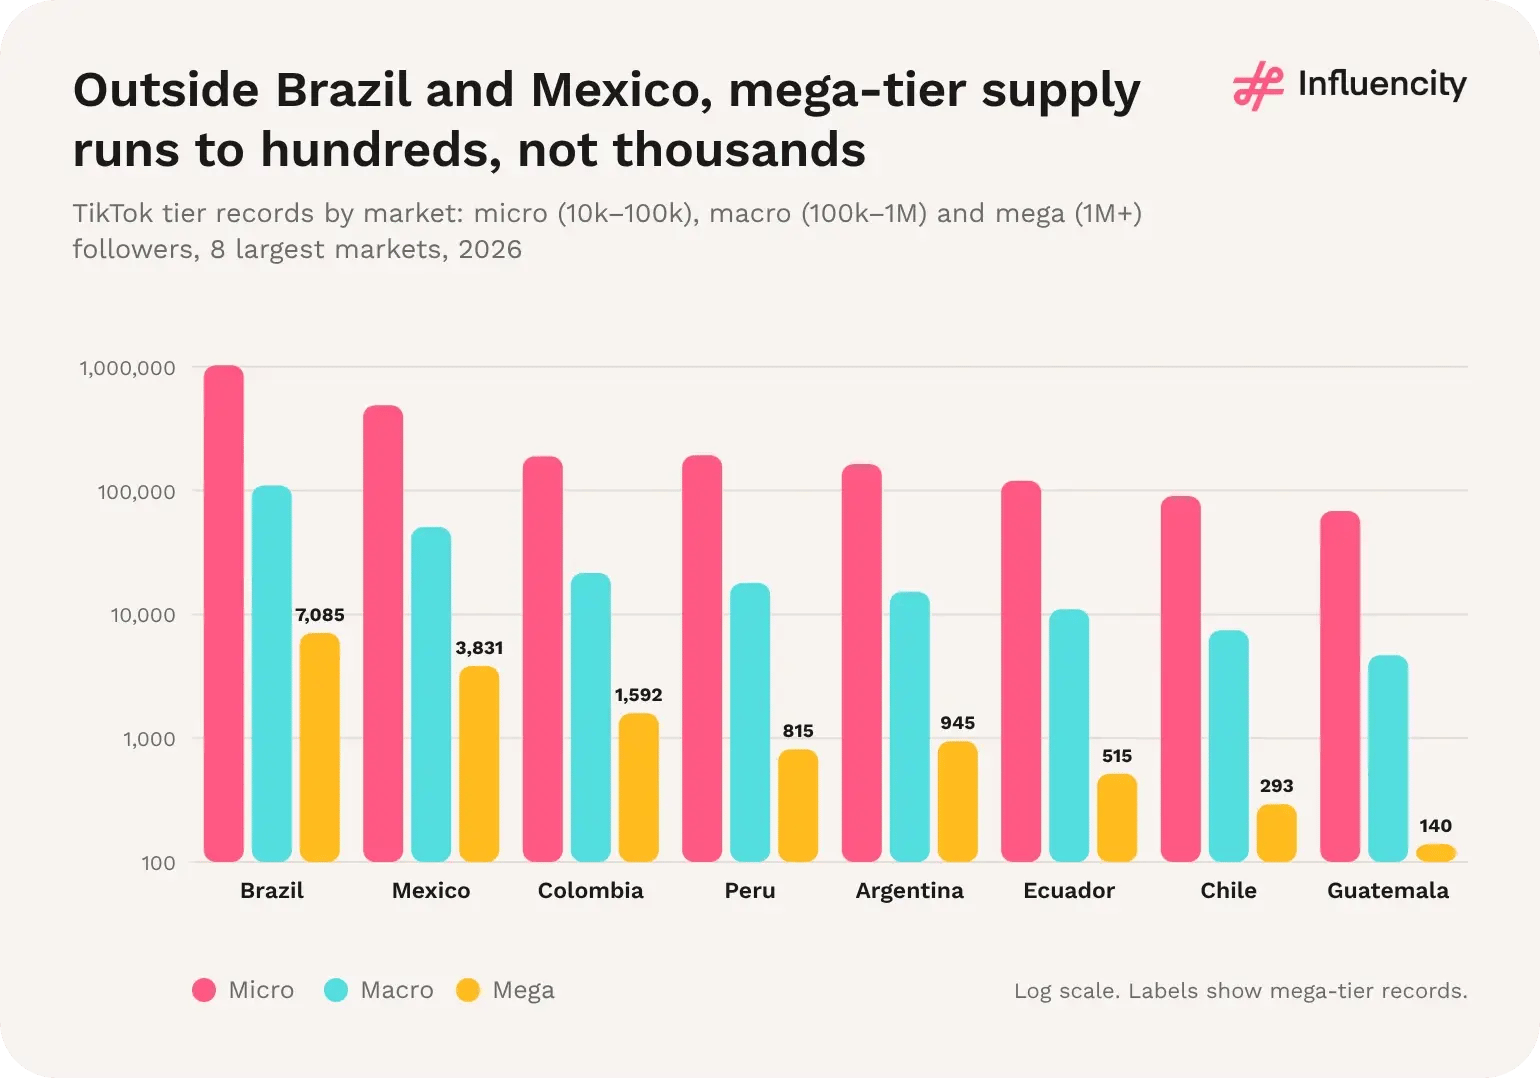
Figure 56 → TikTok tier records by market: micro (10k–100k), macro (100k–1M) and mega (1M+) followers, eight largest markets, 2026, on a log scale. Source: [1].
Five steps link the market data to a campaign: choose the platform by market, size the pool, set the tier mix, localise the brief, and control and measure. Each step draws on a different part of this study, from platform ratios (section 09) to tier depth (section 11) and category evidence (section 14). [1, 2, 8]
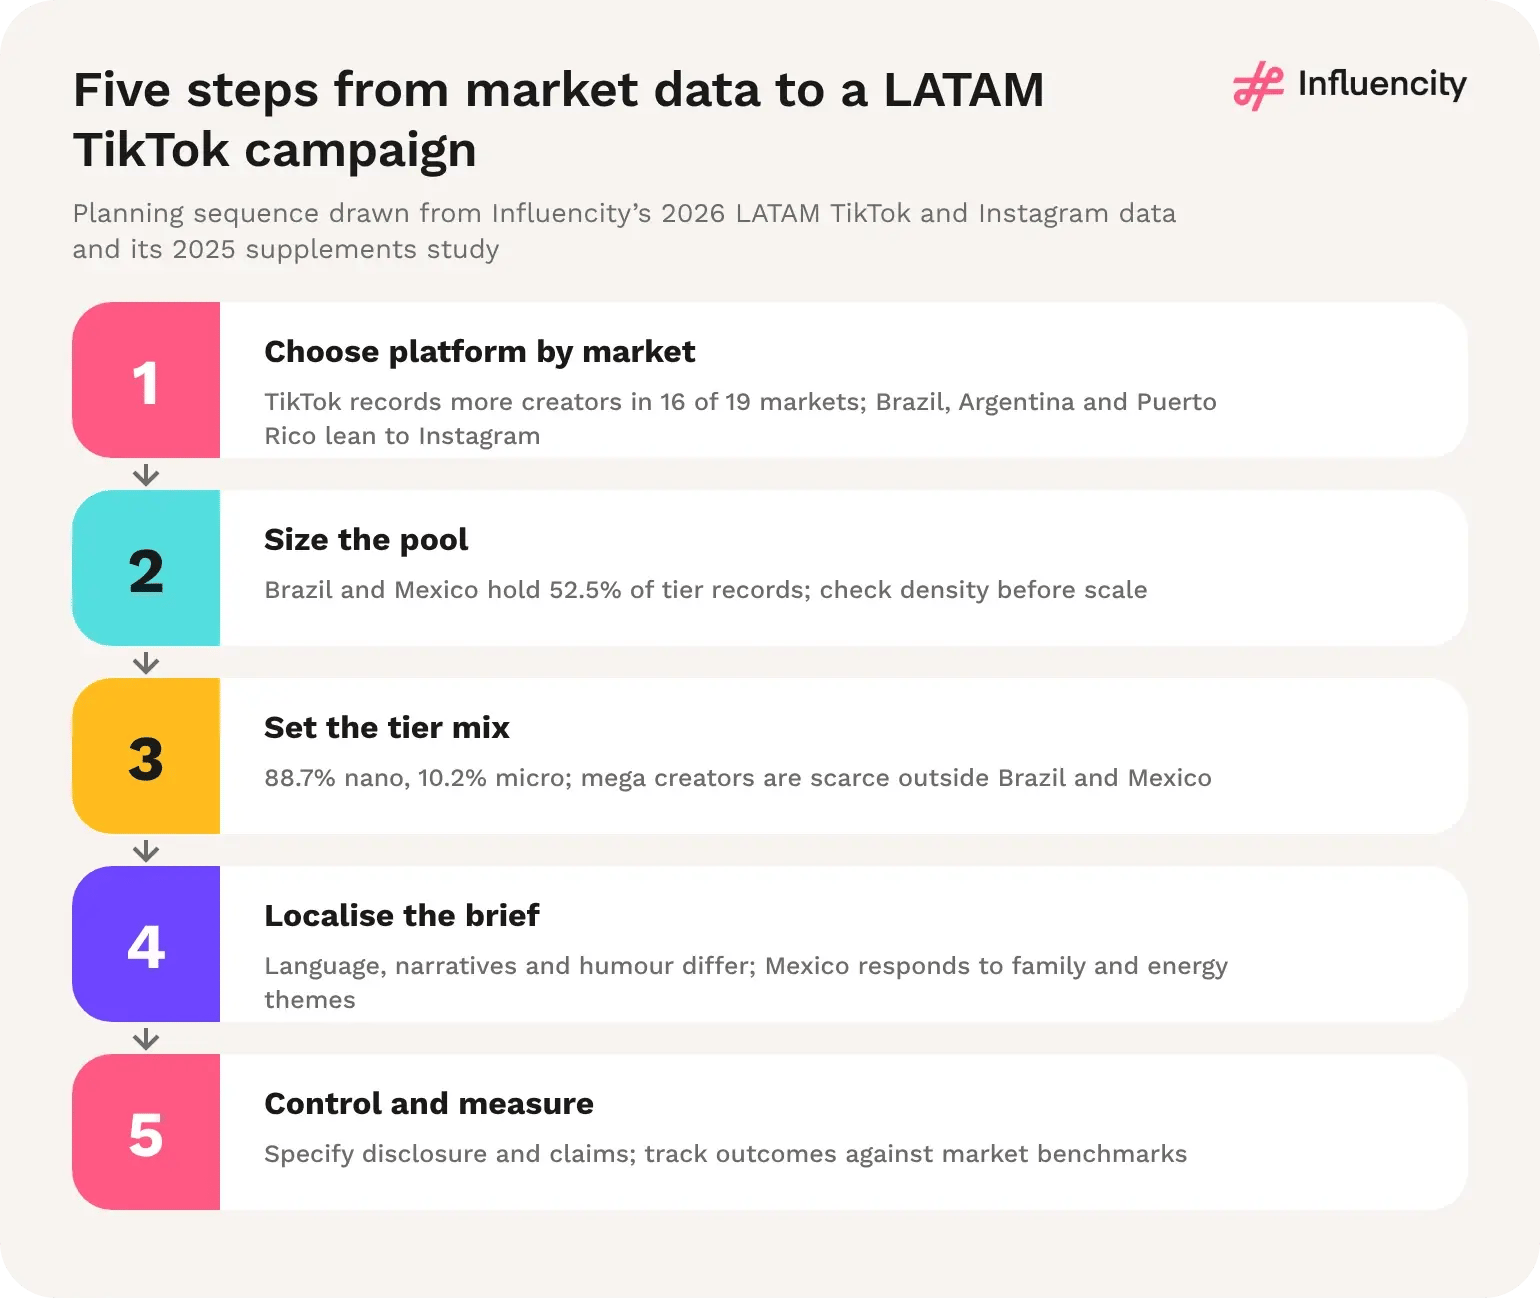
Figure 57 → Planning sequence drawn from Influencity’s 2026 LATAM TikTok and Instagram data and its 2025 supplements study. Sources: [1, 2, 8].
Platform: TikTok records more eligible creators than Instagram in 16 of 19 comparable LATAM markets (Influencity, 2026). [1, 2]
Tier mix: 98.9% of LATAM TikTok tier records have fewer than 100,000 followers. [1]
Mega scarcity: Brazil and Mexico hold 10,916 of 16,584 mega-tier records; the other 18 markets hold 5,668. [1]
Macro depth: Colombia (21,601), Peru (17,934) and Argentina (15,221) have the largest macro-tier pools after Brazil and Mexico. [1]
1. One regional plan will mis-weight most markets. Platform balance ranges from 13.59x to 0.13x, so a single LATAM platform split cannot fit Mexico, Brazil and Central America at once. [1, 2]
2. Scale comes from rosters, not stars. With mega creators in the hundreds outside Brazil, Mexico and Colombia, reach in most markets depends on coordinating many micro and macro creators. [1]
3. Supply data set the shortlist, not the result. Creator counts show where to look; content fit, audience quality and measured outcomes decide which creators to keep. [1, 8]
Set platform per market. Use Figure 55 as a starting point and confirm with category-specific shortlists.
Size rosters to tier depth. Plan mega creators only where supply exists; elsewhere, budget for more micro and macro creators.
Write one brief per market. Adapt language, narratives and offers; a single Spanish brief does not cover Brazil or regional differences.
Build compliance into the brief. Specify disclosure format and approved claims before creators start, especially on TikTok. [8]
Benchmark locally. Compare results with market-level, not regional or US and European, benchmarks.
In layers, market by market and over time. Track exposure, resonance, trust and compliance, traffic and sales, and reuse separately, and compare each market with its own baseline rather than a regional or US benchmark. Influencity's supplements study found that clearly disclosed posts performed 12% better on long-term engagement, so measurement windows should extend beyond launch week. [8]
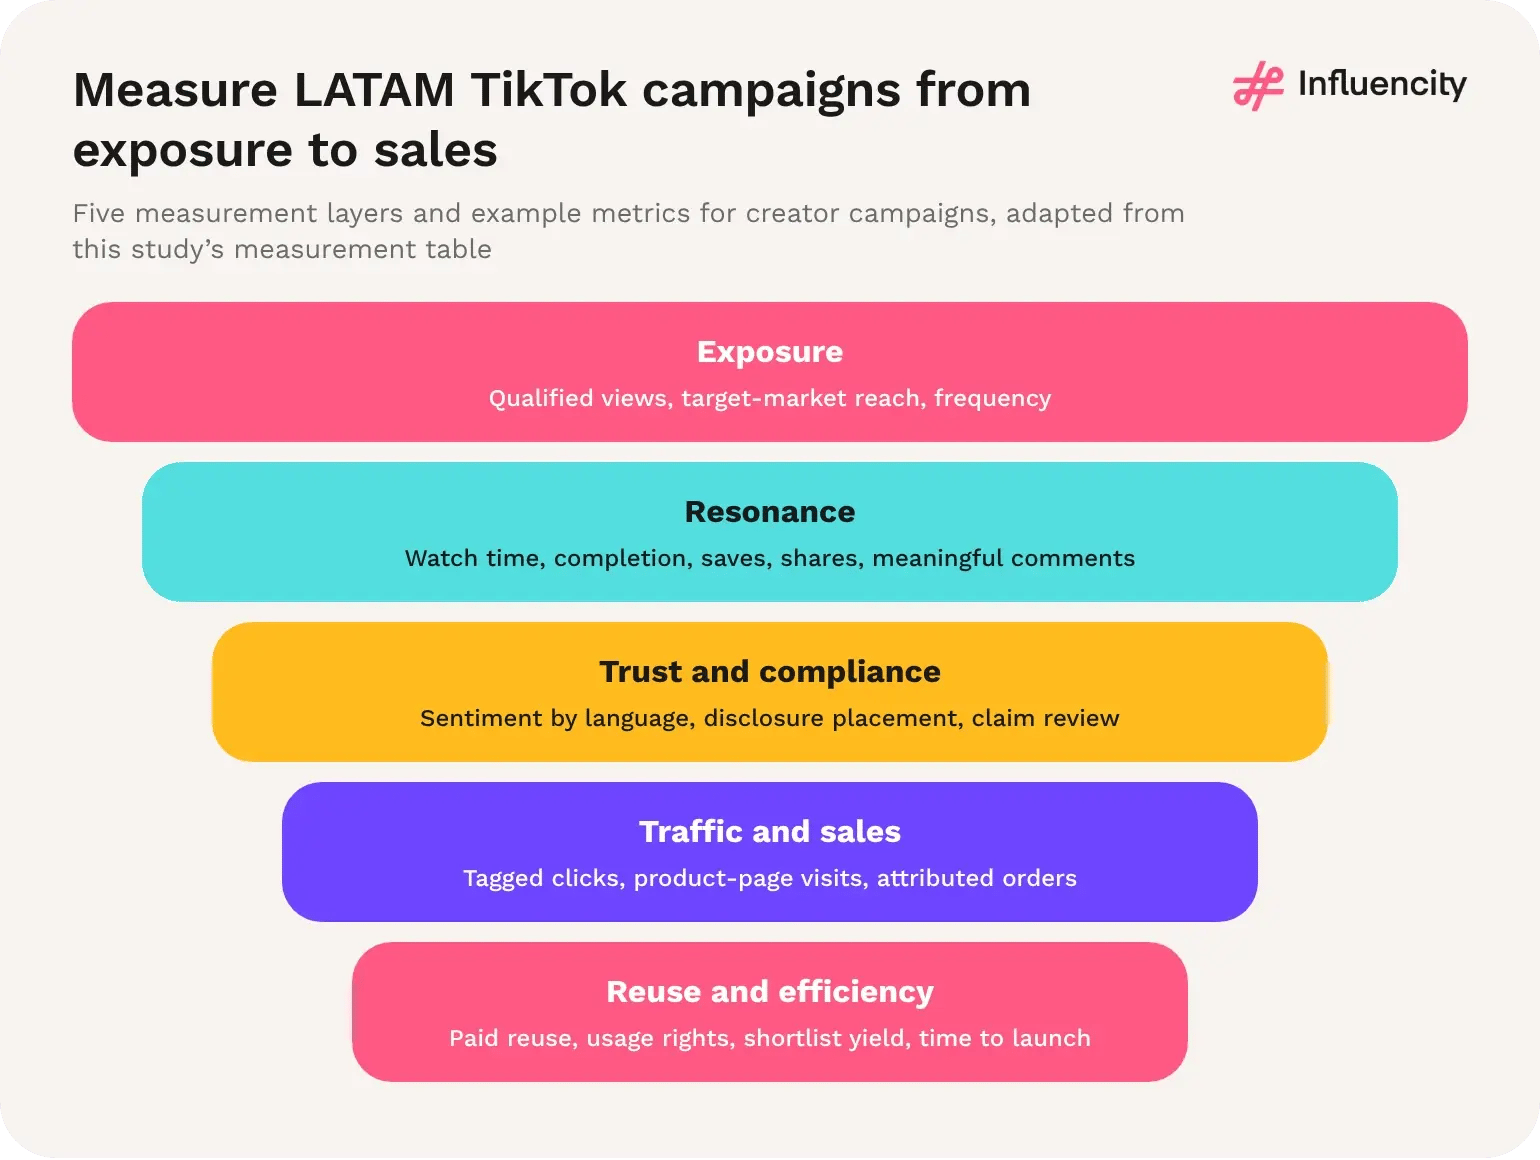
Figure 58 → Five measurement layers and example metrics for LATAM TikTok creator campaigns, adapted from the measurement table above.
Because classification coverage differs. Across 20 LATAM markets, 15.0% of eligible TikTok profiles have no gender classification, but the share ranges from 8.3% in Nicaragua to 19.5% in Chile, with Peru (17.3%), Argentina (16.7%), Brazil (16.0%) and Mexico (15.9%) also above the regional figure. Reports that segment creators or audiences by gender should state the unclassified share for each market. [1]
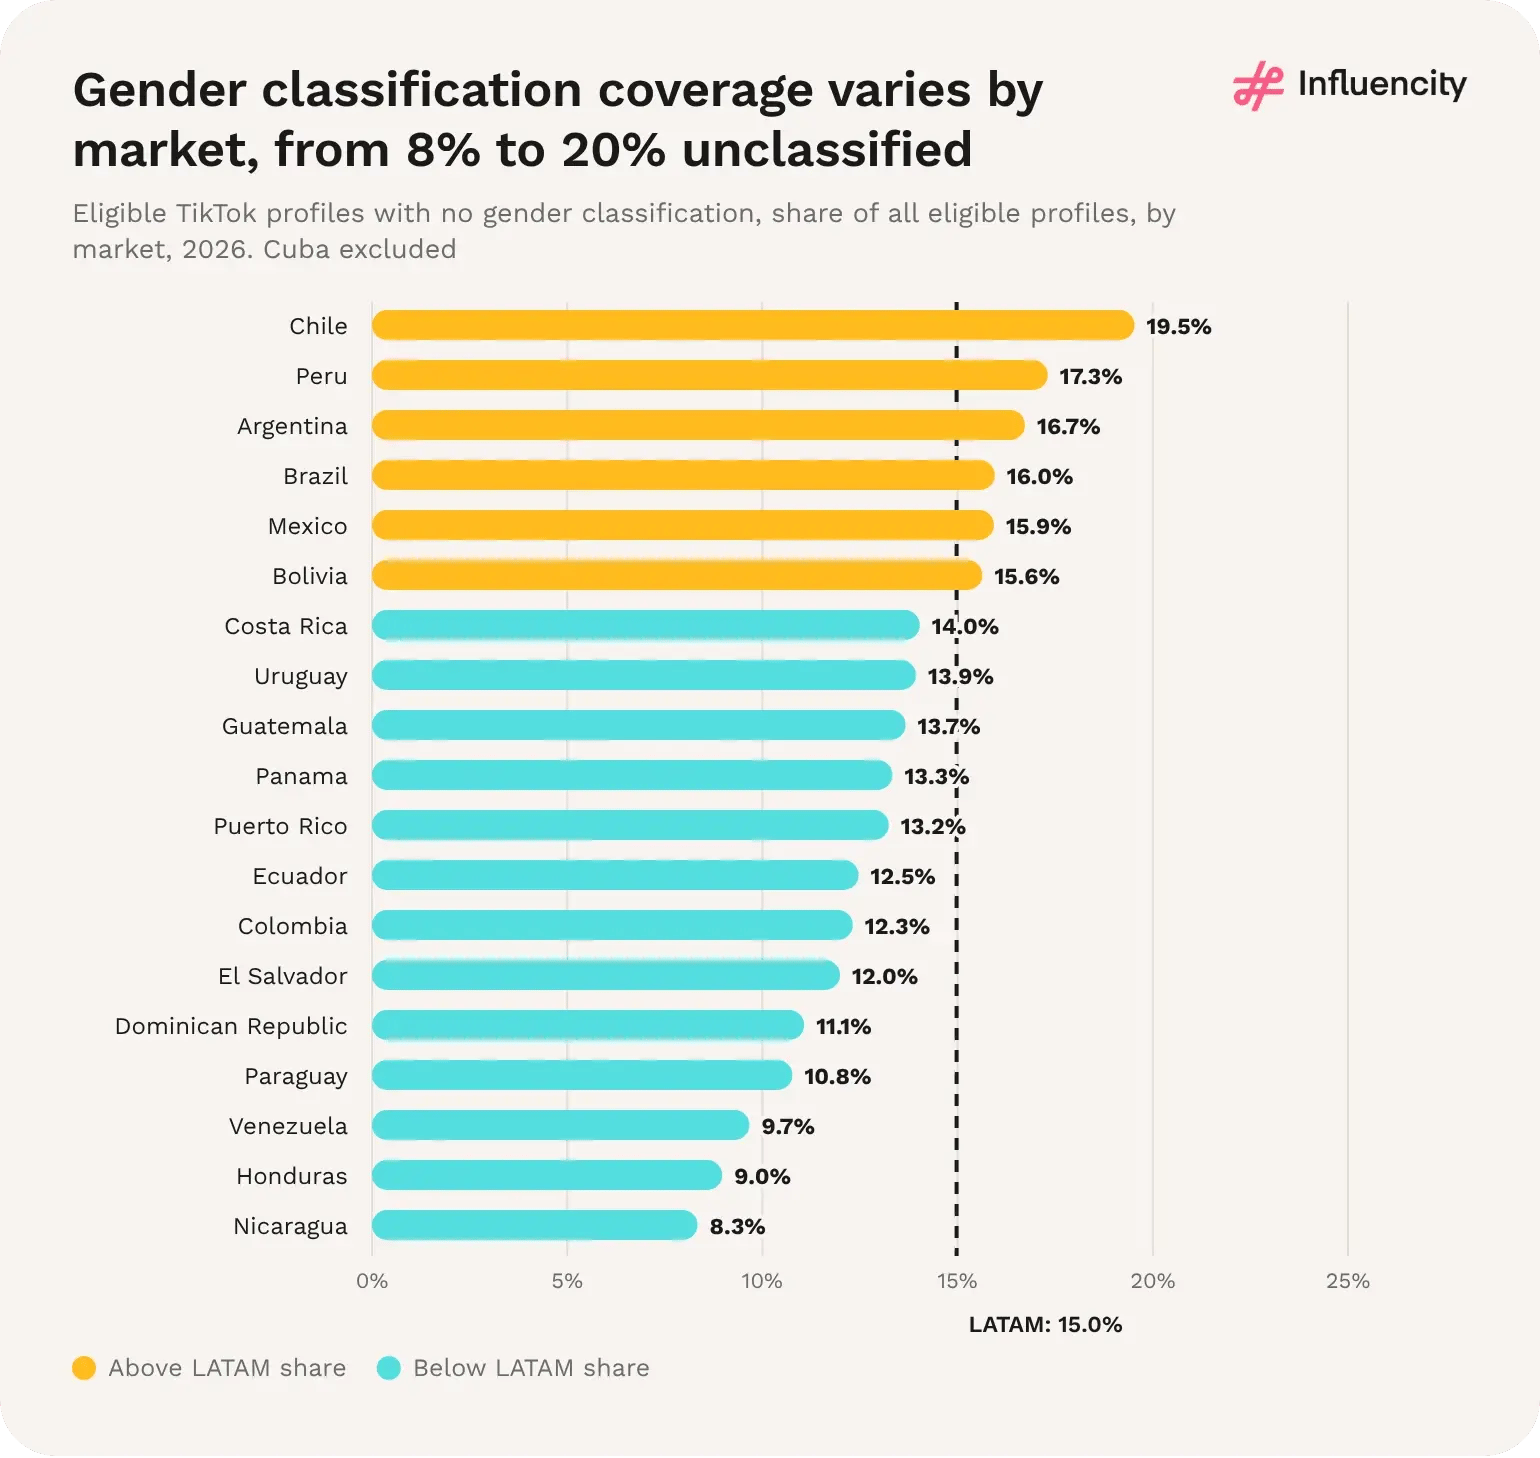
Figure 59 → Eligible TikTok profiles with no gender classification as a share of all eligible profiles, by market, 2026. Cuba excluded. Source: [1].
Set objectives, disclosure rules and a baseline before launch; track delivery, disclosure and sentiment in flight; and measure long-term engagement, incrementality and market benchmarks afterwards. Recording the recruitment funnel from the start also shows how efficiently each market turns shortlists into active partners. [8]
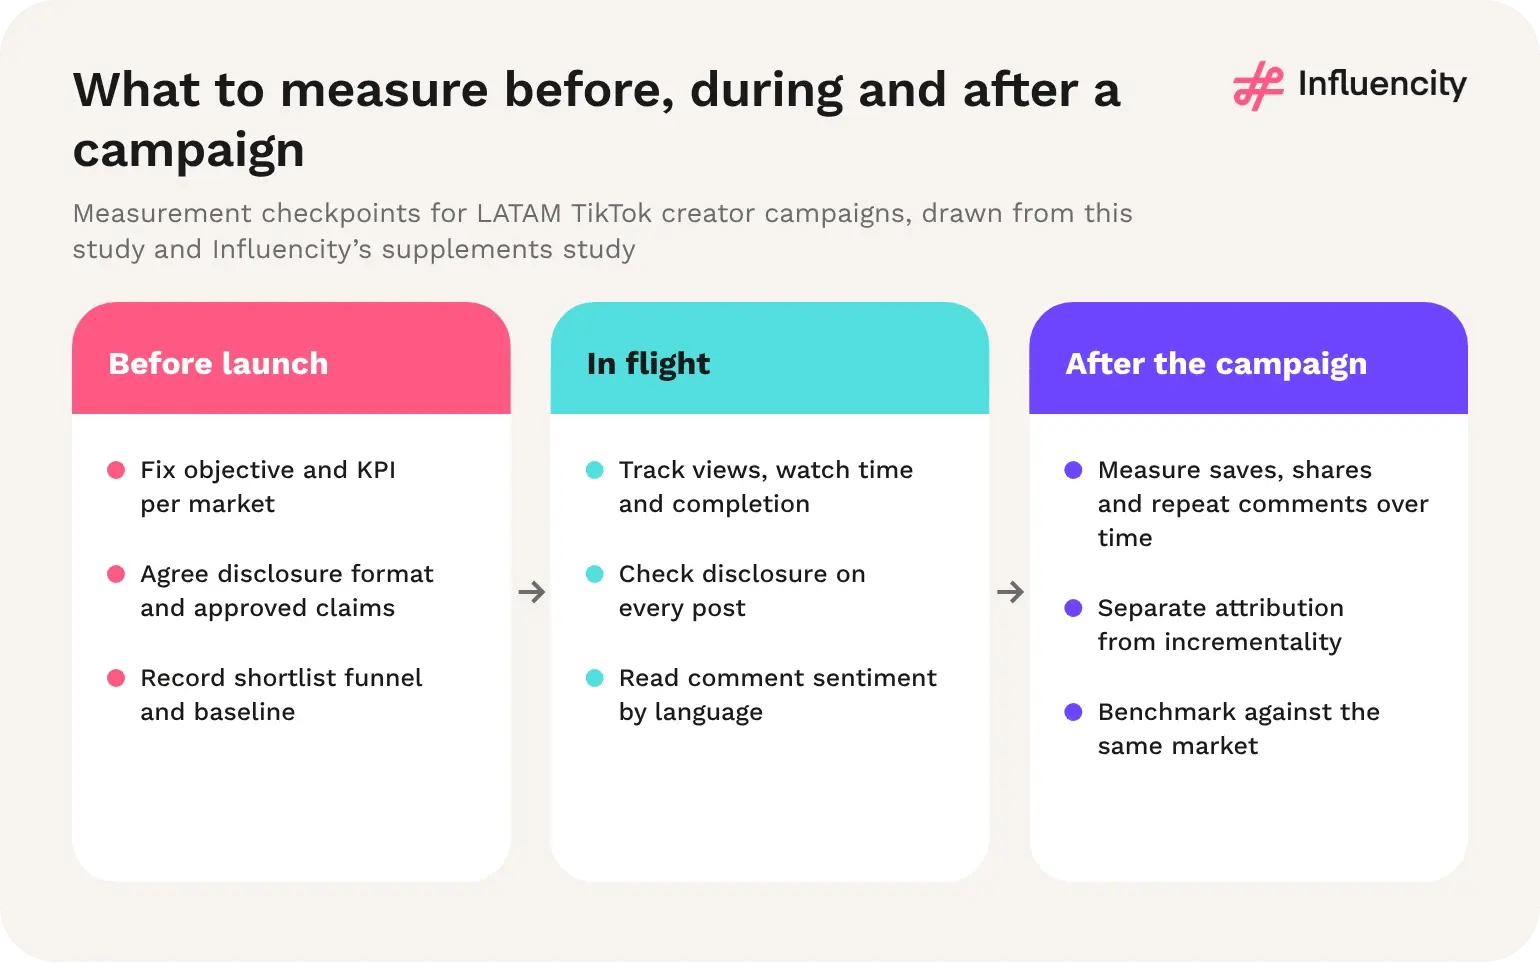
Figure 60 → Measurement checkpoints before, during and after LATAM TikTok creator campaigns, drawn from this study and Influencity’s supplements study. Sources: [1, 8].
Disclosure: clearly disclosed sponsored posts performed 12% better on long-term engagement in Influencity's supplements study (US and Mexico, 2025). [8]
Compliance risk: 15% of analysed supplement posts made potentially noncompliant health or disease claims in Influencity's supplements study (US and Mexico, 2025). [8]
Data coverage: 15.0% of eligible LATAM TikTok profiles have no gender classification, from 8.3% to 19.5% by market (Influencity, 2026). [1]
1. Short windows understate creator content. The supplements study found long-term engagement gains from disclosed posts, which a launch-week report would miss. [8]
2. Sentiment needs language-level reading. Positive comment rates differed by language in the supplements study; in LATAM, Spanish and Portuguese comments should be read separately. [8]
3. Supply data are not performance data. This study counts eligible creators; engagement, reach and sales must come from campaign measurement. [1]
Set one KPI per objective and market. Avoid a single regional KPI that hides market differences.
Extend reporting windows. Track saves, shares and repeat comments for weeks after posting, not only views at launch.
Audit disclosure on every post. Record presence and placement as campaign metrics, not only compliance checks. [8]
Separate attribution from incrementality. Use holdouts or matched markets where possible before claiming sales impact.
State data coverage in reports. Include the unclassified share whenever results are split by creator gender. [1]
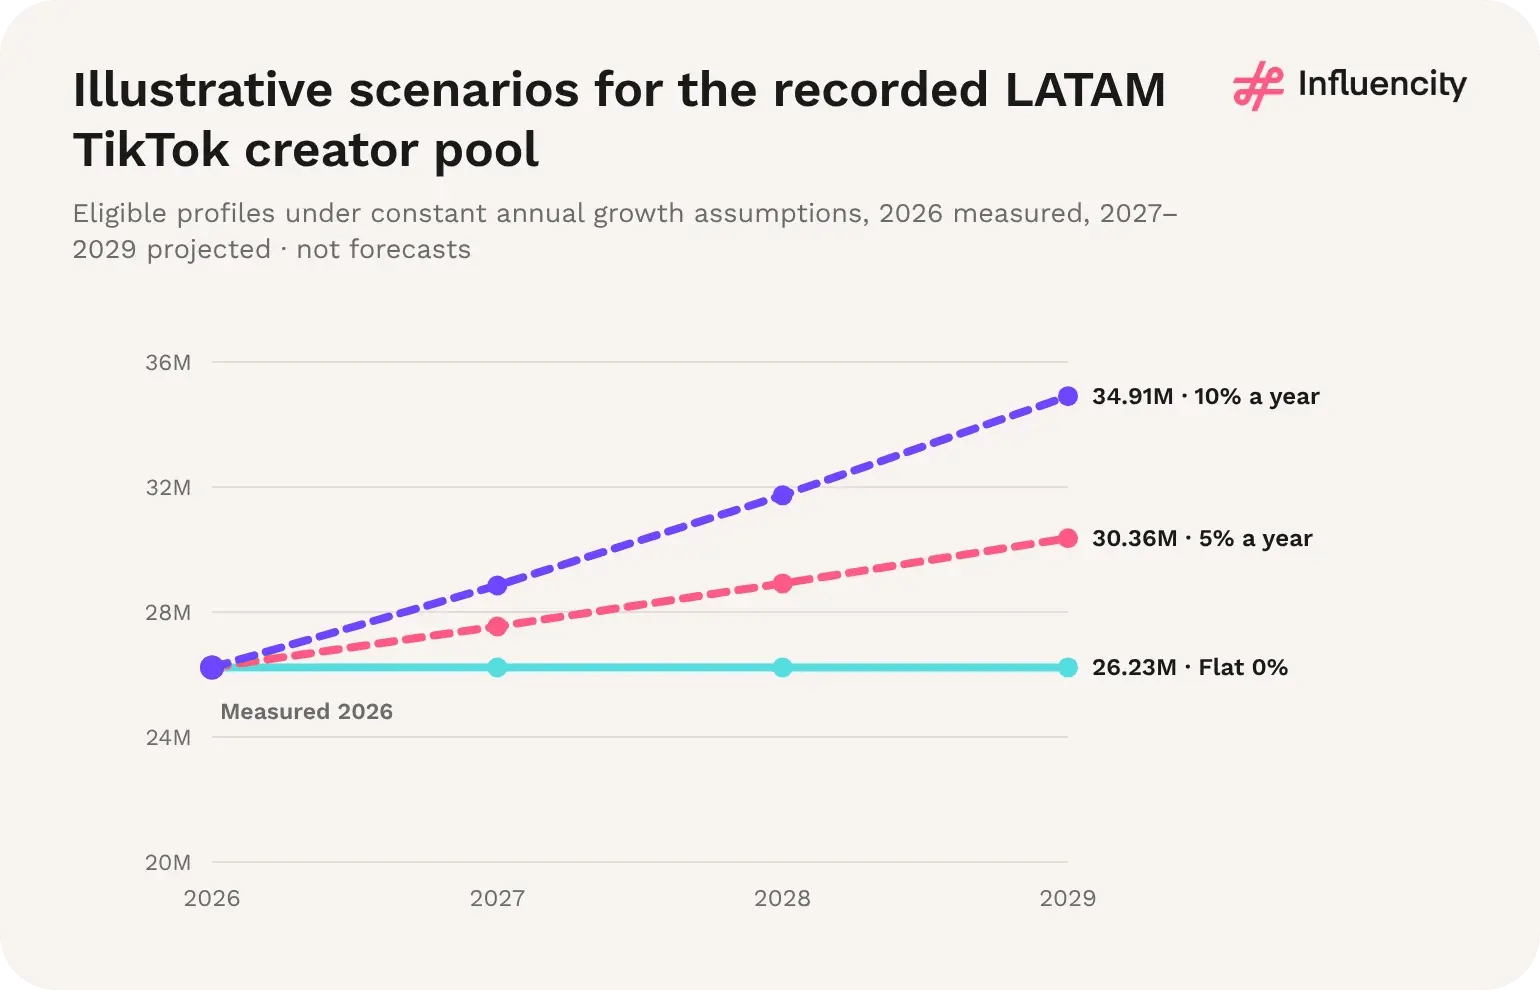
Figure 61 → Scenarios apply selected constant growth assumptions to recorded profile counts. Source: [1].
Formula: C(2026 + h) = 26,226,153 × (1 + g)^h, where h is years after 2026 and g the assumed annual rate.
It depends on the growth rate assumed, and no measured rate exists yet. Applied to the 26,226,153 eligible TikTok profiles recorded across 20 LATAM markets in 2026, a flat rate keeps the pool at 26.2 million, 5% a year gives 30.4 million and 10% a year gives 34.9 million by 2029. These are illustrative scenarios, not forecasts. [1]
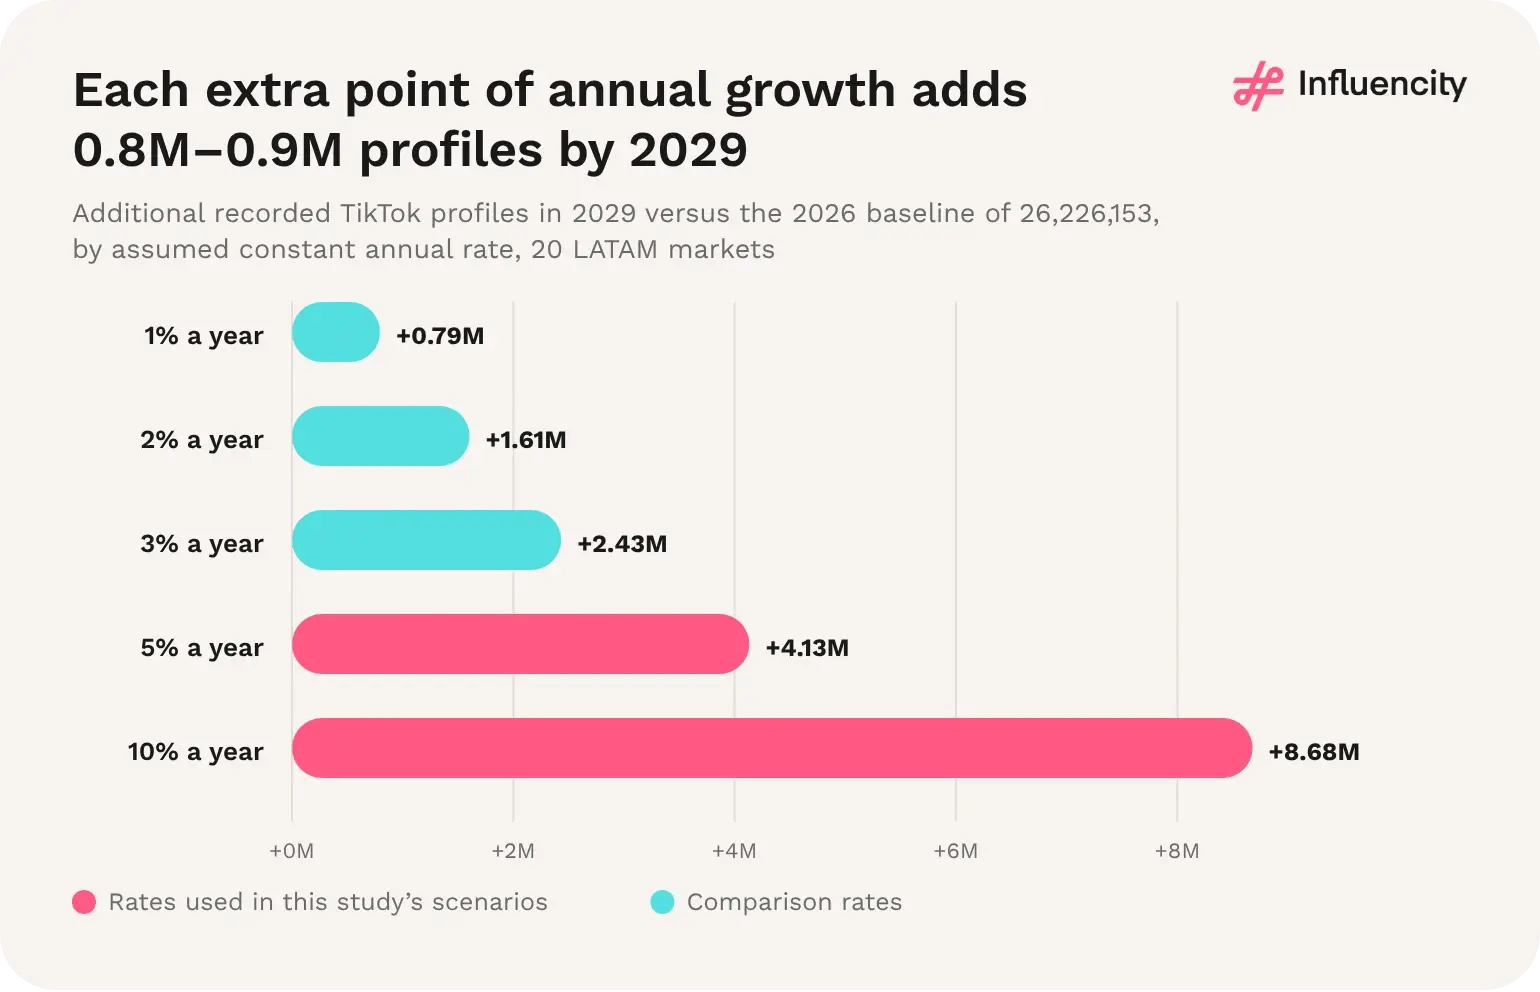
Figure 62 → Additional recorded TikTok profiles in 2029 versus the 2026 baseline, by assumed constant annual rate. Illustrative calculation, not a forecast. Source: [1].
Because small changes in the rate move the 2029 figure by millions. Over three years, each extra percentage point of annual growth adds between 0.8 million and 0.9 million recorded profiles: 1% adds 0.79 million, 5% adds 4.13 million and 10% adds 8.68 million. Until Influencity records a comparable second LATAM TikTok count, no rate in this range can be preferred on evidence. [1]
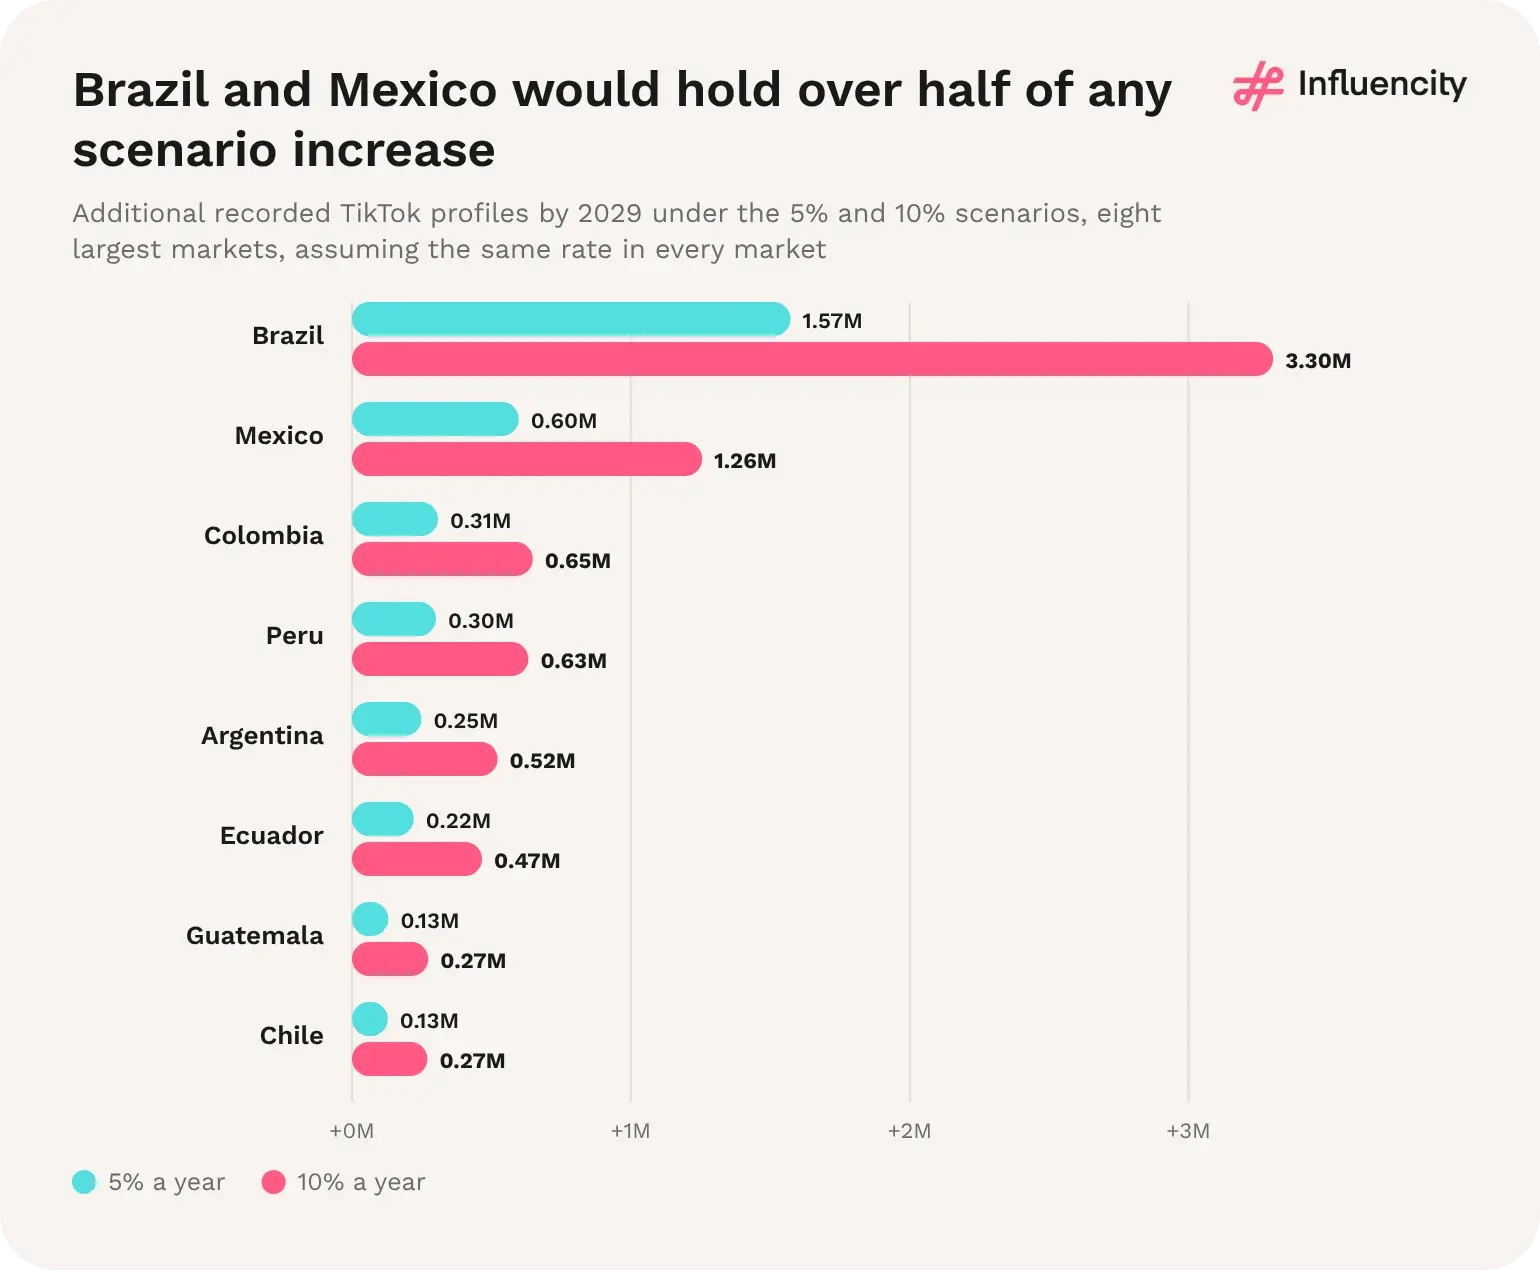
Figure 63 → Additional recorded TikTok profiles by 2029 under the 5% and 10% scenarios, eight largest markets, assuming the same rate in every market. Illustrative calculation. Source: [1].
Mostly where the pool is already large. Because the scenarios apply one rate to every market, each market keeps its 2026 share. Brazil (38.1%) and Mexico (14.5%) would account for 52.5% of any increase: at 10% a year, Brazil would add 3.30 million profiles and Mexico 1.26 million. Real market growth is unlikely to be this even, which is why the scenarios should be re-tested market by market. [1]
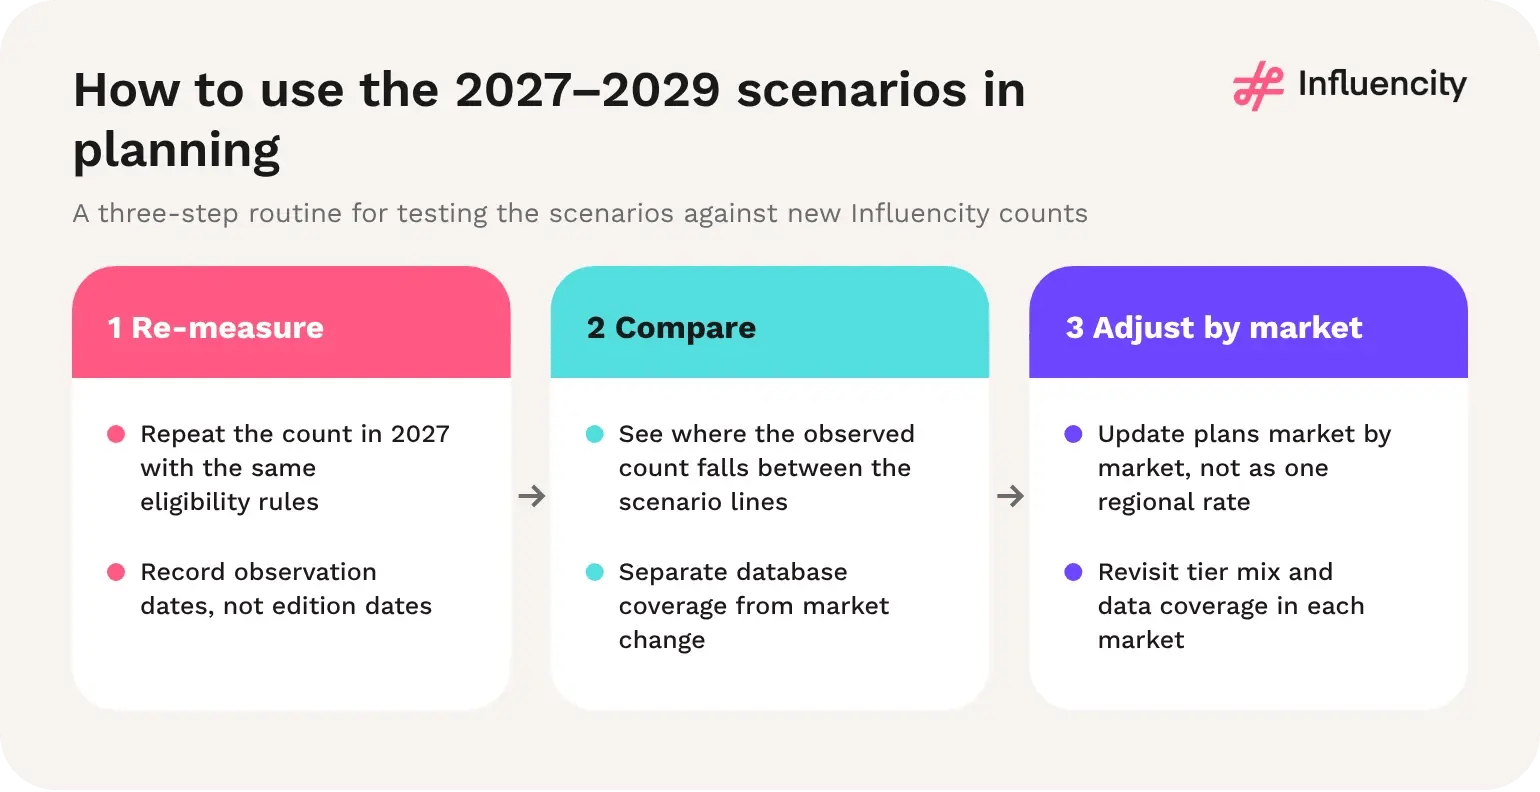
Figure 64 → A three-step routine for testing the 2027–2029 scenarios against new Influencity counts.
1. The range is wide by design. The gap between the flat and 10% cases reaches 8.7 million profiles by 2029, a third of the 2026 pool. [1]
2. A higher count is not automatically a larger market. Future increases may reflect wider database coverage, changes in eligibility rules or real creator growth; each needs to be identified before a rate is used for planning.
3. A uniform rate hides market differences. Tier mix, unclassified shares and Instagram overlap already differ by market, so growth is unlikely to be the same everywhere. [1]
Plan against a range, not a point. Use the scenarios to test how sensitive a plan is to creator supply, not to fix a target.
Do not budget on the 10% line. It is an illustration of fast growth, not an expected outcome.
Re-measure with the same rules. A 2027 count using this study’s eligibility criteria is the first step towards a measured growth rate. [1]
Separate coverage from growth. Ask whether a higher count comes from new creators or from more complete data before acting on it.
Review markets individually. Check each priority market against the scenario lines rather than relying on the regional total.
The 2027–2029 scenarios show how much the LATAM TikTok creator pool would change under different assumptions; they do not predict which will happen. Treat them as a planning range, re-measure with the same rules, and judge each market on its own data. [1]
Country headline counts equal their male, female and unclassified components. Every country's tier cells were compared with its gender totals: all are at or below them, and the regional tier gap is −28,165. Population fields were compared with the Instagram LATAM dataset: 19 of 20 match exactly; Bolivia's TikTok entry is ten times the Instagram value. [1, 2]
Profiles are not unique people, and country assignment does not establish follower location. The dataset contains no engagement or price data and no uncertainty intervals. Niche data cover eight markets (Brazil, Argentina, Mexico, Colombia, Chile, Venezuela, Paraguay and Uruguay, 74.5% of the eligible pool) and count niche tags, not unique profiles.
Reliable for what they measure, counts of eligible TikTok profiles by market. In all 20 markets the headline count equals its male, female and unclassified components, tier entries never exceed the headline count, and only 28,165 profiles (0.11%) sit outside the four follower tiers. The figures do not measure unique people, follower location, engagement or prices. [1]
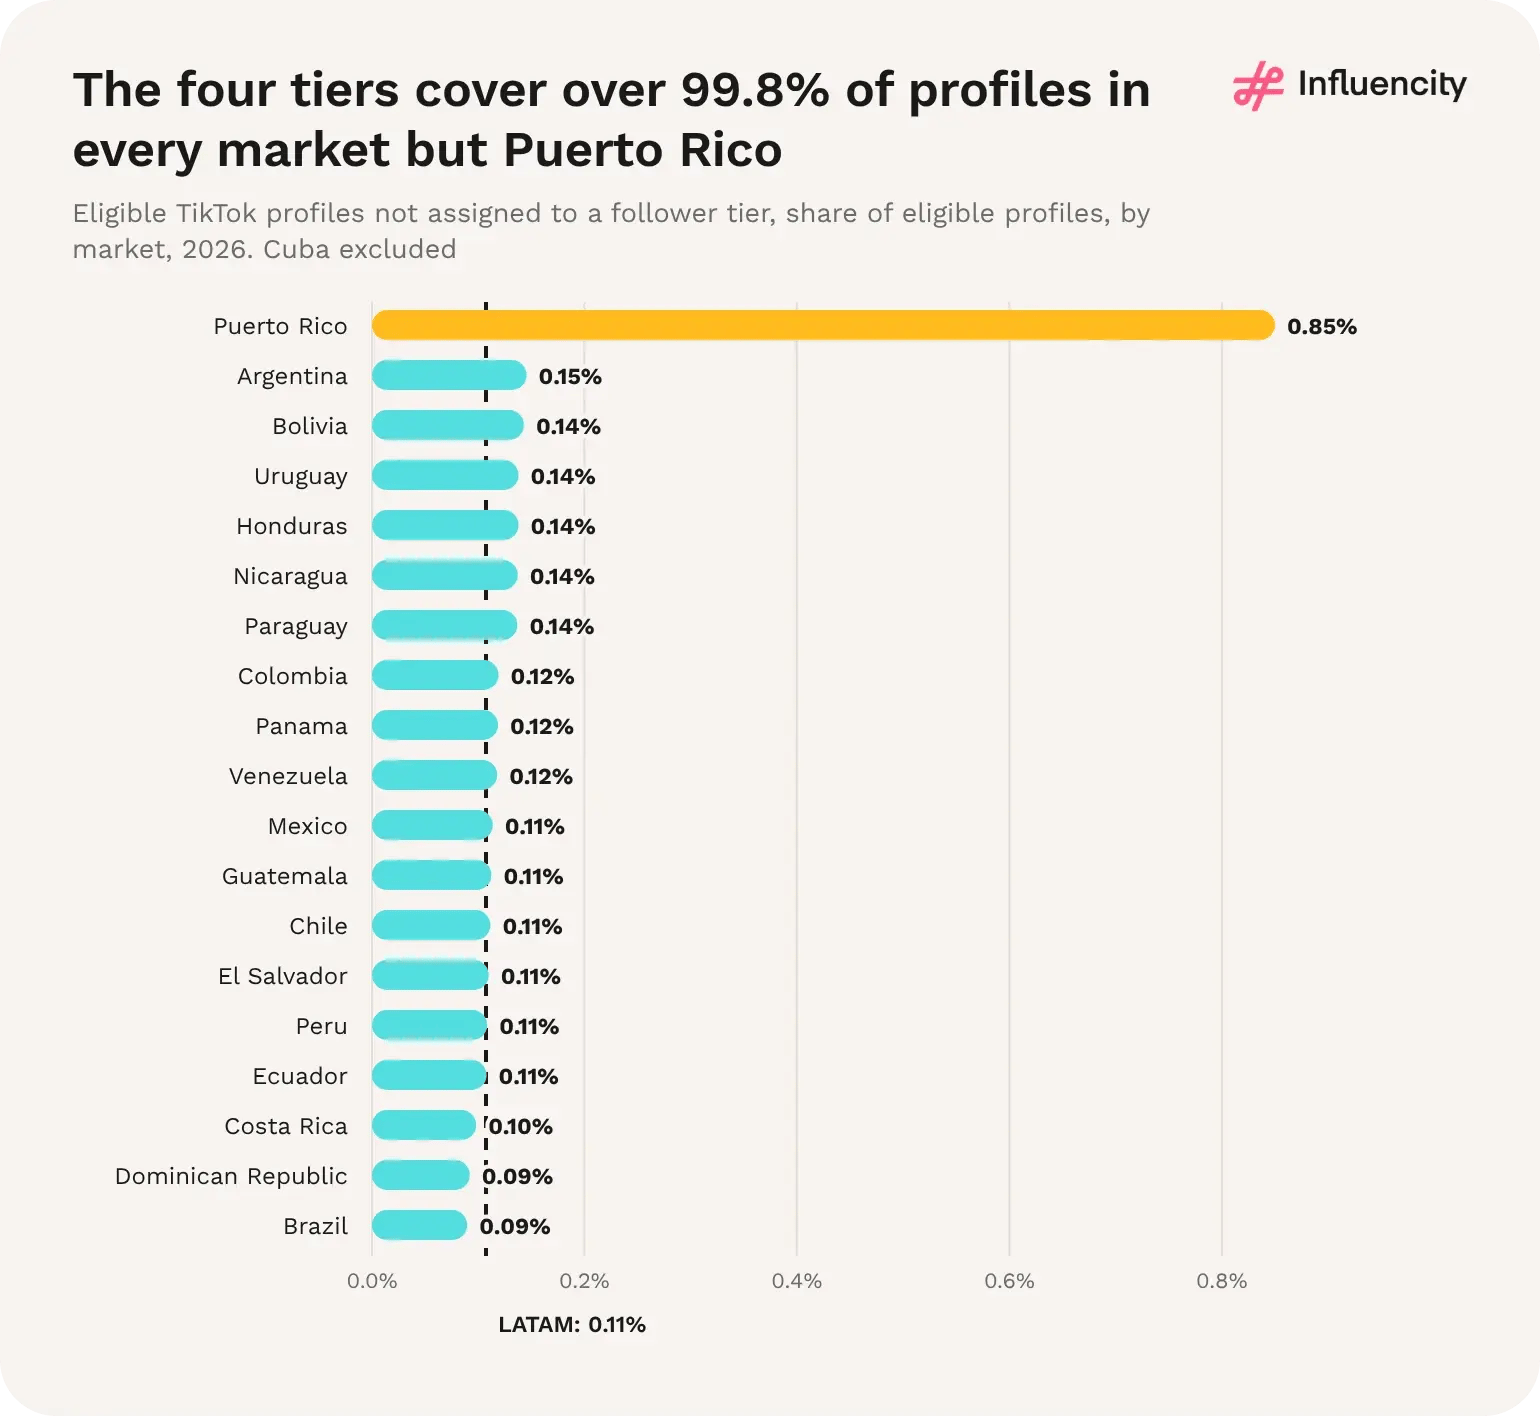
Figure 65 → Eligible TikTok profiles not assigned to a follower tier, as a share of eligible profiles, by market, 2026. Cuba excluded. Source: [1].
It cannot identify people, locate audiences or measure performance. One person can run several profiles, a market assignment does not show where followers live, and the dataset contains no engagement, reach, price or uncertainty fields. Instagram comparisons are not deduplicated, so a creator active on both platforms is counted on each. [1, 2]
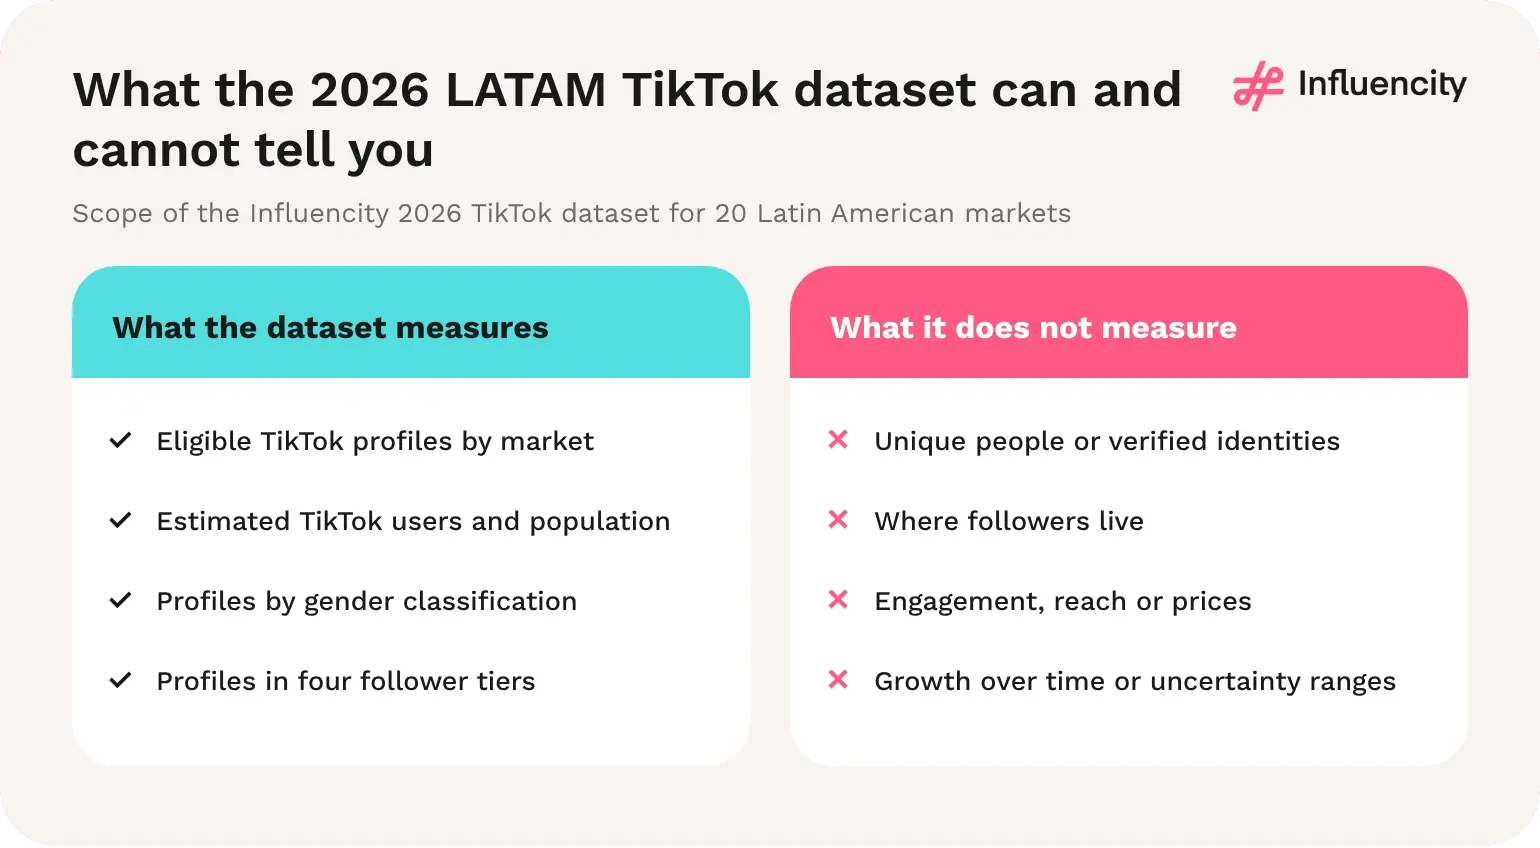
Figure 66 → Scope of Influencity’s 2026 TikTok dataset for 20 Latin American markets. Source: [1].
Coverage: 26,226,153 eligible TikTok profiles across 20 Latin American markets, collected in October and November 2026 (Influencity). [1]
Consistency: headline counts match their gender components in 20 of 20 markets; 99.89% of eligible profiles are assigned to a follower tier. [1]
Classification: 15.0% of eligible profiles have no gender classification and are retained as unclassified rather than reallocated. [1]

How many TikTok influencers are there in Latin America in 2026?
Influencity's 2026 dataset records 26,226,153 influencer-eligible TikTok profiles across 20 Latin American markets, approximately 26.2 million. [1]

How many TikTok users are included in the dataset?
An estimated 431,043,500 TikTok users across the 20 markets. This is an audience-estimate field, not verified monthly active users. [1]

What is the creator-to-user ratio?
6.08%: 26,226,153 profiles divided by 431,043,500 estimated users. Excluding Brazil, it is 5.41%. [1]

Which markets stand out most?
By absolute supply, Brazil (9.98M) and Mexico (3.79M). By creator density, Paraguay (11.14%), the Dominican Republic (9.96%) and Ecuador (9.14%). By estimated penetration, Ecuador (85.1%) and Peru (82.7%). [1]

Does TikTok have more creators than Instagram in LATAM?
Yes: 26.23M against 18.41M (42.4% more), and more in 16 of the 19 markets with comparable data. Brazil, Argentina and Puerto Rico have more Instagram than TikTok profiles; Cuba is a data gap. TikTok's density is only 1.07 times Instagram's. [1, 2]

How does LATAM TikTok compare with the US and Europe?
LATAM has the largest pool (26.23M vs 14.47M US and 21.40M Europe) and audience (431.0M), but the lowest creator density (6.08% vs 9.46% and 8.48%). [1, 4, 5]

Are most LATAM TikTok influencers women?
Female-classified profiles are 65.9% of classified profiles and 56.0% of all profiles; 15.0% are unclassified. Every market has a female majority. [1]

What share of LATAM TikTok creators are nano-influencers?
Nano entries are 88.7% of tier records; the four tiers total 28,165 fewer entries than the headline. [1]

Is TikTok the right platform for Mexico?
On recorded supply, Mexico has 3.66 times as many TikTok as Instagram creators, and Influencity's 2025 supplements study described Mexican engagement as TikTok-led. Test both platforms against the campaign objective. [1, 2, 8]

Does higher creator density mean better campaign performance?
No. Density describes recorded creator supply relative to estimated users. It does not measure audience relevance, availability, pricing, engagement or sales.

What are the key LATAM TikTok influencer statistics for 2026?
Influencity's 2026 data, collected in October–November 2026, record 26.2 million influencer-eligible TikTok profiles and 431.0 million estimated TikTok users across 20 Latin American markets. That is a creator density of 6.08%. Of gender-classified profiles, 65.9% are female; 88.7% of follower-tier records are nano, and 2.96 million have 10,000 or more followers. [1]
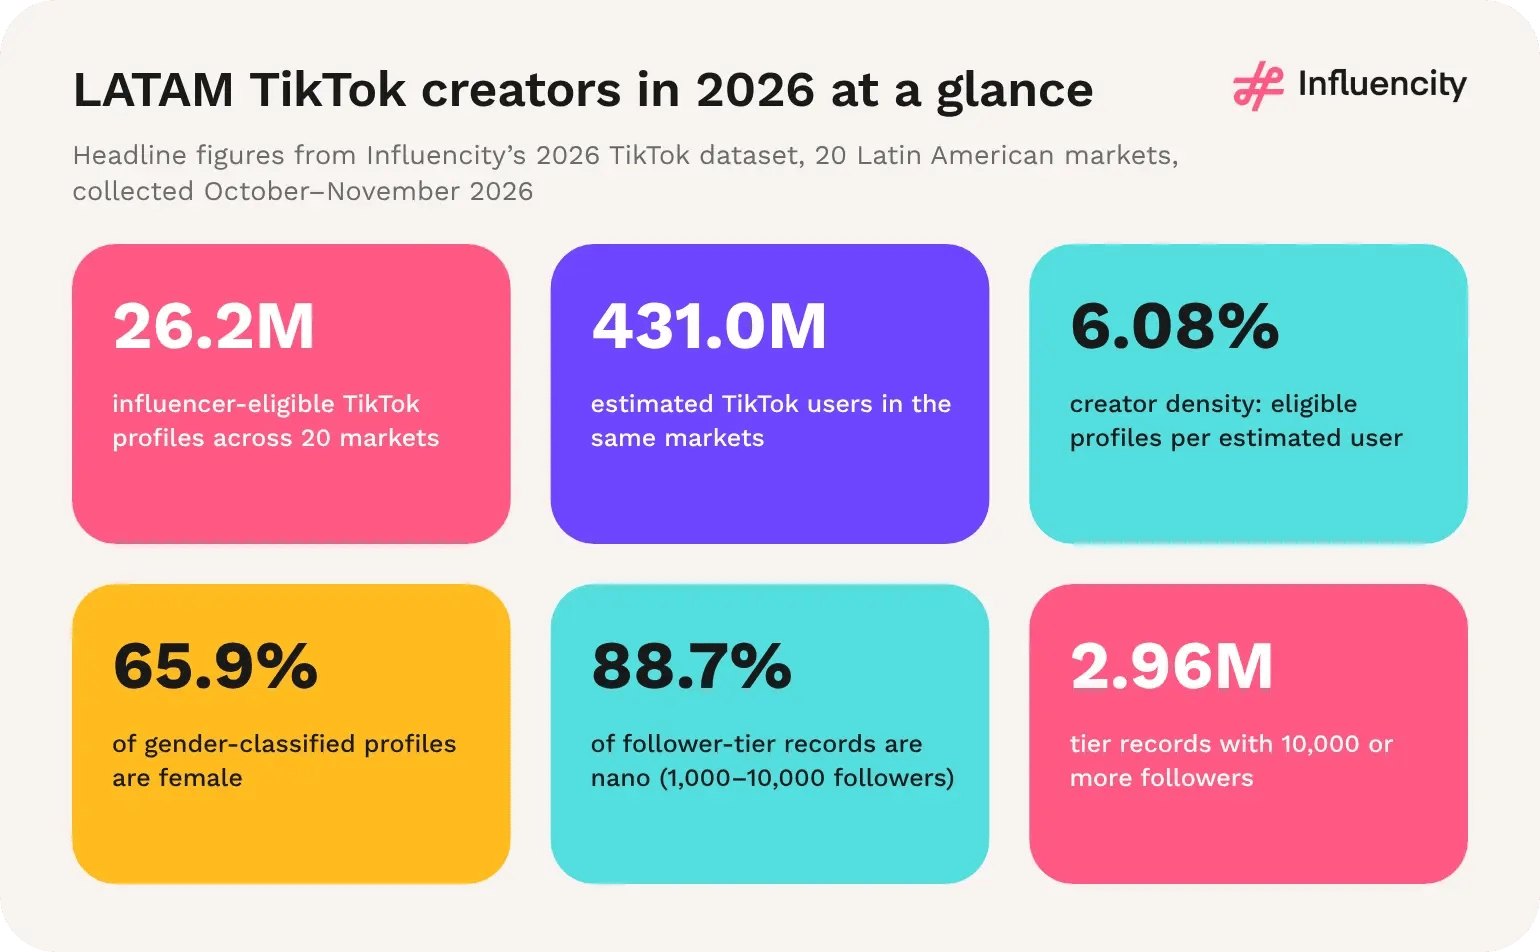
Figure 67 → Headline figures from Influencity’s 2026 TikTok dataset, 20 Latin American markets, collected October–November 2026. Source: [1].

How many TikTok influencers are there in Brazil?
Brazil has 9,980,579 eligible TikTok profiles, 38.1% of the LATAM pool and the largest single market. It is one of the two large markets, with Argentina, where Instagram records more eligible profiles than TikTok: 0.82 TikTok profiles for every Instagram profile. [1, 2]

How many TikTok influencers are there in Mexico?
Mexico has 3,793,376 eligible TikTok profiles, 14.5% of the LATAM pool. It holds 23.0% of the region's estimated TikTok users, so its creator density is lower (3.83%), but it records 3.66 TikTok profiles for every Instagram profile and 14.4% of its tier records have 10,000+ followers. [1, 2]
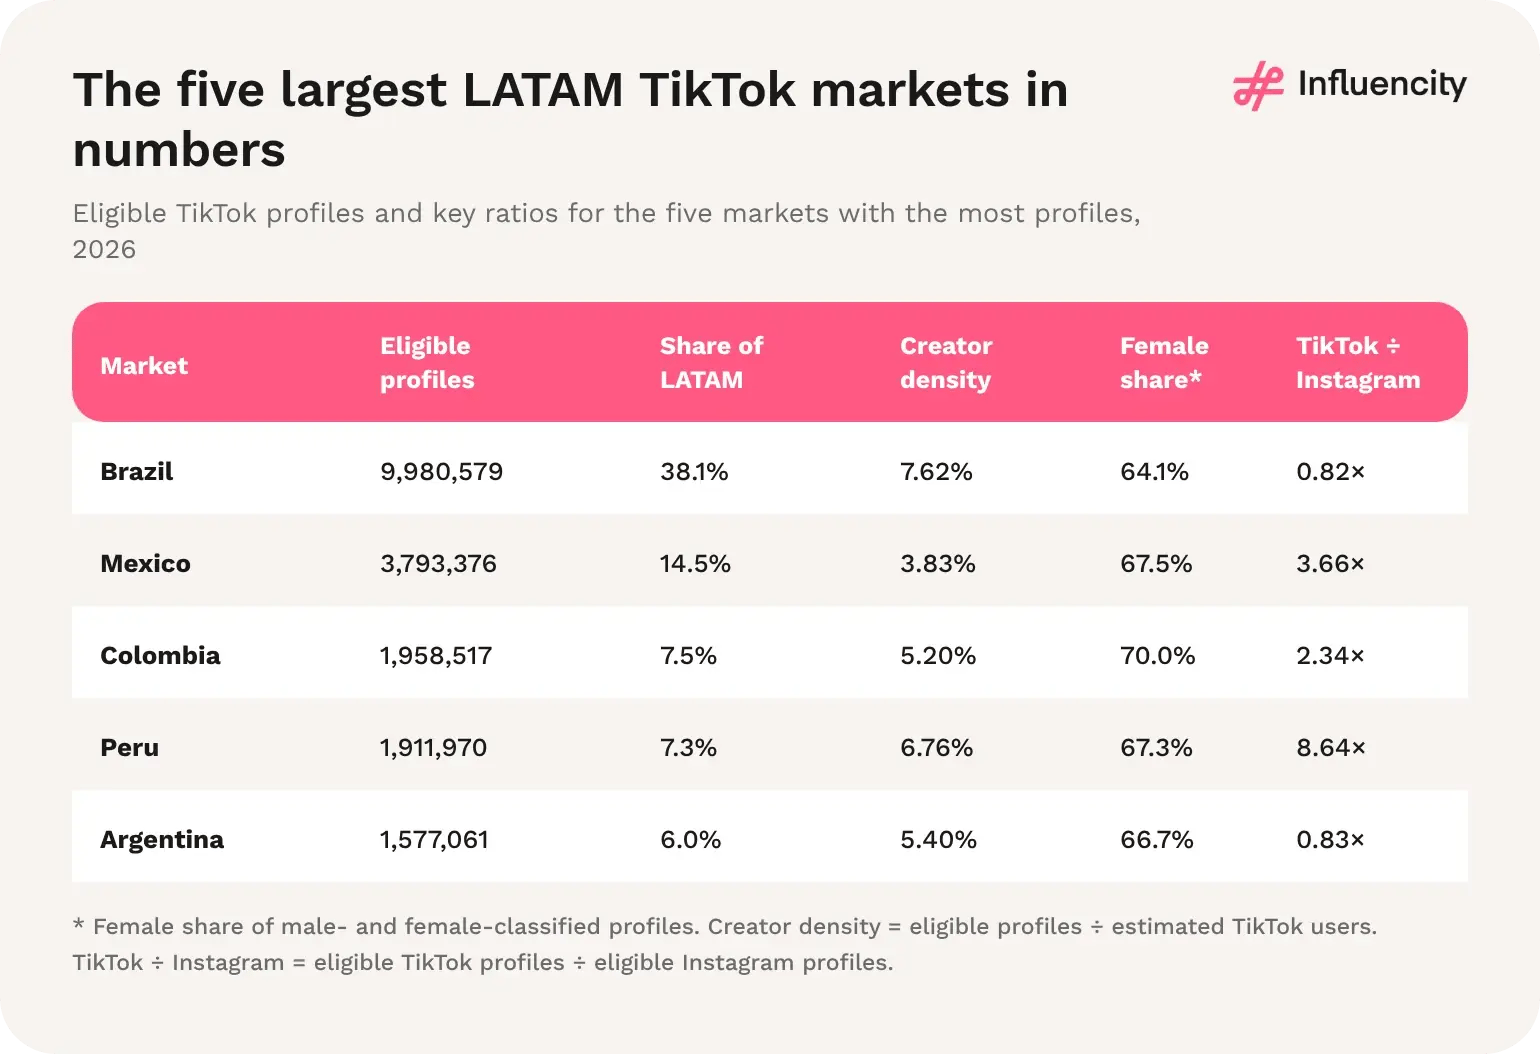
Figure 68 → Eligible TikTok profiles and key ratios for the five markets with the most profiles, 2026. Sources: [1, 2].

How many LATAM TikTok influencers have more than 10,000 followers?
About 2.96 million: 2,963,133 micro, macro and mega tier records, 11.3% of all tier records. Of these, 268,673 are macro (100,000 to 1 million followers) and 16,584 are mega (1 million or more). [1]

How are nano, micro, macro and mega TikTok influencers defined in this study?
By follower count: nano 1,000–10,000, micro 10,000–100,000, macro 100,000–1 million and mega 1 million or more. Nano records make up 88.7% of the LATAM total, micro 10.2%, macro 1.0% and mega 0.06%. [1]
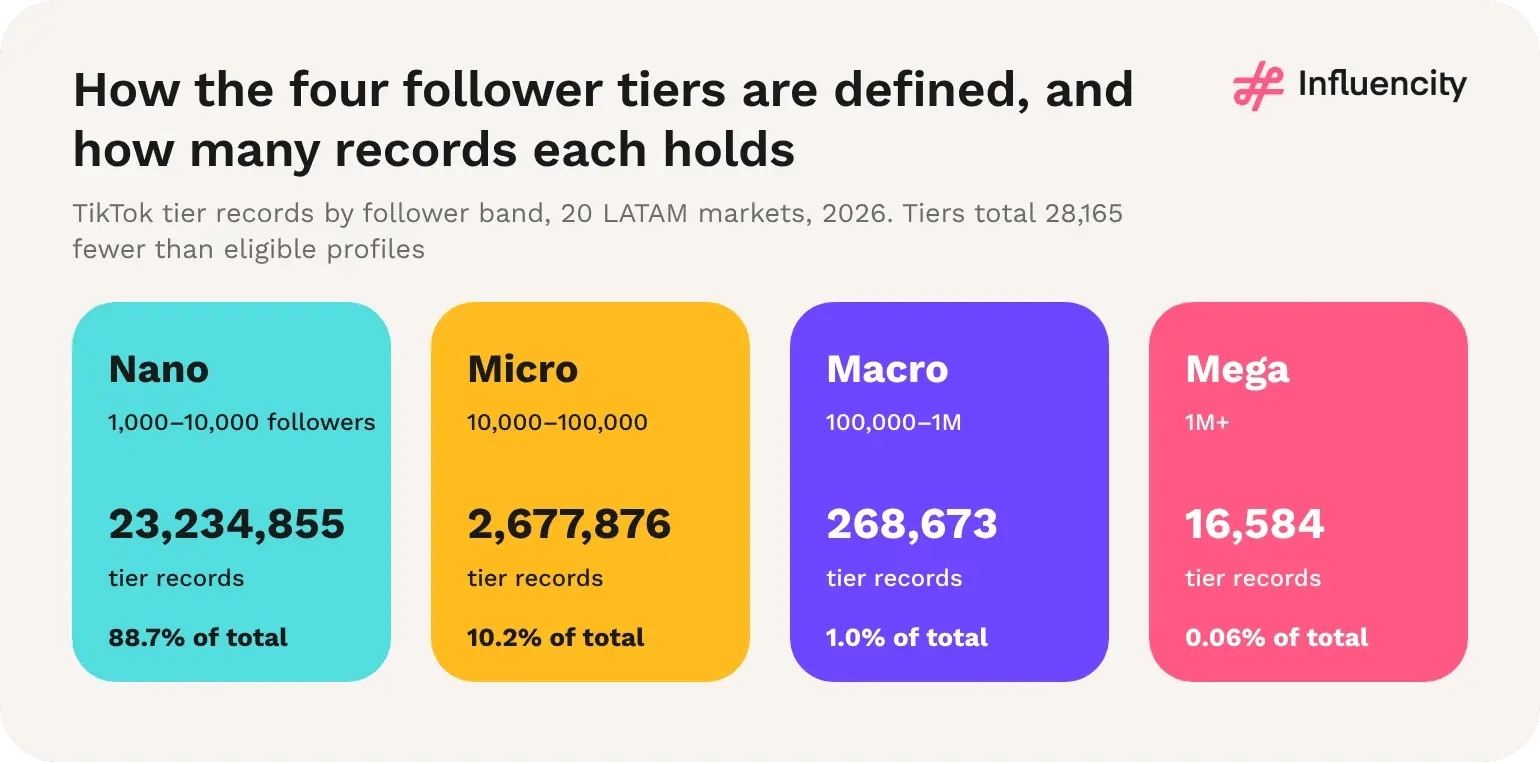
Figure 69 → TikTok tier records by follower band, 20 LATAM markets, 2026. Source: [1].

How many TikTok influencers could Latin America have by 2029?
It depends on the growth rate assumed. Illustrative scenarios give 26.2 million (flat), 30.4 million (5% a year) or 34.9 million (10% a year) eligible profiles by 2029. These are not forecasts, because no comparable earlier LATAM TikTok count exists yet. [1]

How complete is the gender data?
Mostly complete, with gaps that vary by market. 15.0% of eligible profiles have no gender classification, from 8.3% in Nicaragua to 19.5% in Chile. Unclassified profiles are kept as a separate group and are not a measure of non-binary identity. [1]

How should brands measure TikTok influencer campaigns in Latin America?
In layers and market by market: exposure, resonance, trust and compliance, traffic and sales, and reuse. Influencity's 2025 supplements study, covering the US and Mexico, found that clearly disclosed posts performed 12% better on long-term engagement, so reporting should extend beyond launch week. [8]