


Europe is not one creator market. A country can have a large Instagram audience without a proportionately large creator pool, while a smaller market can have high creator density without enough relevant profiles for a large campaign. This study separates absolute supply, creator density and estimated audience penetration, compares the region with the United States, maps six creator niches in the six largest markets, and draws on two other Influencity studies for evidence on creator performance.
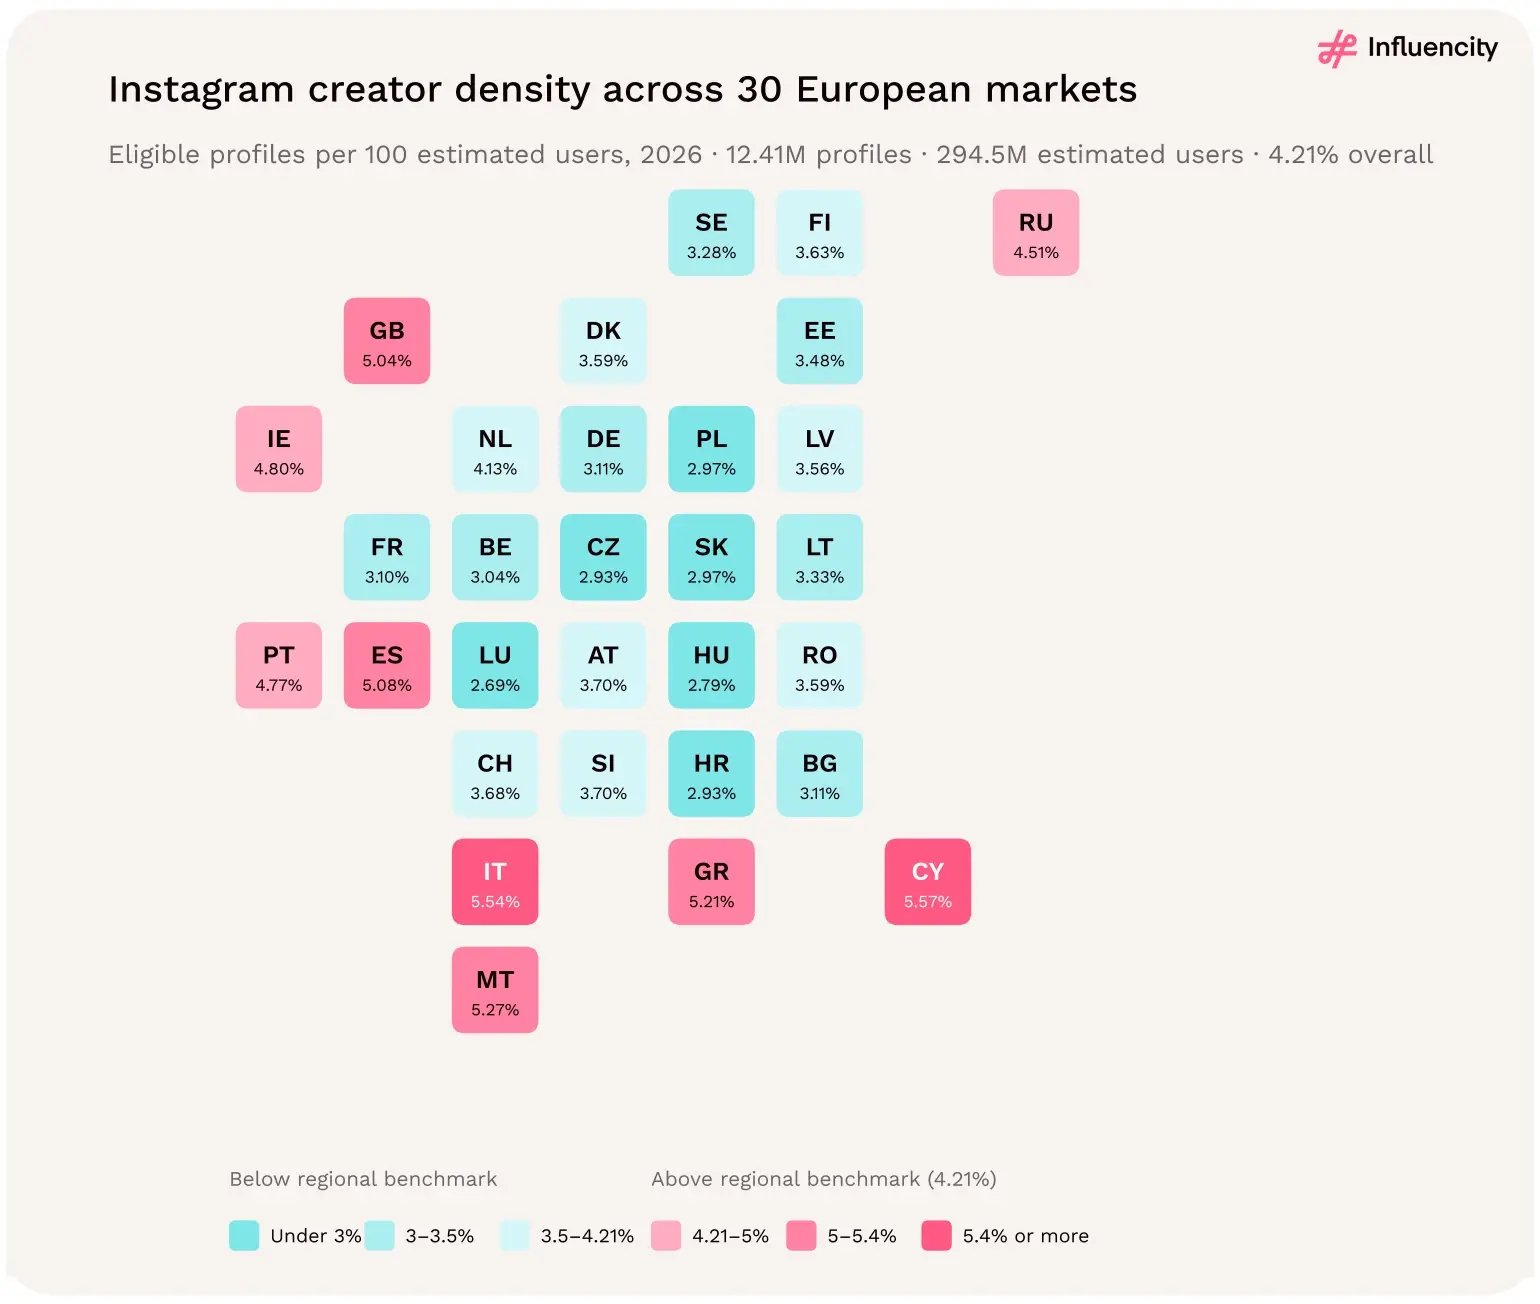
Figure 01 → Instagram creator density across the 30-market study footprint, 2026. Counts refer to profiles, not unique people. Markets outside the footprint are not shown, not zero. Source: [1].
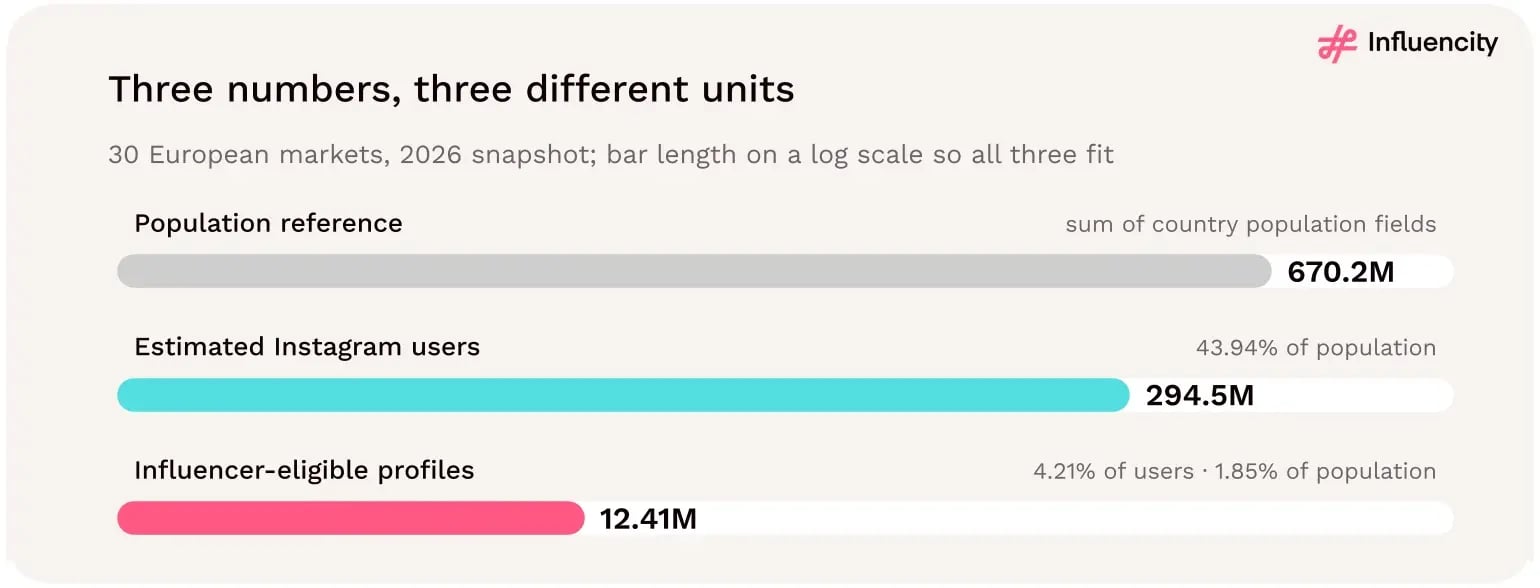
Figure 02 → Influencity 2026 Instagram Europe dataset, 30 markets, point-in-time 2026 snapshot. Source: [1].
How many profiles can we potentially discover? Start with the absolute eligible-profile count.
How large is that pool relative to Instagram audience estimates? Use creator density.
How large is the estimated Instagram audience relative to population? Use audience penetration.
The regional ratios are weighted, summed eligible profiles divided by summed users, or summed users divided by summed population. They are not simple averages of the 30 country percentages, which prevents small markets from carrying the same weight as much larger markets.
The difference is material. The simple average of the 30 country densities is 3.84%, against the weighted regional figure of 4.21%, because several of the largest markets are also among the most creator-dense.
Seven in ten eligible profiles are in five markets. Russia (23.2%), the United Kingdom (14.4%), Italy (13.4%), Spain (10.8%) and Germany (7.8%) together hold 69.6% of the 12,407,130 eligible profiles. The same five markets account for 63.5% of estimated Instagram users and 60.2% of the population reference.
At the other end, the 15 smallest markets by profile count hold 6.7% of the regional pool combined. Russia alone (2,880,629 profiles) records more eligible profiles than Germany, France and Poland put together (2,214,881).
Influencer discovery at scale is easiest in a handful of markets. However, a regional roster built only by volume will be dominated by those five markets, so pan-European campaigns need country quotas if smaller markets matter commercially.
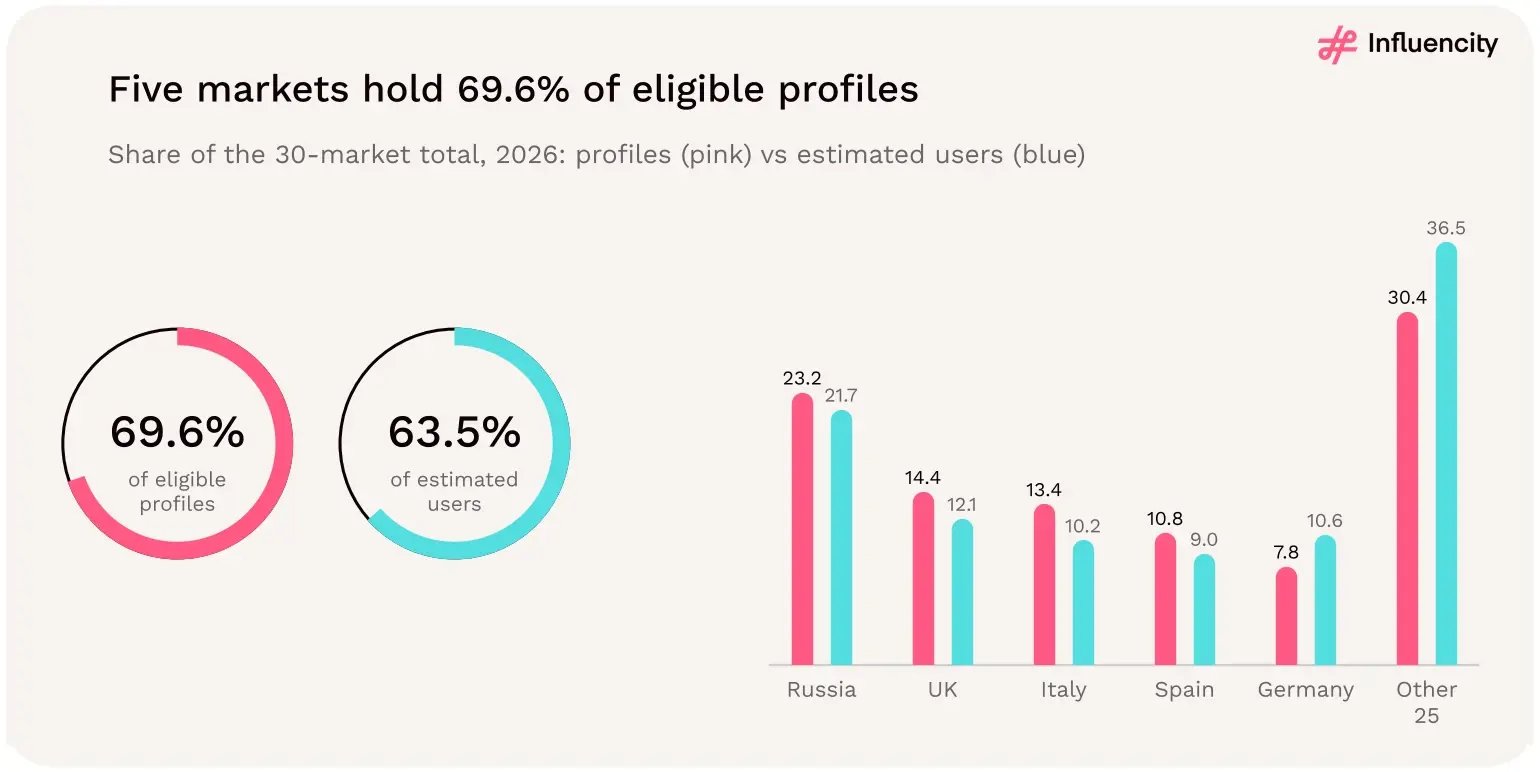
Figure 03 → Five markets hold 69.6% of eligible profiles. Source: [1].
Markets where more of the population uses Instagram also tend to have denser creator pools. Across the 30 markets, the users-to-population ratio and creator density have a Spearman rank correlation of 0.67. Portugal has the highest estimated adoption at 61.1%, and its density is 4.77%. Bulgaria (29.2%) and Hungary (29.7%) have the lowest adoption, with densities of 3.11% and 2.79%.
Market size itself shows almost no relationship with density: the rank correlation between estimated users and density is 0.16.
Reading the study. This is an association across 30 snapshots. It does not show that adoption causes creator supply. Shared factors such as language, platform history and how the user estimates are compiled could drive both.
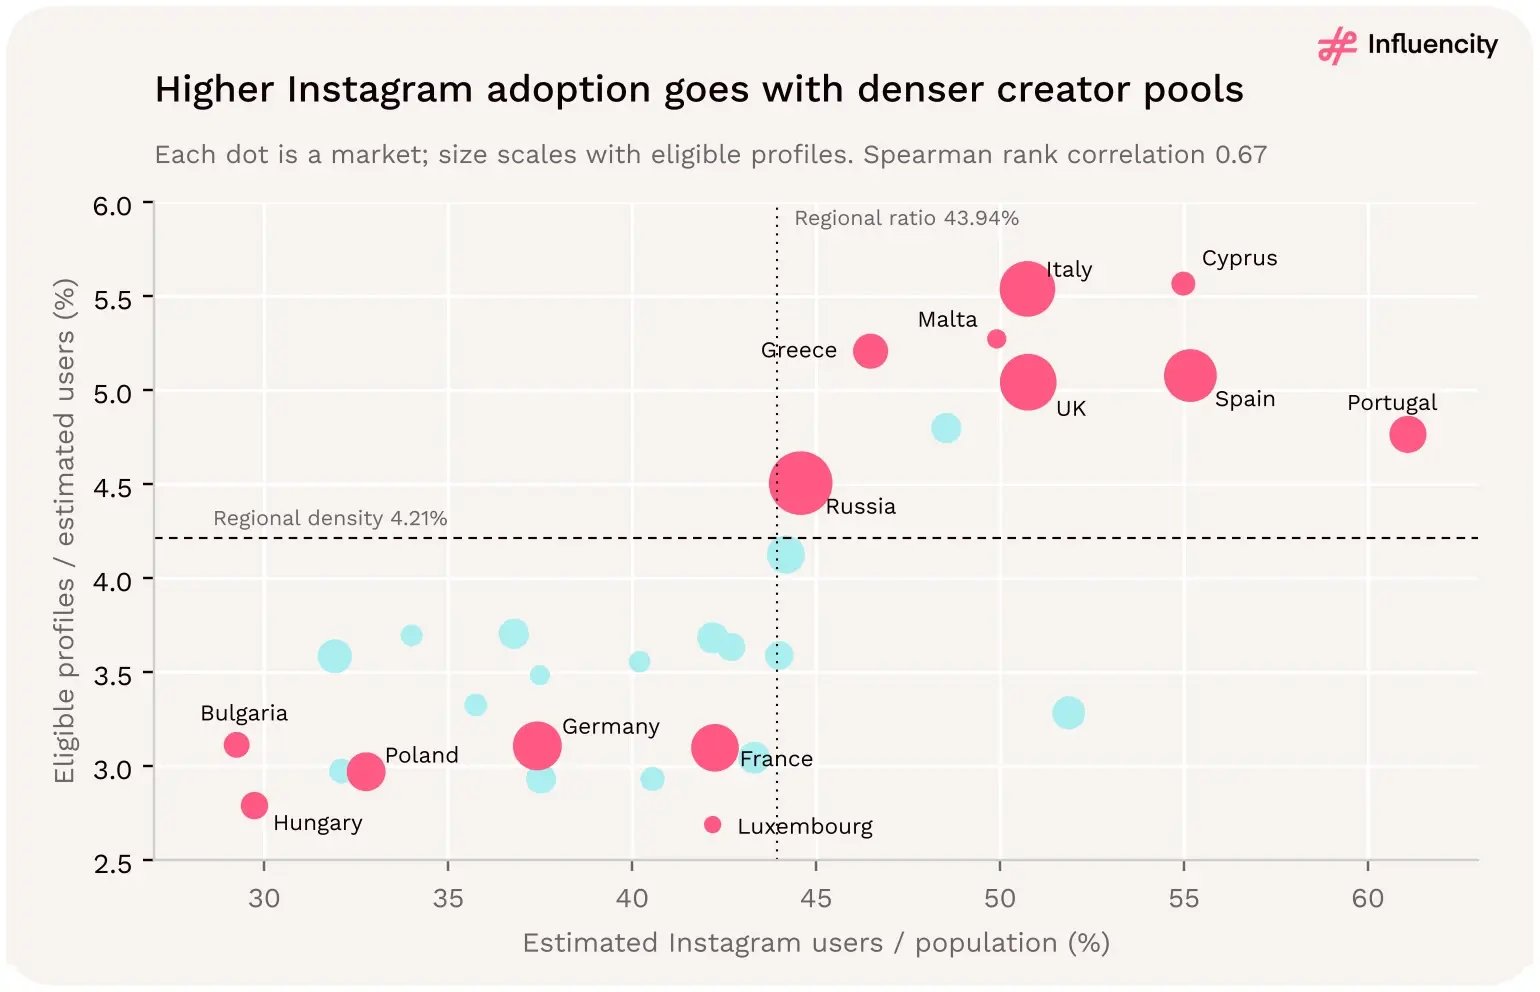
Figure 04 → Higher Instagram adoption goes with denser creator pools. Source: [1].
Italy and Spain produce far more eligible profiles than Germany and France from similar or smaller audiences. Spain has 4.9M fewer estimated users than Germany but 367,908 more eligible profiles.
Taken as pairs, Italy and Spain hold 24.2% of the regional profile pool with 19.1% of users. Germany and France hold 14.9% of profiles despite 20.2% of users and 22.4% of the population reference.
Teams that allocate influencer budgets by country population or ad-market size would under-weight Southern Europe’s creator supply. This is not evidence that these creators perform better. It only shows that more of them pass the eligibility threshold.
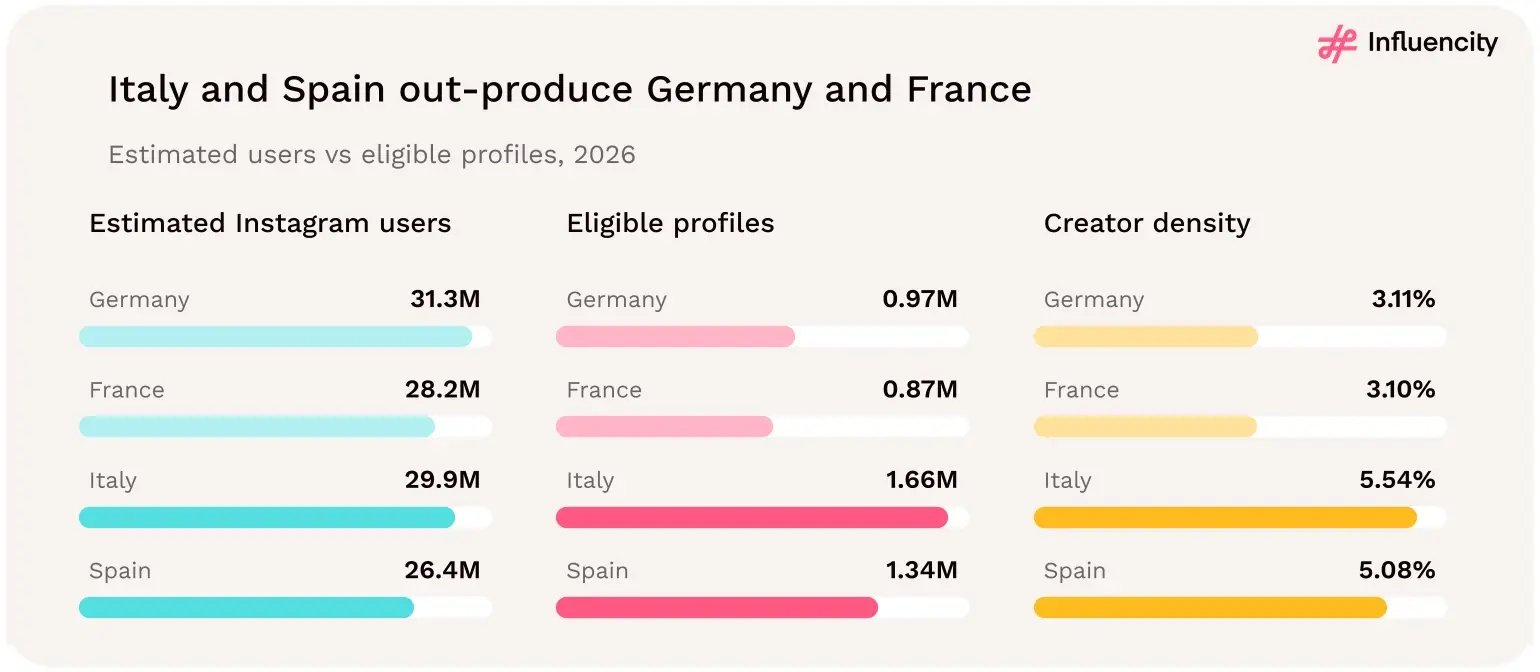
Figure 05 → Italy and Spain out-produce Germany and France. Source: [1].
21 of 30 markets fall below the regional creator density. Nine markets are above 4.21%:
The lowest densities are in Central Europe and Luxembourg: Luxembourg 2.69%, Hungary 2.79%, Croatia and the Czech Republic 2.93%, and Poland 2.97%. Measured per resident, the gap widens. Cyprus records 30.6 eligible profiles per 1,000 residents and Hungary 8.3, a 3.7-fold difference.
Europe has 4.21% creator density, but this describes the pooled region, not the market most brands will plan for. Use country figures when sizing a local influencer roster.
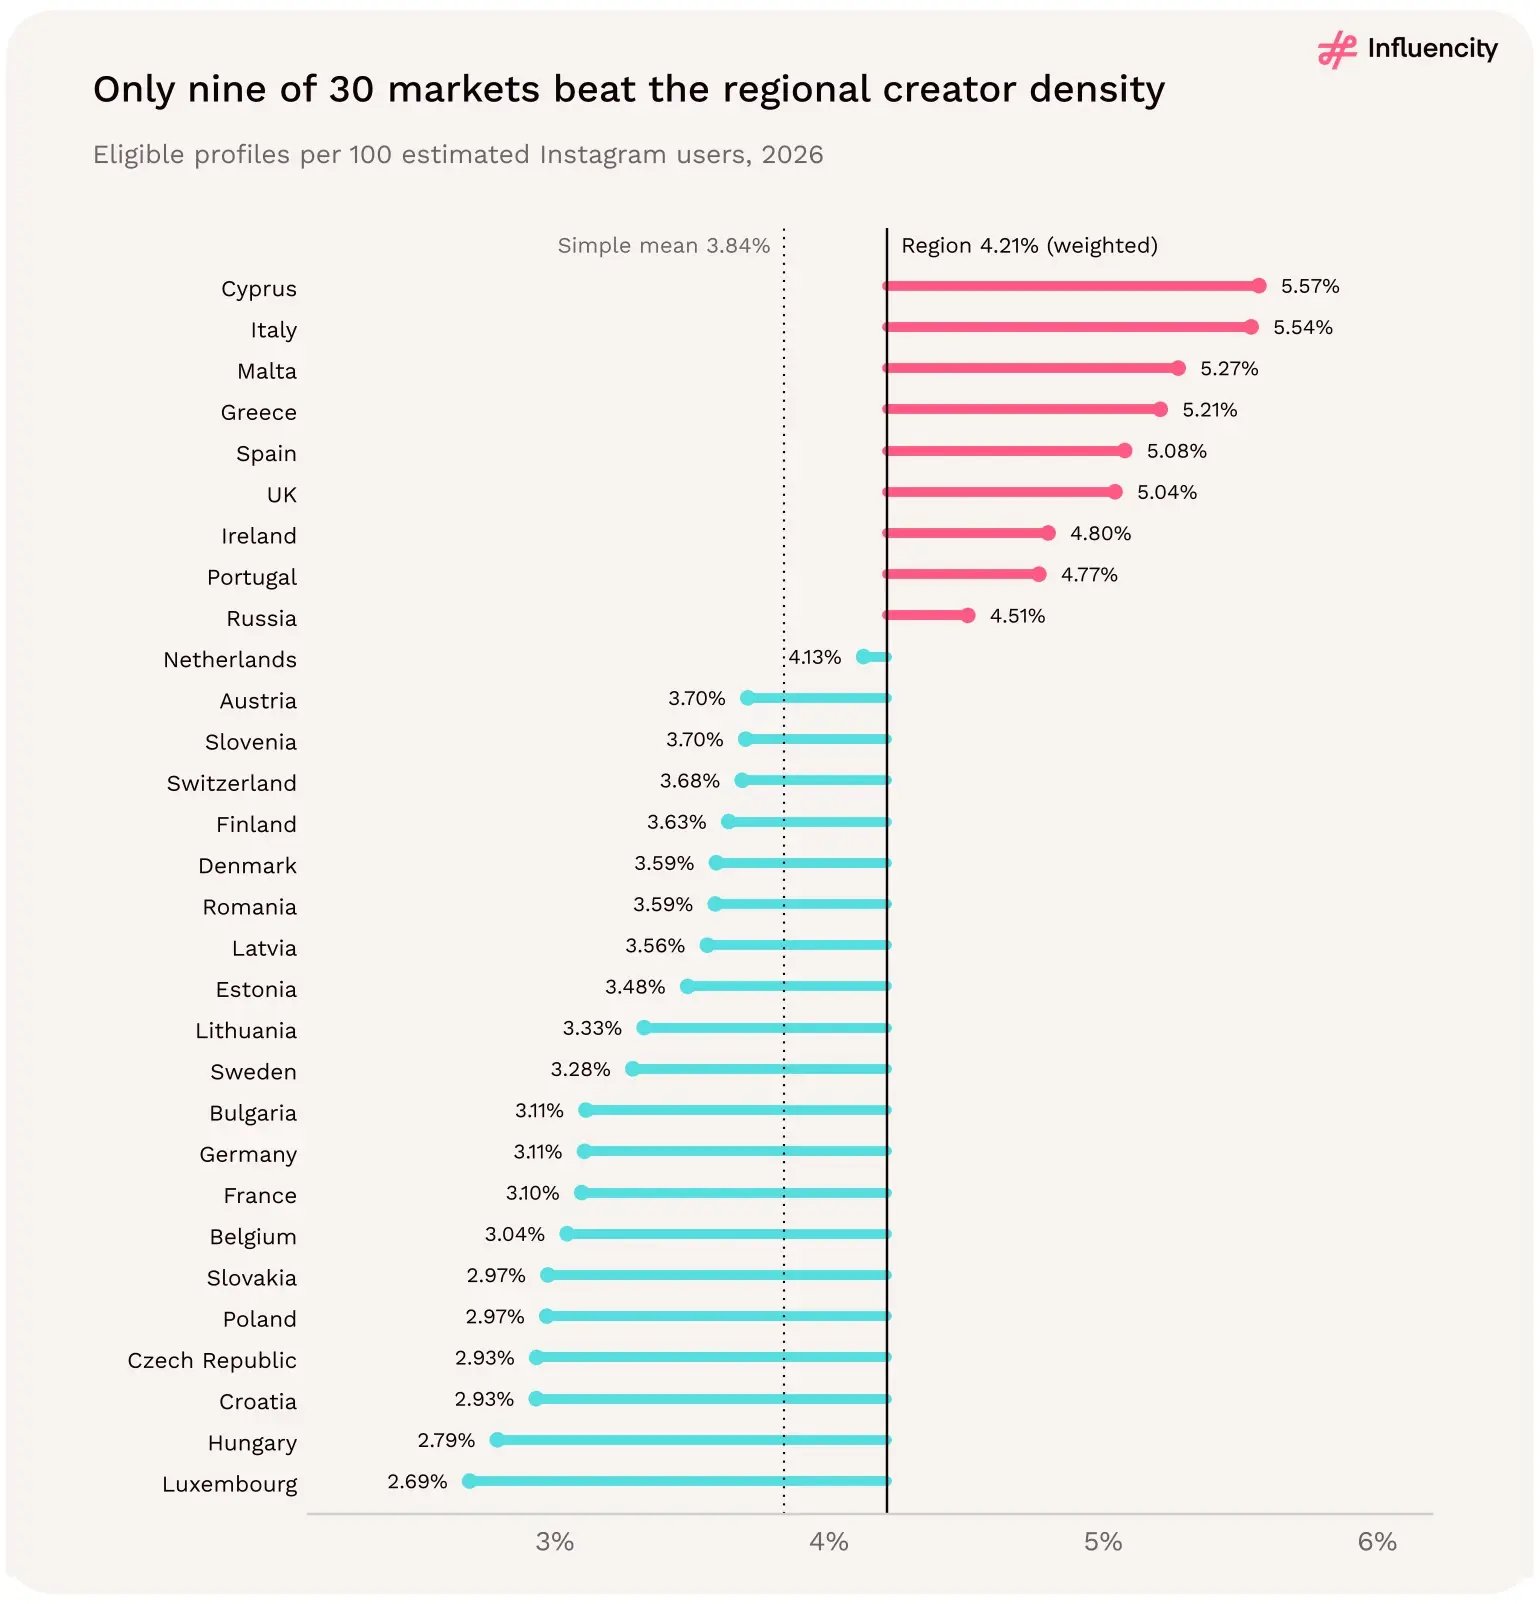
Figure 06 → Only nine of 30 markets beat the regional creator density. Source: [1].
Excluding Russia barely changes the size ratios, but it materially changes the gender split. Russia accounts for 23.2% of eligible profiles and 21.7% of estimated users. Removing it moves the headline ratios as follows:
The female share moves because 71.2% of Russia’s classified profiles are female. Russia alone holds 26.2% of all female-classified profiles in the dataset.
Russian authorities blocked Facebook and Instagram in 2022, and the platforms can now be reached in Russia only through a VPN. Russia also added Meta to its list of terrorist and extremist organizations in October 2022. [10] The block did not end Russian creator activity on Instagram:
The space for that commercial activity has since narrowed:
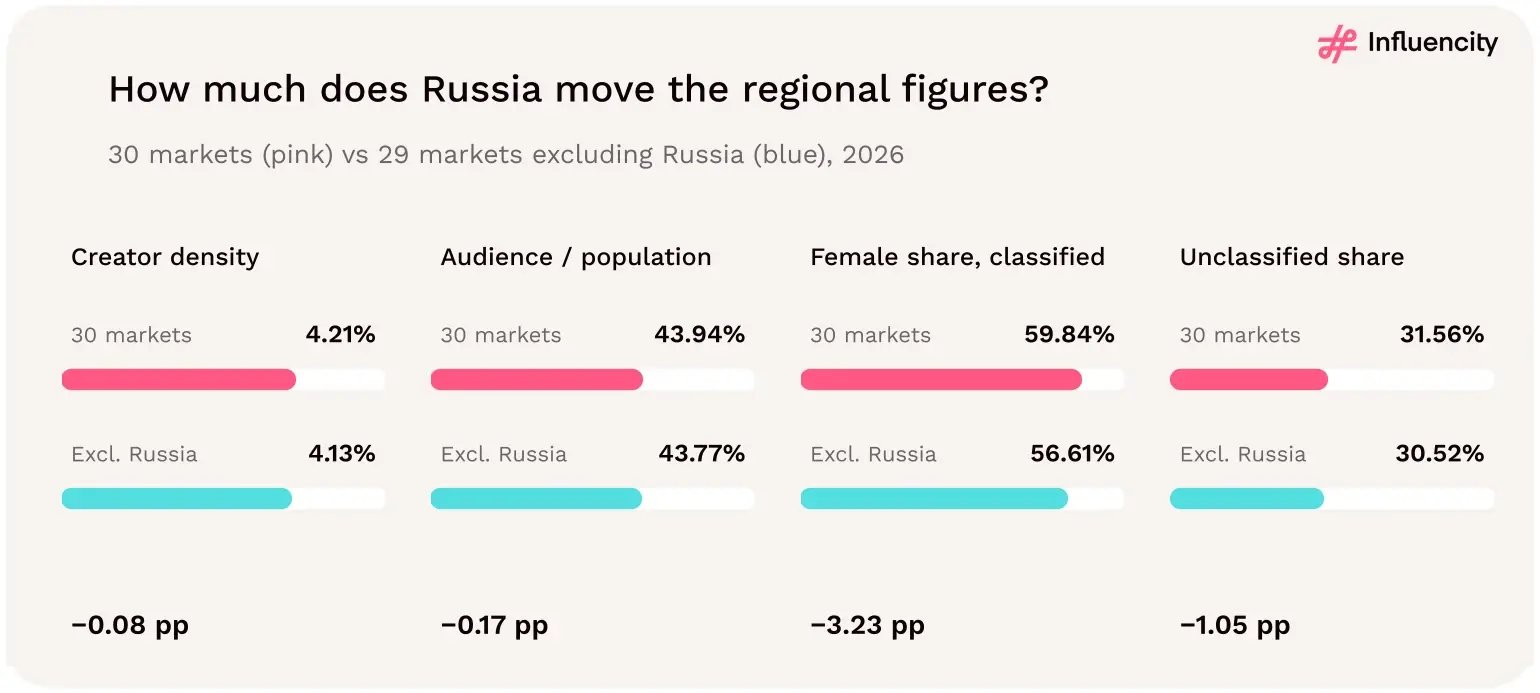
Figure 07 → How much does Russia move the regional figures? Source: [1].
What this means for campaign planning. Size by country, not region. Separate audience reach from creator supply. Germany and France have large estimated audiences but comparatively thin eligible pools. Italy and Spain show the reverse.
Treat the larger supply as a hypothesis to test. Higher-density markets offer more candidates to vet.
The top six markets contain 76.7% of recorded creators and 73.1% of estimated users. Concentration increases to 86.7% of creator supply across the top ten. The remaining 20 markets still contain 1,645,548 profiles, so a smaller share of the regional total should not be mistaken for an insignificant local opportunity. [1]
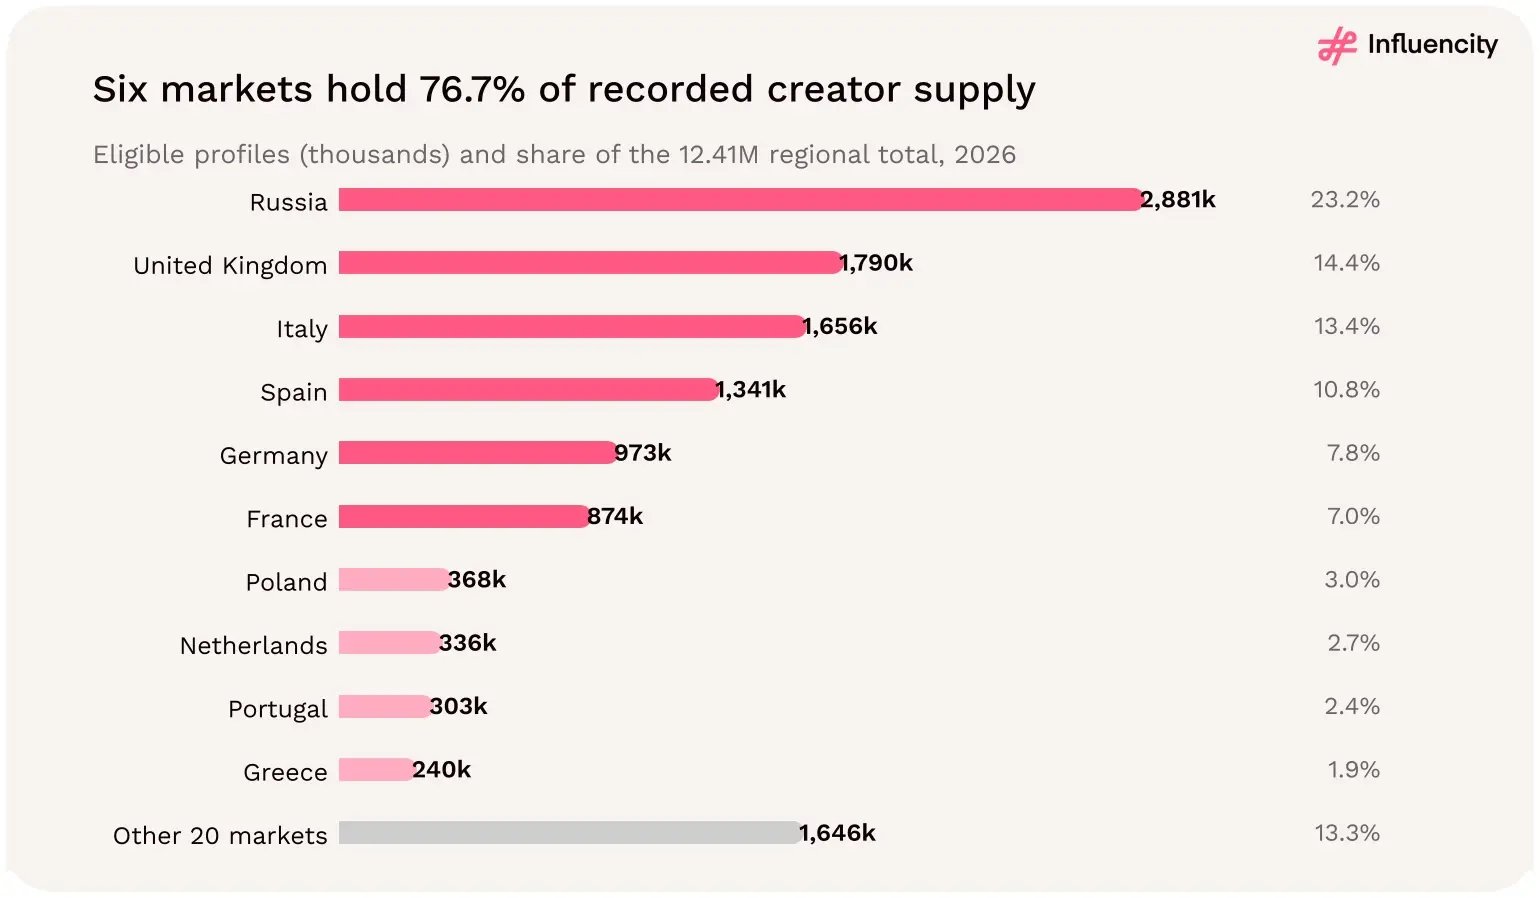
Figure 08 → Largest recorded Instagram creator pools in the European study footprint, with the other 20 markets combined. Source: [1].
Three markets hold half of all eligible profiles and six hold three quarters. On a standard concentration measure (Herfindahl–Hirschman index of 1,192), the 30-market pool behaves like about 8.4 equal-sized markets. [1]
Russia is not the only reason. Without it, the United Kingdom leads the remaining 29 markets with 18.8% of profiles. It is followed by Italy (17.4%), Spain (14.1%), Germany (10.2%) and France (9.2%). Those five still hold 69.6% of the reduced pool. [1]
The two curves in Figure 09 track each other closely: markets that rank high for creators also rank high for audience. Their ranks have a rank correlation of 0.99. The creator curve sits slightly above the audience curve, so creator supply is a little more concentrated than estimated users. [1]
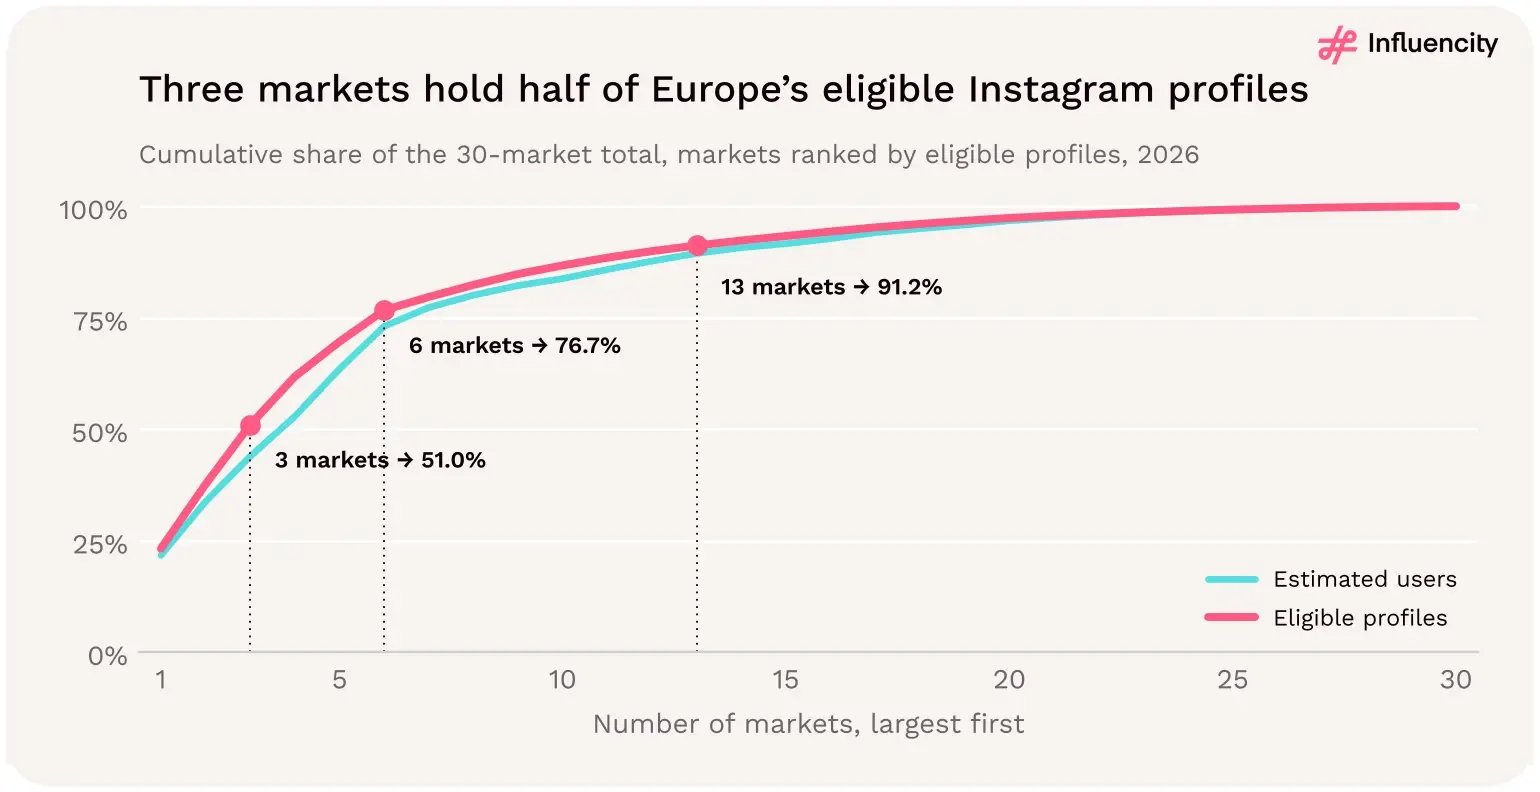
Figure 09 → Three markets hold half of Europe’s eligible Instagram profiles; 13 are needed to pass 90%. Cumulative shares, markets ranked by eligible profiles. Source: [1].
Broadly yes, but not in proportion. Dividing each market’s share of profiles by its share of estimated users shows which markets produce more creators than their audience size would predict. [1]
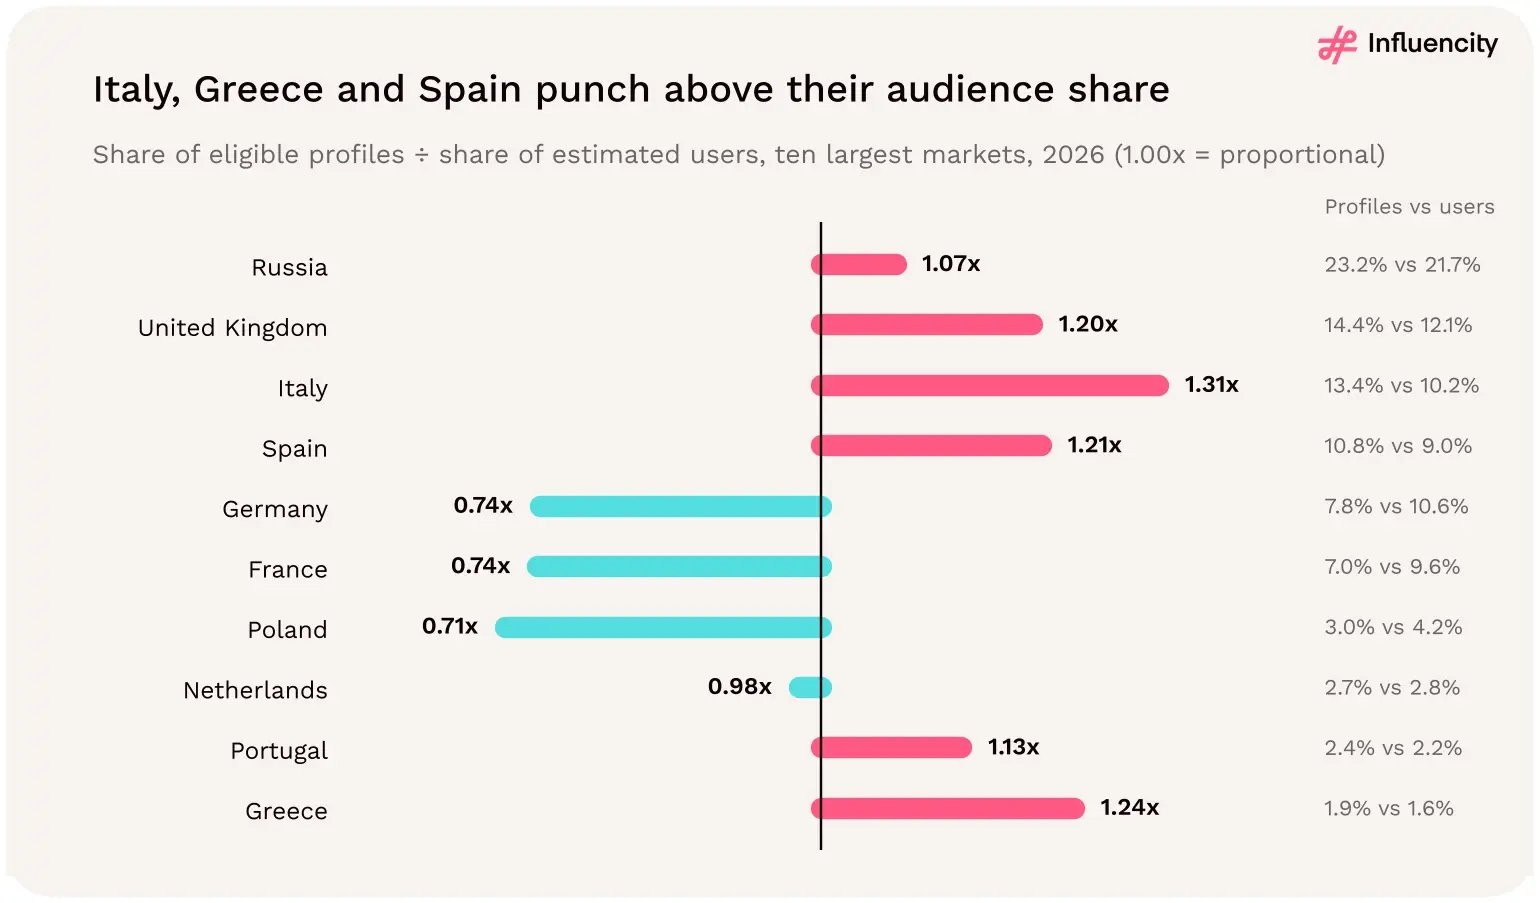
Figure 10 → Italy, Greece and Spain punch above their audience share. Share of eligible profiles ÷ share of estimated users, ten largest markets. Source: [1].
France and Germany, relative to their size. Across the 30 markets, 12.7% of eligible profiles (1,569,923) have 10,000 or more followers. France has the highest share at 17.0%, and Germany has 15.6%. Italy (10.5%) and Greece (10.2%) have the lowest shares among the ten largest markets. [1]
This reverses the density ranking. Among the ten largest markets, higher creator density goes with a lower share of established creators (rank correlation −0.84, across ten markets). The consequence for campaign planning:
The largest tiers are slightly more concentrated than the pool as a whole. The top six markets hold 76.8% of all 10K+ profiles and 80.3% of 100K+ profiles, compared with 76.7% of all eligible profiles. [1]
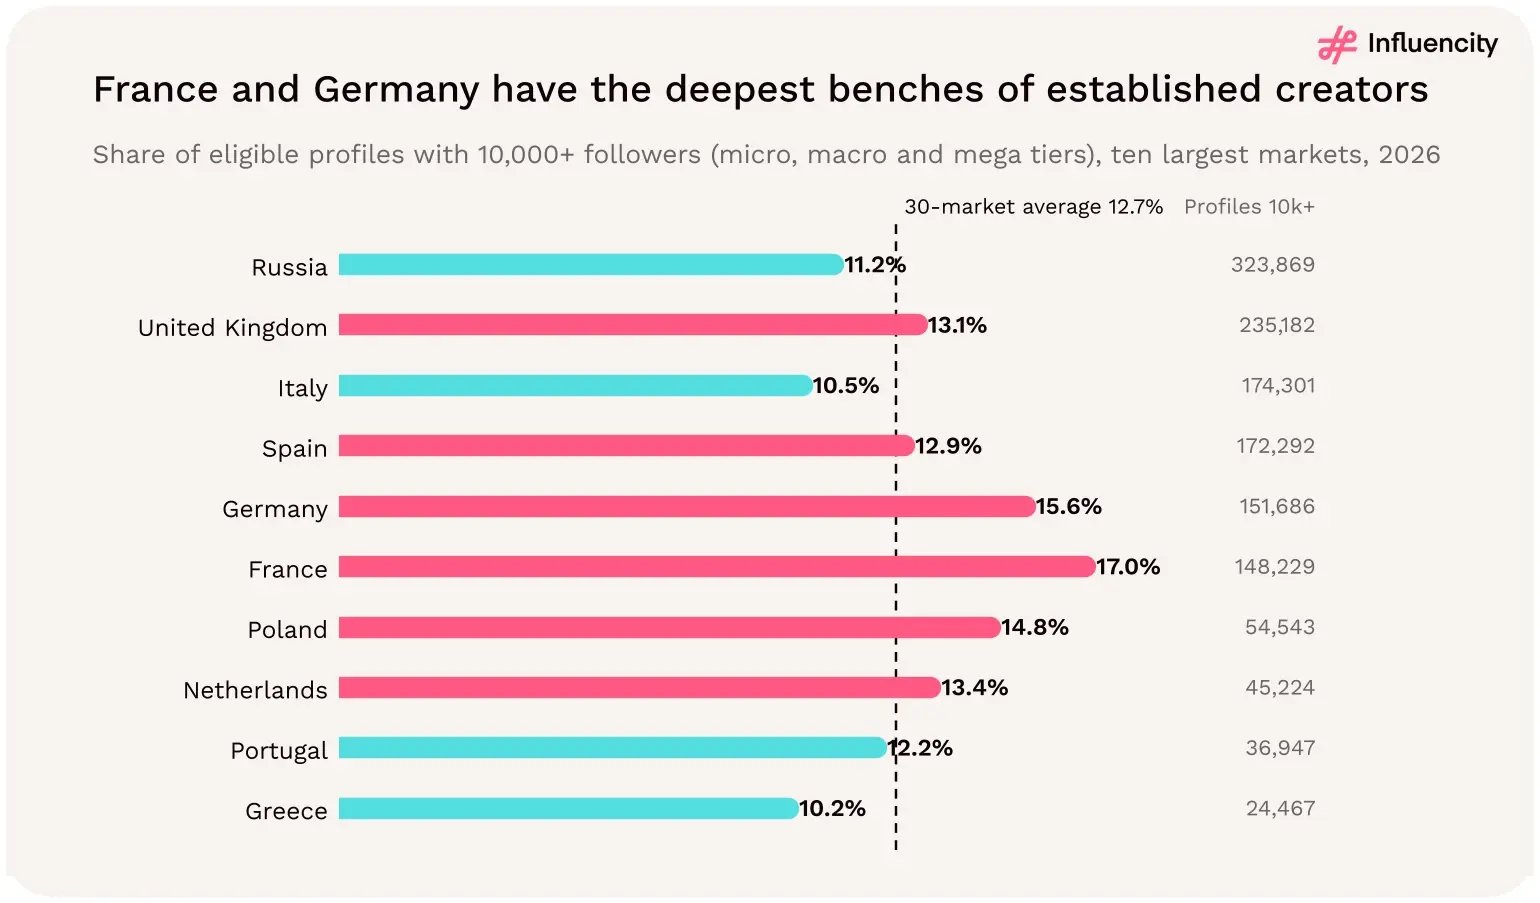
Figure 11 → France and Germany have the deepest benches of established creators. Share of eligible profiles with 10,000+ followers, ten largest markets. Source: [1].
The four follower tiers reconcile to within 0.13% of the headline count, and within ±0.5% in every market. France’s tier entries sit 0.37% above its headline total, which does not change its ranking. [1]
Smaller than the regional average implies. The median market records 124,434 eligible profiles, which sits between Ireland and Austria. The mean is 413,571, and only six markets exceed it. Eleven markets fall between 100,000 and 500,000 profiles. Eight markets have fewer than 50,000: Croatia, Cyprus, Lithuania, Slovenia, Latvia, Estonia, Malta and Luxembourg. Russia’s pool is 369 times Luxembourg’s. [1]
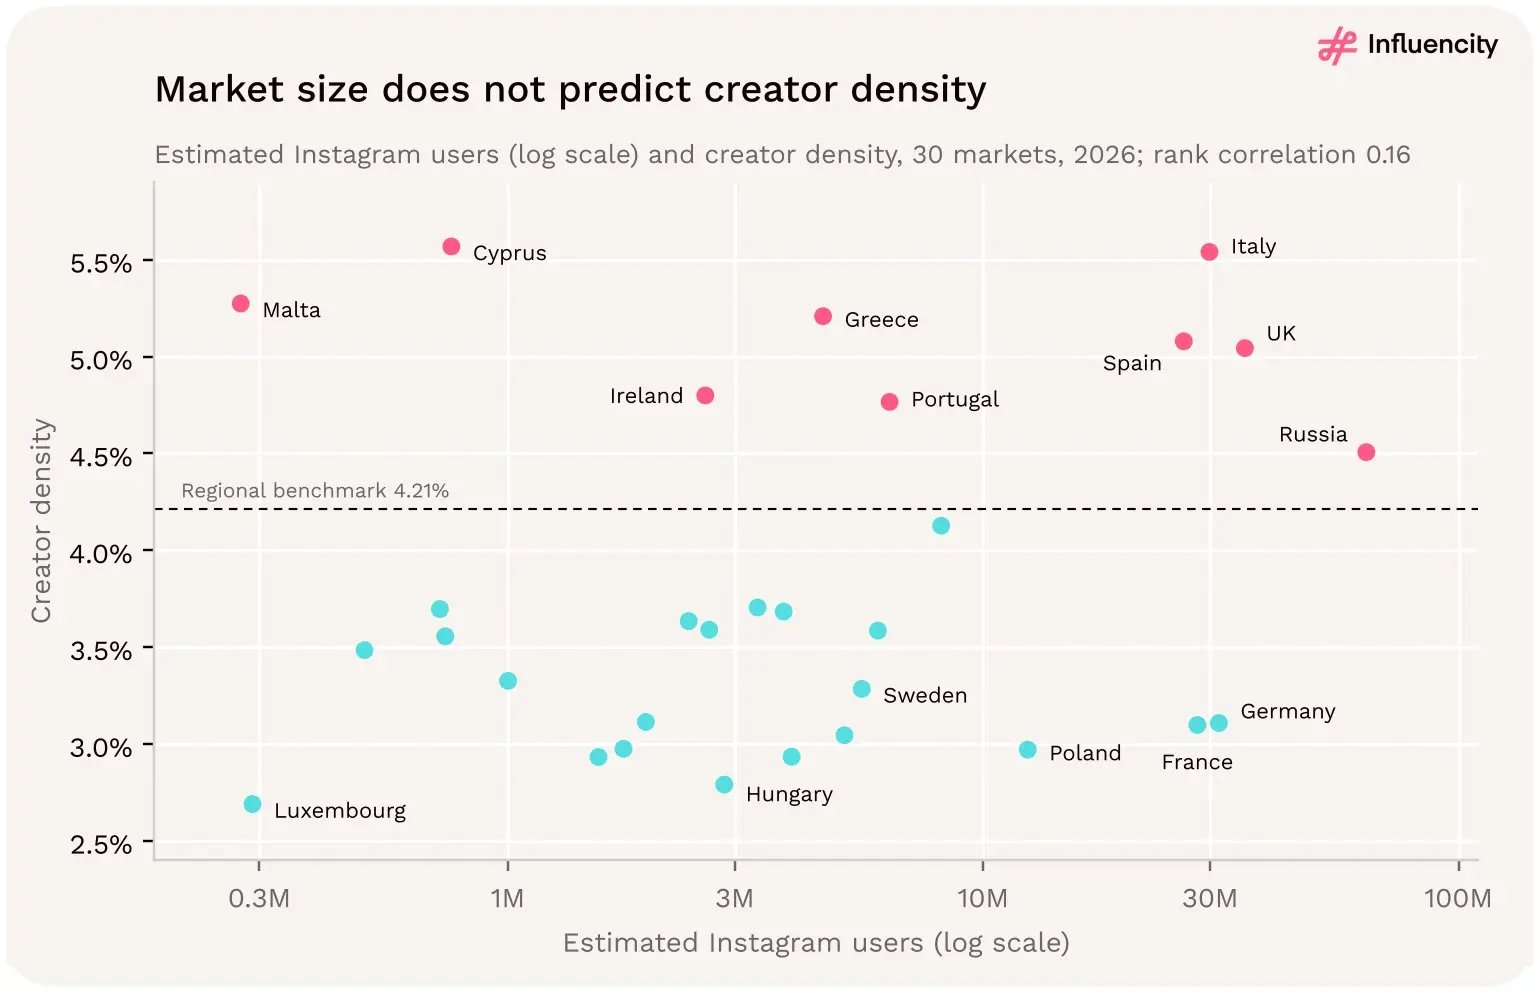
Figure 12 → Eligible Instagram profiles per 100 estimated users for all 30 markets, with the weighted regional benchmark. Source: [1].
Less than the extremes suggest. The highest density (Cyprus, 5.57%) is 2.07 times the lowest (Luxembourg, 2.69%). The middle half of markets falls between 3.10% and 4.70%, and the median market is at 3.59%. [1]
The 30 markets fall into five bands:
The Netherlands is the market closest to the regional ratio: 4.13%, or 0.98× the benchmark. [1]
Yes, descriptively. Grouping the markets by region shows a clear gradient:
The pattern is consistent, but it is not proof that geography, language or culture causes creator participation. Market size explains little: the largest audiences appear at both ends of the ranking, with Italy and the UK near the top and Germany and France in the bottom third. [1]
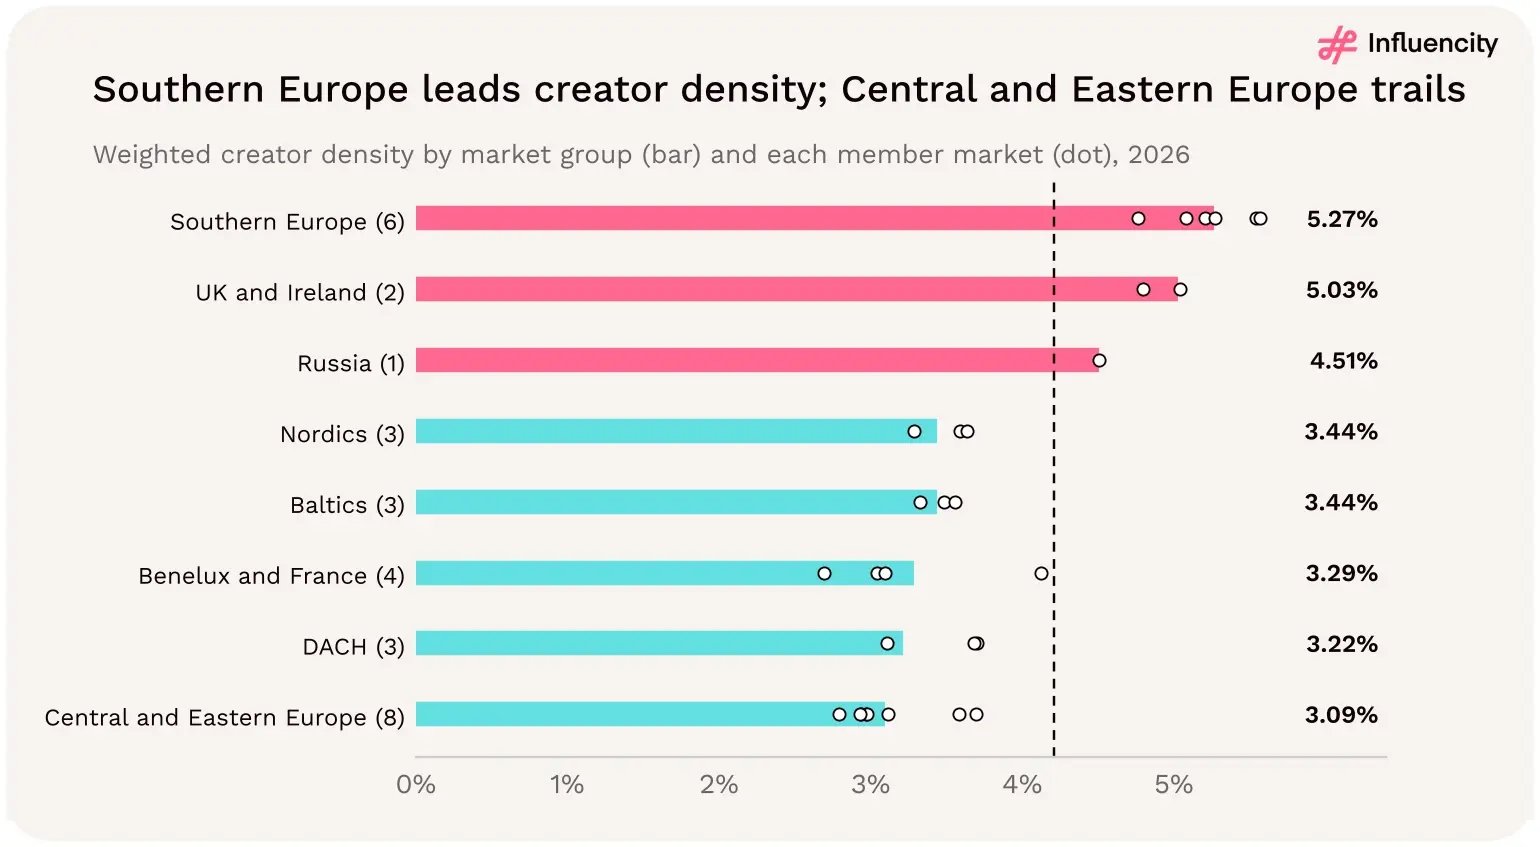
Figure 13 → Southern Europe leads creator density; Central and Eastern Europe trails. Weighted density by market group, with each member market shown as a dot. Source: [1].
Mostly nano creators. Across the 30 markets, overall density moves almost in lockstep with nano density (rank correlation 0.98). The link with 10K+ density is weaker (0.73). [1] Italy and Germany show how this works. Italy has 4.95 nano profiles per 100 users against Germany’s 2.62. For profiles with 10,000+ followers the gap is small: 0.58 against 0.48 per 100 users. [1]
An illustration of the scale involved: if Germany had Italy’s density, its estimated audience would support about 1.73M eligible profiles. That is roughly 761,000 more than it records. [1]
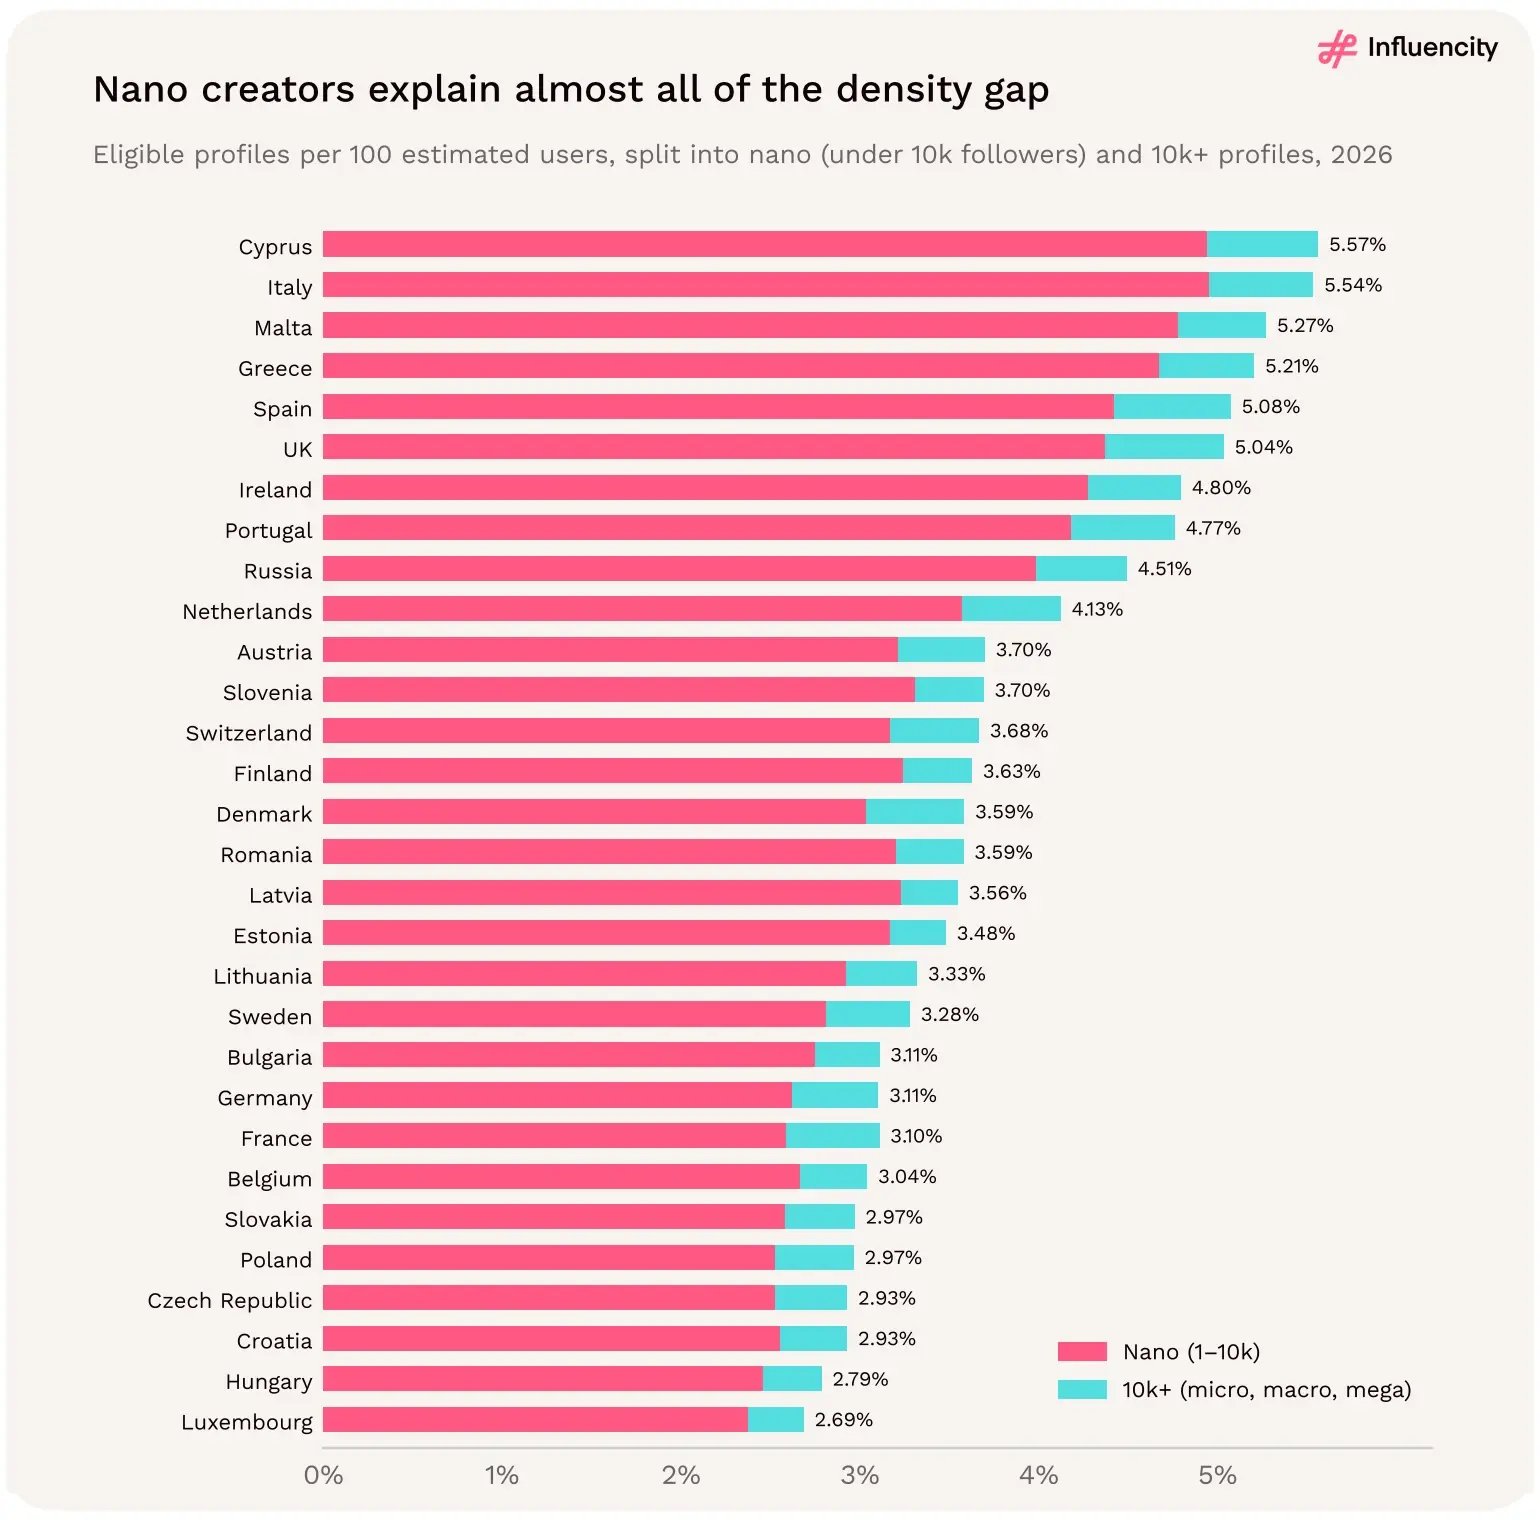
Figure 14 → Nano creators explain almost all of the density gap. Eligible profiles per 100 estimated users, split into nano and 10K+ profiles. Source: [1].
The UK and Spain. Across the 30 markets there are 5.33 profiles with 10,000+ followers for every 1,000 estimated users. The UK records 6.62 and Spain 6.53, followed by Cyprus (6.22), Italy (5.83) and Portugal (5.82). [1] Two markets move up sharply on this measure:

Figure 15 → The UK and Spain lead for established creators per user. Profiles with 10,000+ followers per 1,000 estimated users. Source: [1].
Cyprus records 42,317 eligible profiles against 760,000 estimated users. Italy records 1.66M profiles against 29.9M users. Their ratios are almost identical, but Italy offers roughly 39 times the recorded profile count. Density is a relative measure, not a substitute for scale. [1]
The five markets Cyprus, Italy, Malta, Greece and Spain together contain 26.5% of regional creator supply and 21.0% of estimated users. The pattern is concentrated around Mediterranean markets; it is not proof that geography causes creator participation. At the other end, Luxembourg is at 2.69%, Hungary at 2.79% and Croatia at 2.93%. Lower density does not establish lower prices, lower competition or untapped demand. [1]
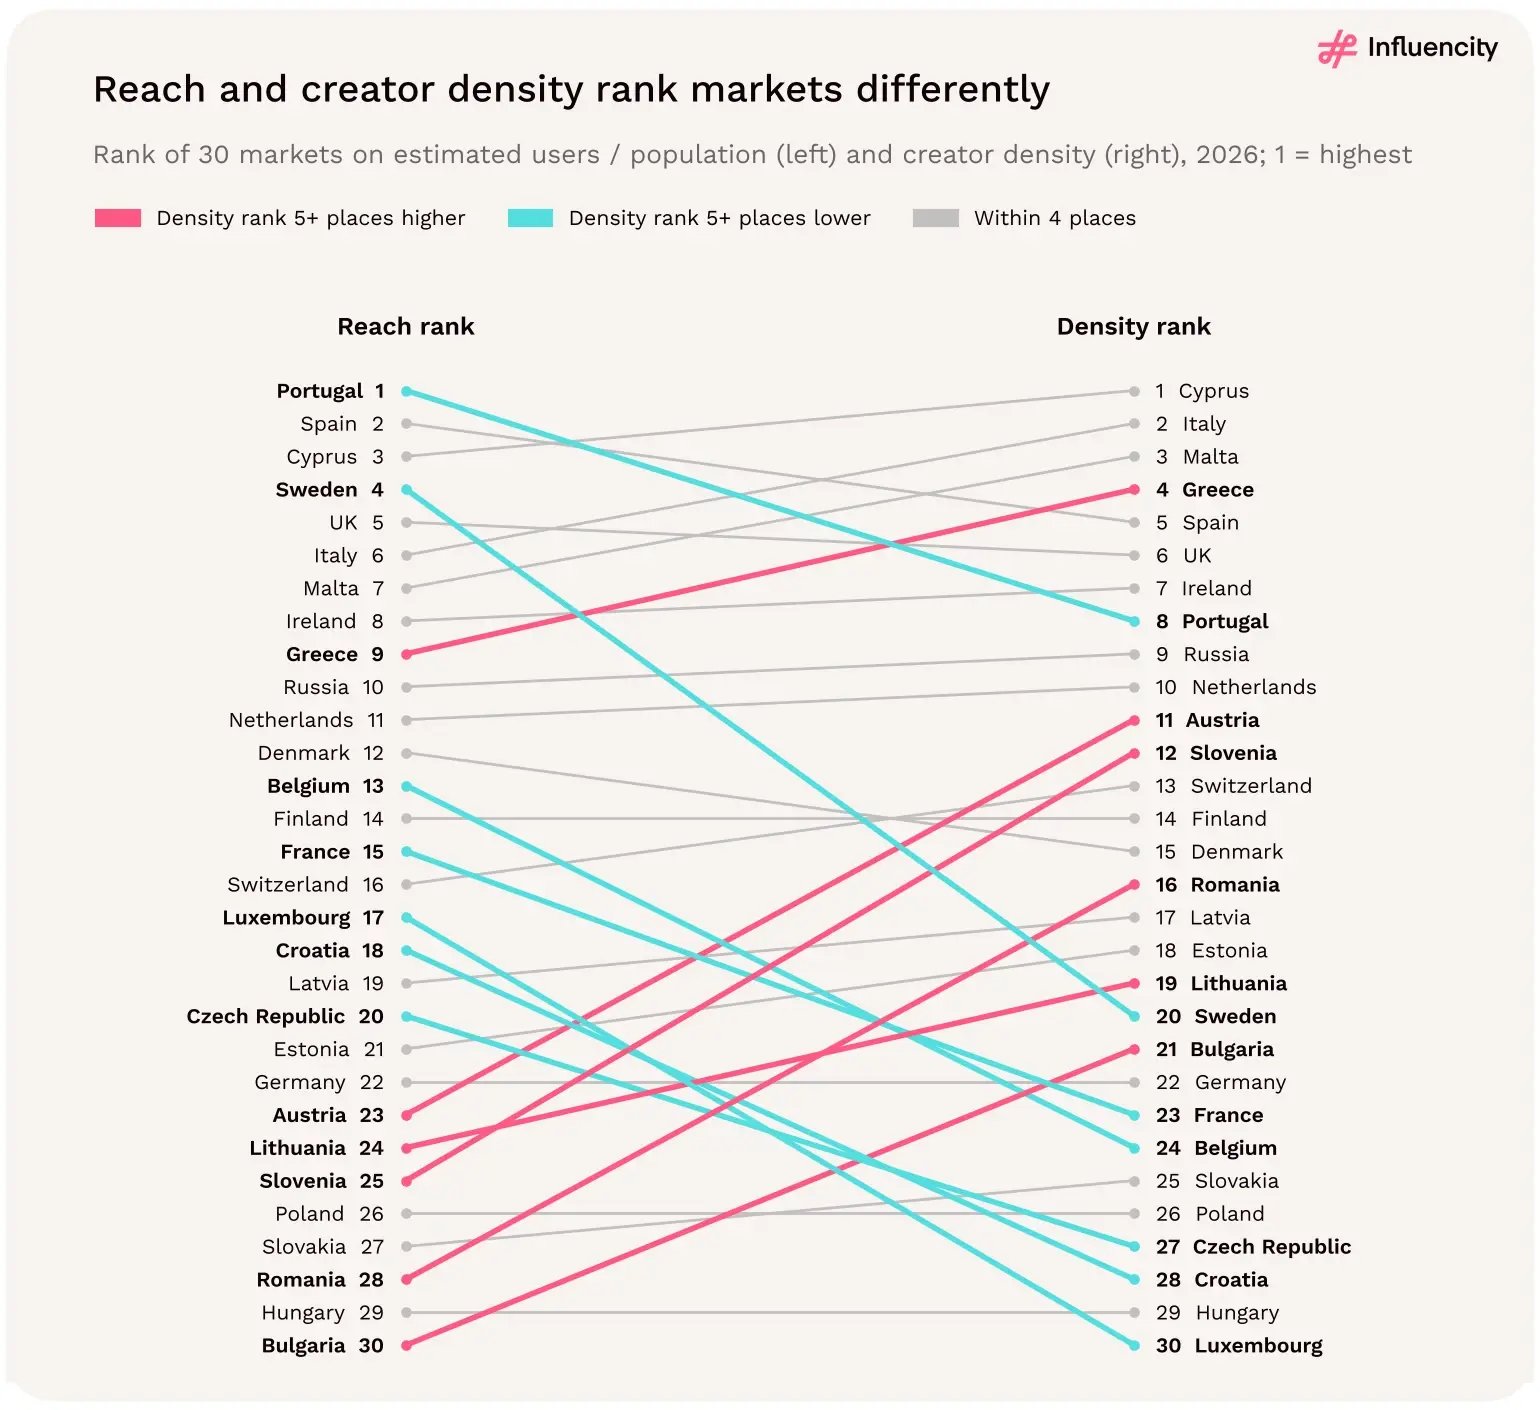
Figure 16 → Two different denominators reveal distinct audience and creator-supply patterns. Source: [1].
From under 30% to over 60% of the population. The median market sits at 42.2%, and the middle half of markets falls between 36.9% and 48.0%. Twelve of the 30 markets are above the 43.9% benchmark. [1]
By region:
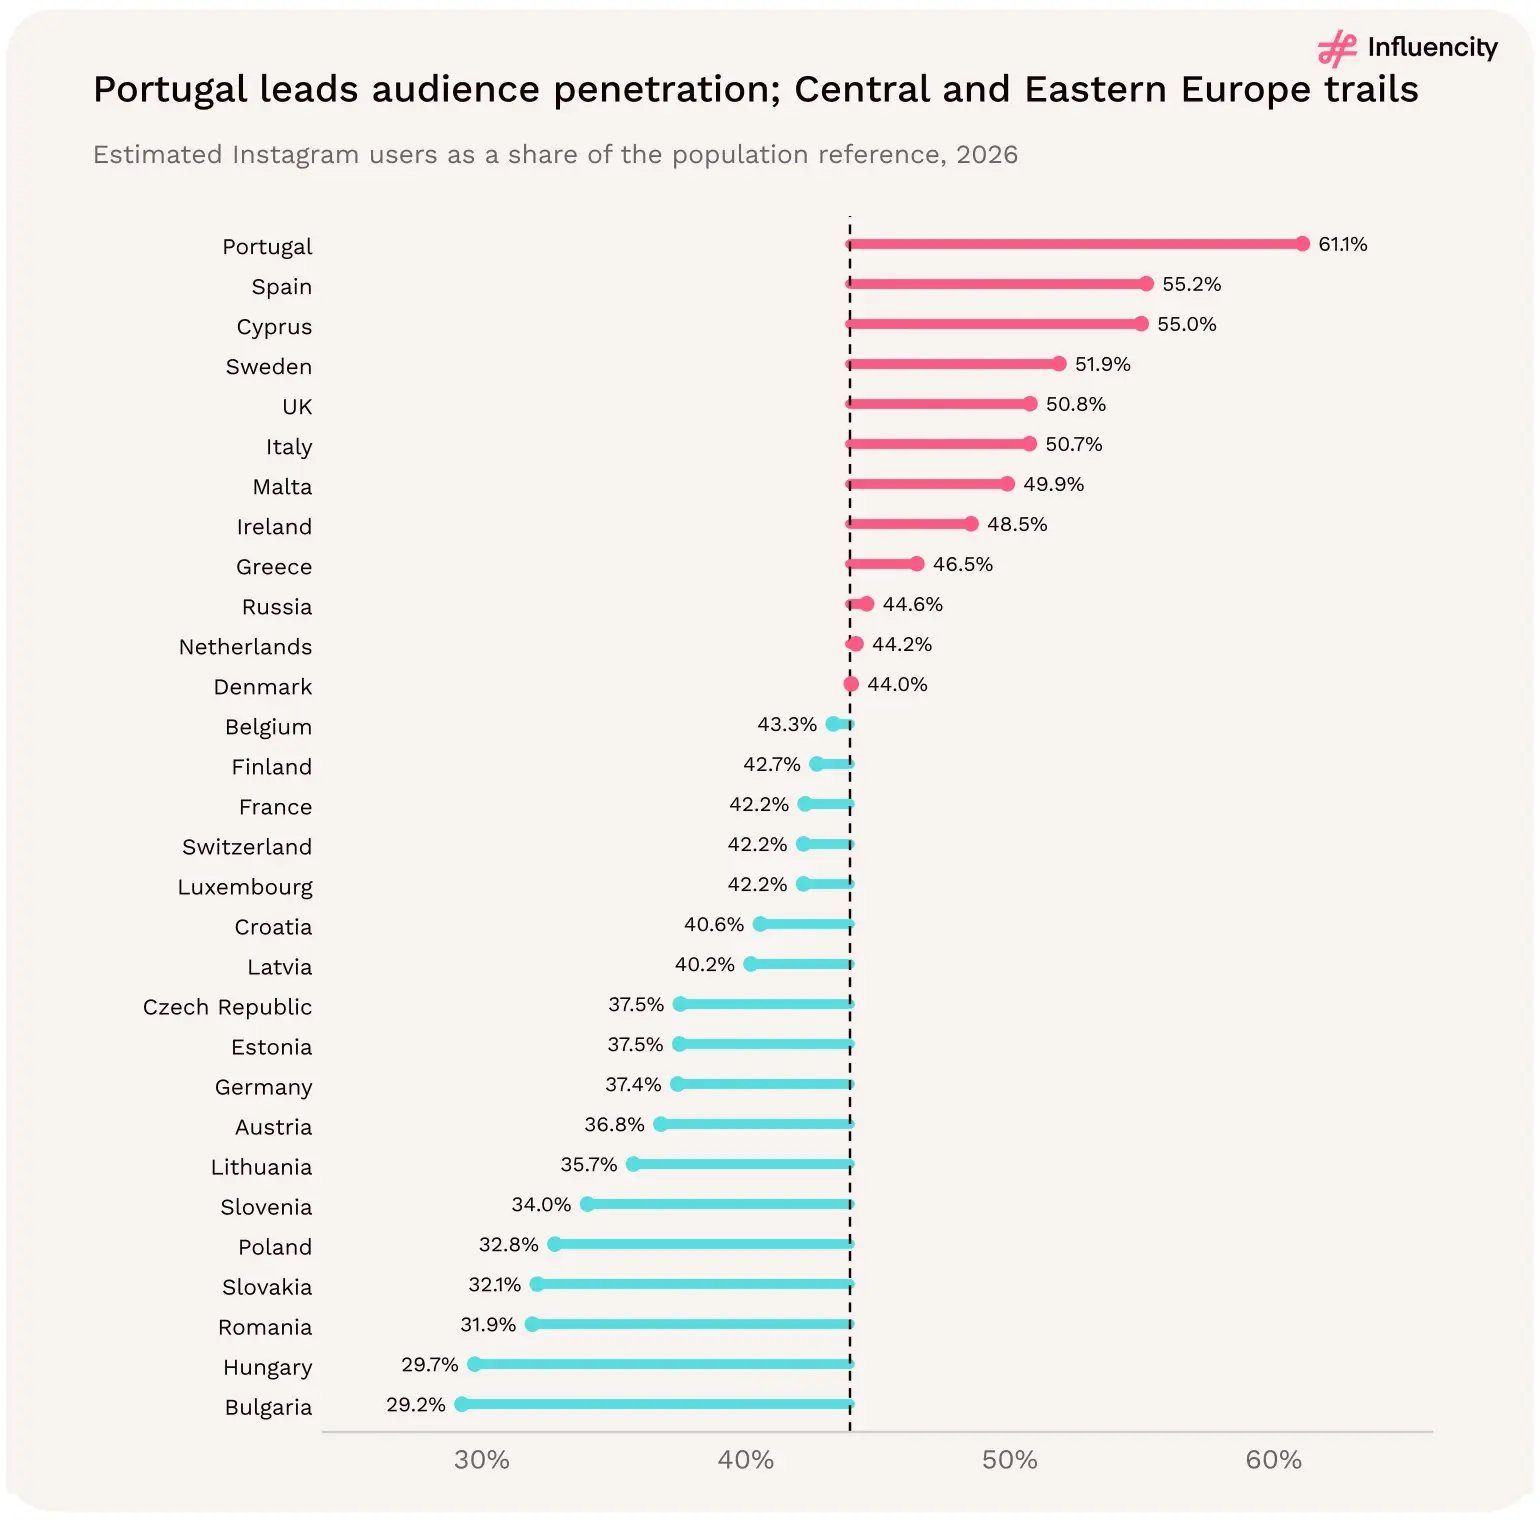
Figure 17 → Portugal leads audience penetration; Central and Eastern Europe trails. Estimated Instagram users as a share of the population reference, 30 markets. Source: [1].
Usually, and never the other way round. Measured against both benchmarks, the 30 markets fall into three of the four possible groups:
This is a descriptive pattern across 30 snapshots, not proof that audience reach creates influencers. Both measures depend on the same account-assignment method, so shared factors in how markets are measured may contribute. [1]
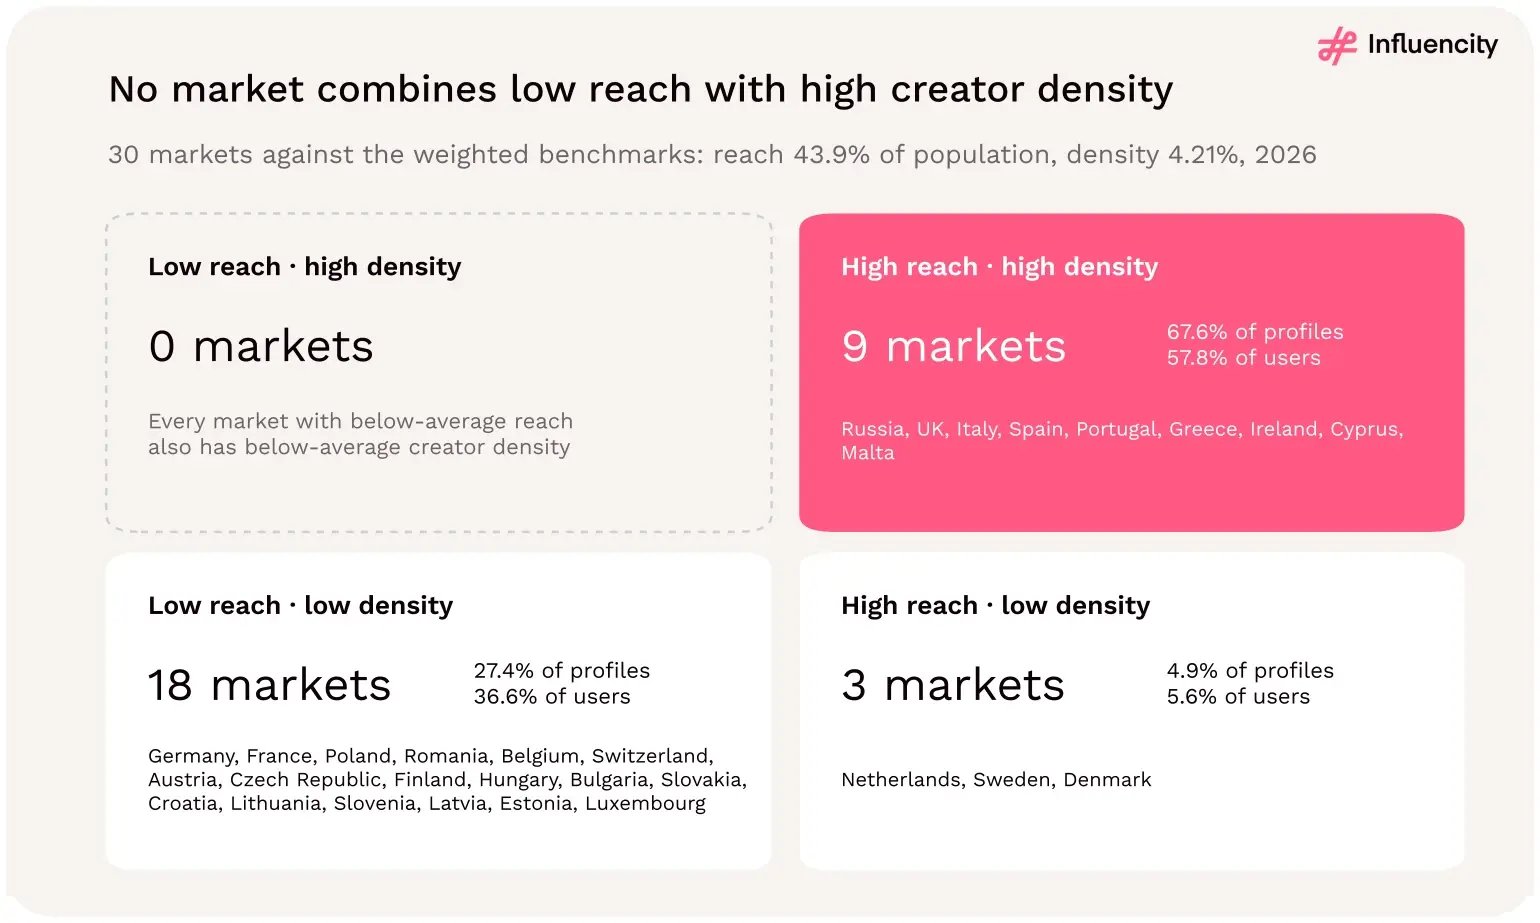
Figure 18 → No market combines low reach with high creator density. 30 markets classified against the weighted reach and density benchmarks. Source: [1].
Cyprus, Portugal and Italy. Profiles per 1,000 residents combine both measures: reach × density.
The 3.7-fold gap between Cyprus and Hungary breaks down almost evenly. Cyprus has 1.85 times Hungary’s reach and 2.00 times its density, so both measures matter about equally. Across all 30 markets, reach accounts for about 45% of the variation in creators per resident and density for about 55%. [1]
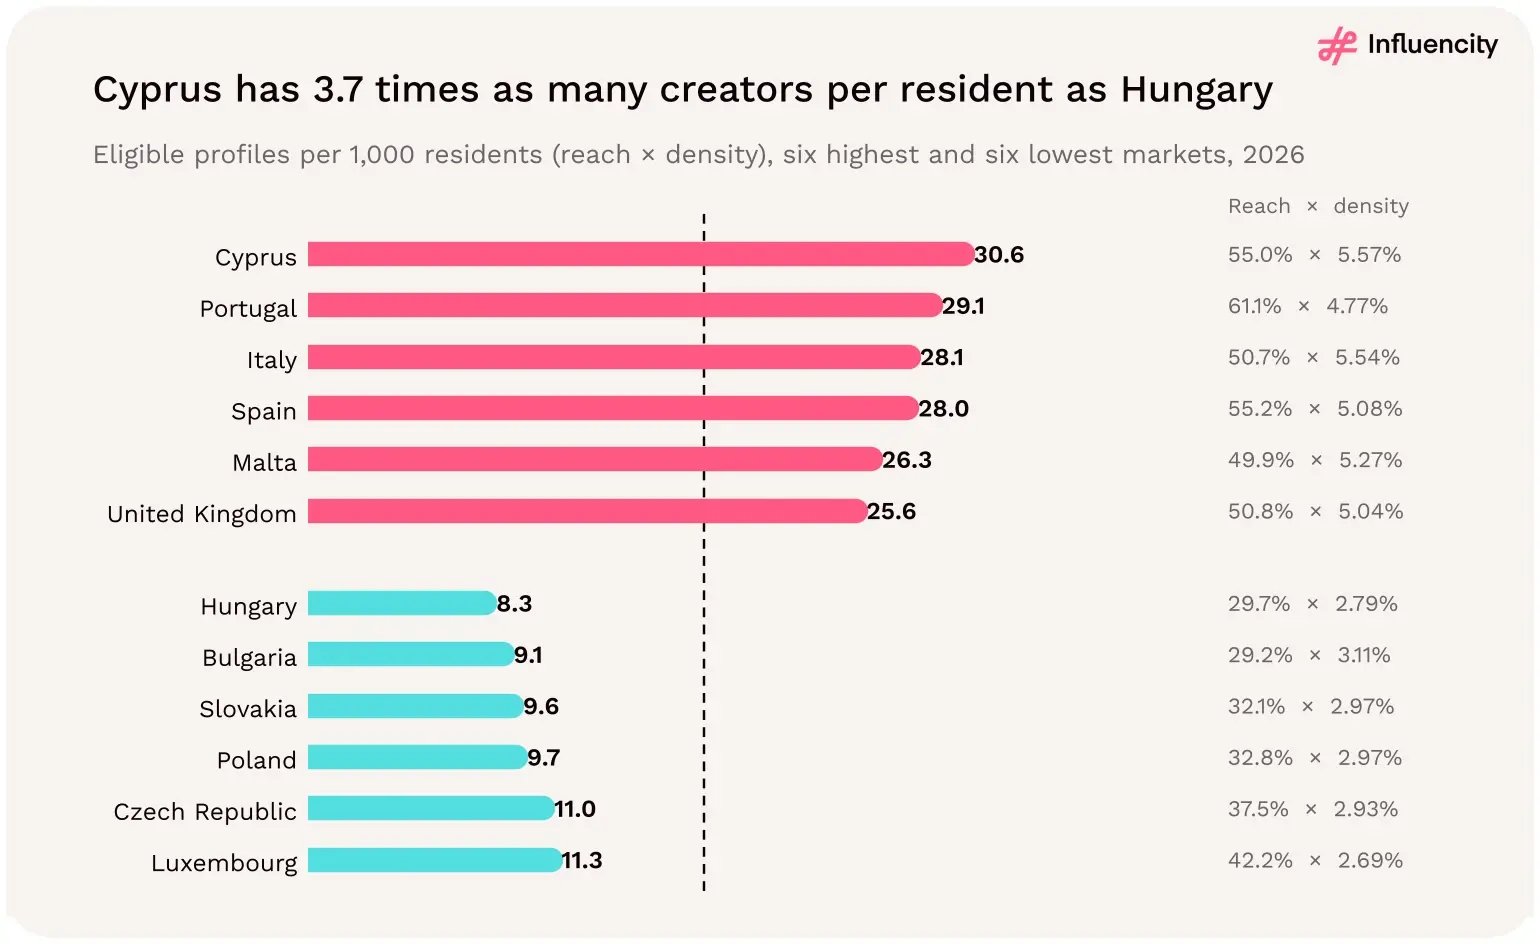
Figure 19 → Cyprus has 3.7 times as many creators per resident as Hungary. Eligible profiles per 1,000 residents, six highest and six lowest markets, with reach and density shown for each. Source: [1].
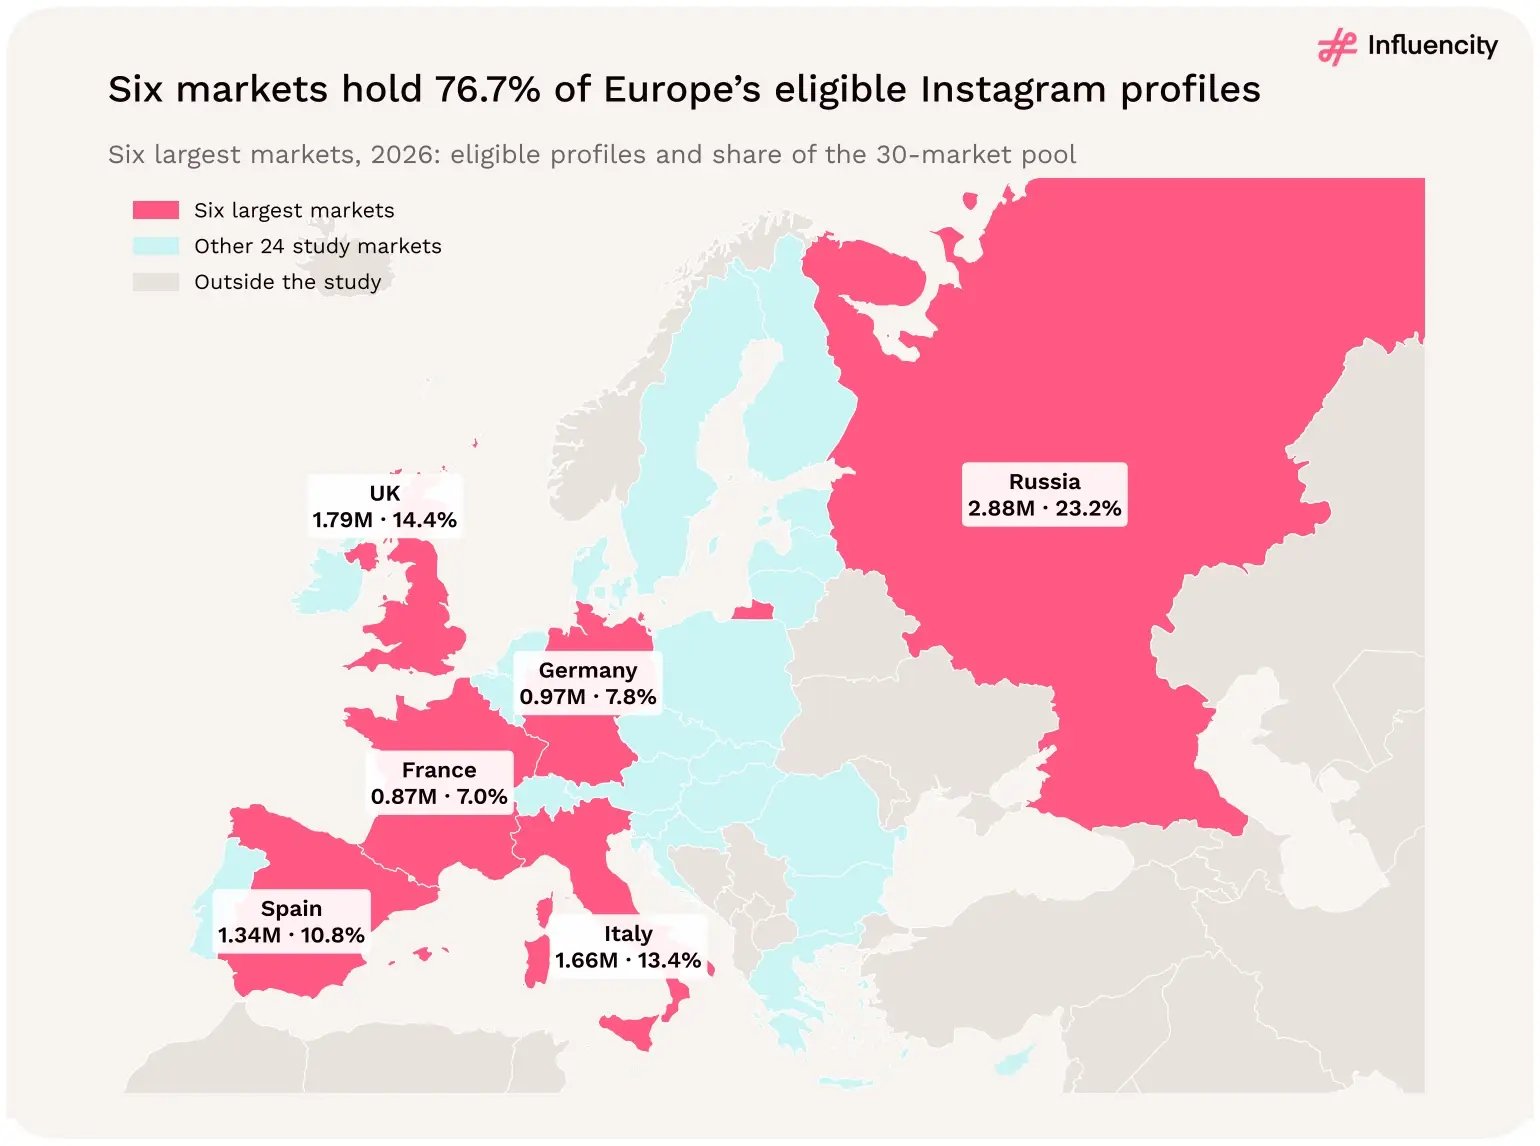
Figure 20 → Six markets hold 76.7% of the eligible Instagram profiles in the 30-market study: Russia, the United Kingdom, Italy, Spain, Germany and France, 2026. Source: [1].
The answer depends on what a campaign needs: a large pool of potential collaborators, a deep selection of established creators, strong audience penetration, or access to highly specific communities. Russia, the United Kingdom, Italy, Spain, Germany and France account for 76.7% of the 12.41 million influencer-eligible Instagram profiles recorded across the study's 30 European markets.
Together, they contain 9,514,706 eligible profiles. Yet their creator scenes differ in ways that a simple country ranking cannot capture. [1] Italy has approximately 1.70 times Germany's eligible creator count, despite having a slightly smaller estimated Instagram audience. France has fewer eligible profiles than Spain, but a considerably higher proportion of creators with 10,000 or more followers. Russia leads by absolute volume, although legal restrictions make recorded supply an unreliable indicator of commercial accessibility.
Reading the study. These contrasts reveal the central planning lesson of this section: the size of a creator market, the depth of its established-creator pool, and its commercial accessibility are three different questions.
For brands and agencies, understanding those differences is more useful than identifying a single country with the most influencers.
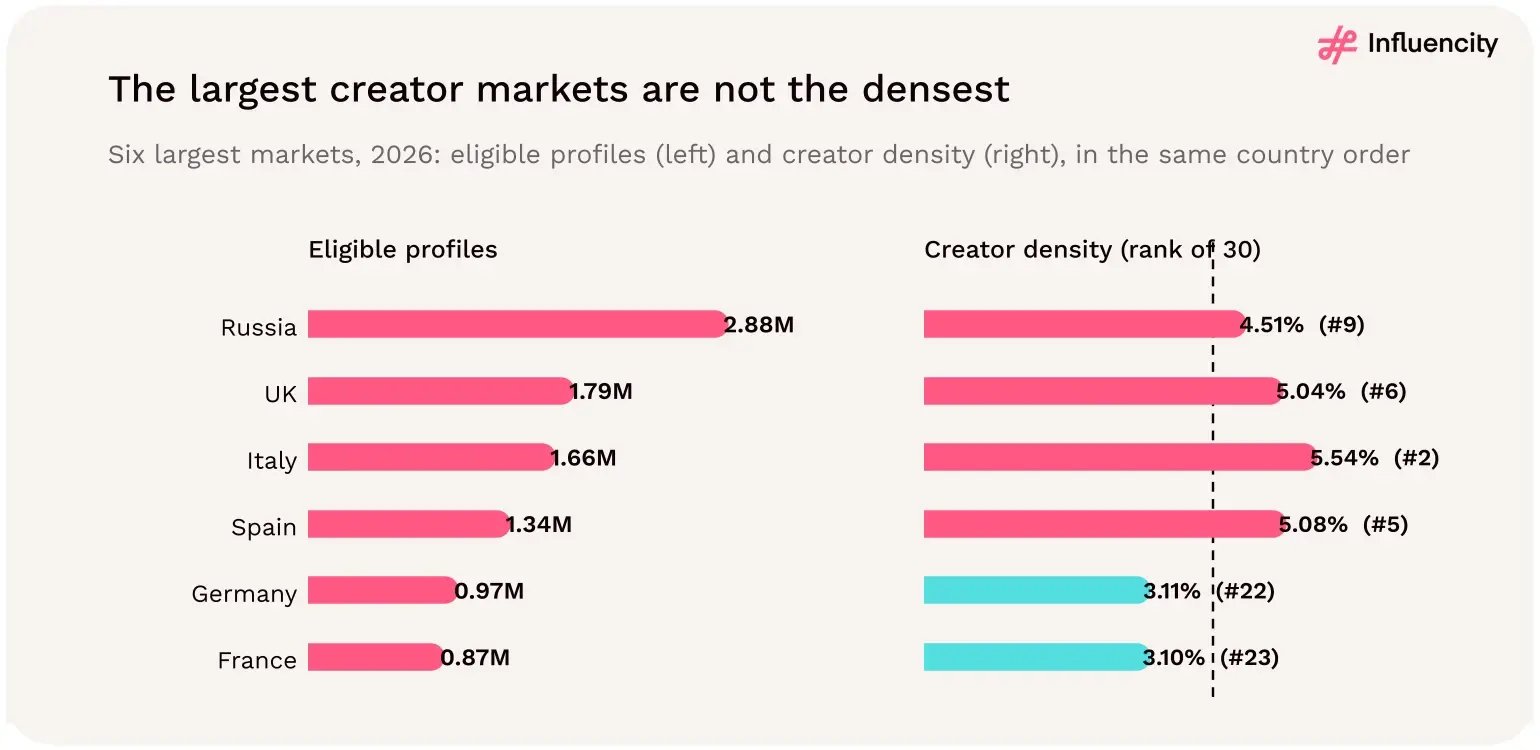
Figure 21 → The largest Instagram creator markets do not have the highest creator density. Six leading European markets, 2026. Source: [1].
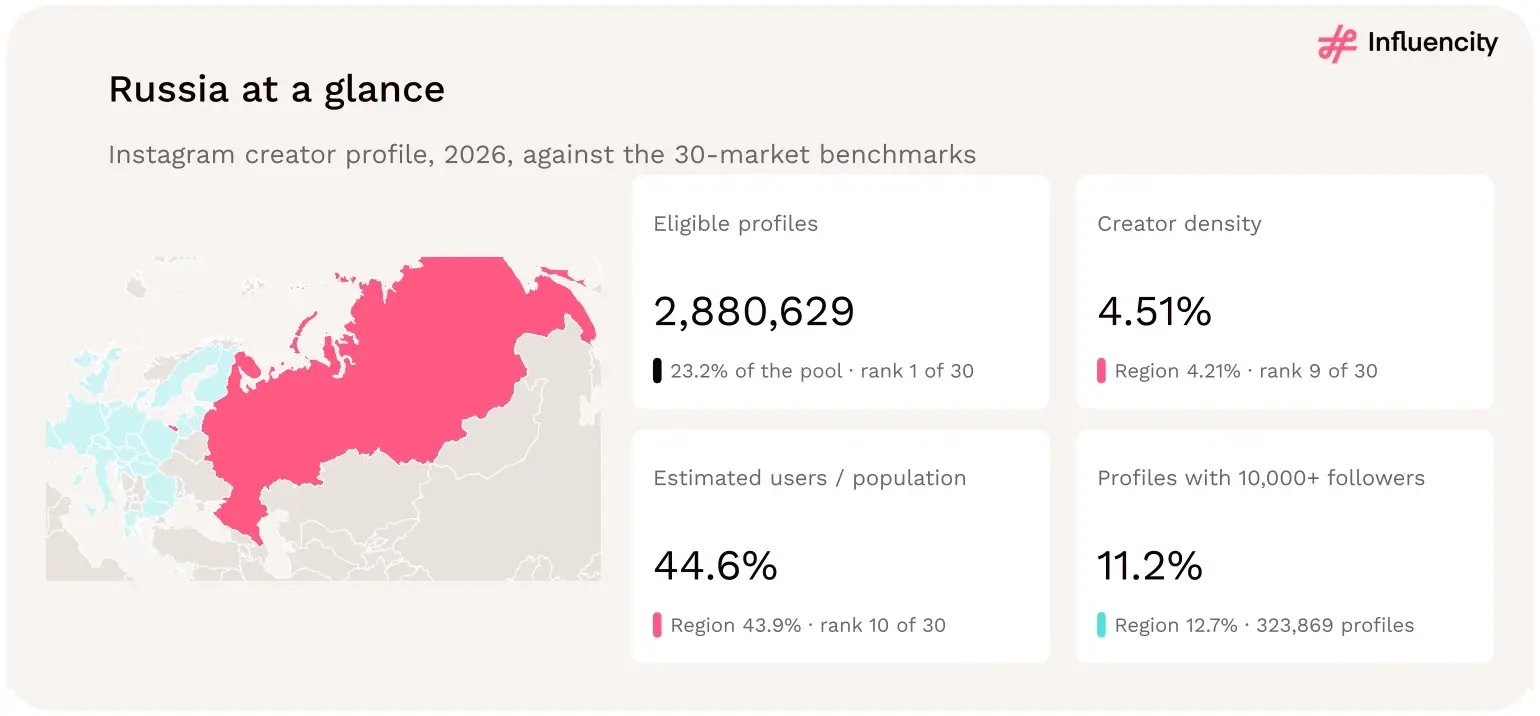
Figure 22 → Russia at a glance: the largest recorded creator pool, with creator density and audience reach close to the 30-market benchmarks. Source: [1].
Russia has 2,880,629 influencer-eligible Instagram profiles, representing 23.2% of all eligible profiles in the 30-market study. Its estimated Instagram audience is 63.9 million accounts, producing a creator density of 4.51%, slightly above the regional benchmark of 4.21%. [1]
Russia alone contains more recorded eligible profiles than Germany, France and Poland combined. But the most important question about Russia is not how many creator profiles the dataset identifies. It is how much of that recorded supply can realistically and legally be activated.
Russia contributes 23.2% of eligible profiles but 21.7% of estimated Instagram users. Its presence therefore influences the regional totals. The effect becomes particularly visible in the gender data.
Across all 30 markets, female-classified profiles represent 59.84% of male/female-classified profiles. When Russia is excluded, that share falls to 56.61%, a difference of 3.23 percentage points.
Russia's own classified female share is 71.2%, substantially above the regional figure. It accounts for 26.2% of all female-classified profiles in the dataset. [1] Creator density, however, is much less sensitive to the same exclusion: it moves from 4.21% to 4.13%.
Reading the study. This distinction matters because Russia changes Europe's reported creator composition more dramatically than it changes Europe's creator-to-user ratio.
Instagram has been blocked in Russia since 2022, and the study documents subsequent restrictions on advertising on platforms designated as extremist. From 1 September 2025, Russian law has prohibited advertising on those platforms. [9–11] Some creators have continued to use Instagram through VPNs or other arrangements, but the presence of a public profile does not establish that a proposed paid collaboration is lawful, feasible, or commercially accessible.
There is also a geographic classification limitation. Influencity assigns profiles to countries using public signals, including biography locations, geotags, language and content. Russian-language accounts operating outside Russia, or creators who have relocated, may still be assigned to Russia.
The recorded figure should therefore be interpreted as profiles associated with Russia through the dataset's location signals, not as verified in-country users or legally available advertising inventory.
What should brands and agencies do? For market analysis, report the 30-market European benchmark alongside the 29-market benchmark excluding Russia when the distinction materially affects the conclusion.
For campaign activation, do not treat Russia's 2.88 million eligible profiles as an immediately usable recruitment pool. Conduct jurisdiction-specific legal, sanctions, platform-policy, payment and reputational checks before considering any collaboration.
Russia illustrates the difference between statistical significance and commercial accessibility. It is the largest contributor to Europe's influencer data, but that does not make it the largest executable influencer marketing opportunity.
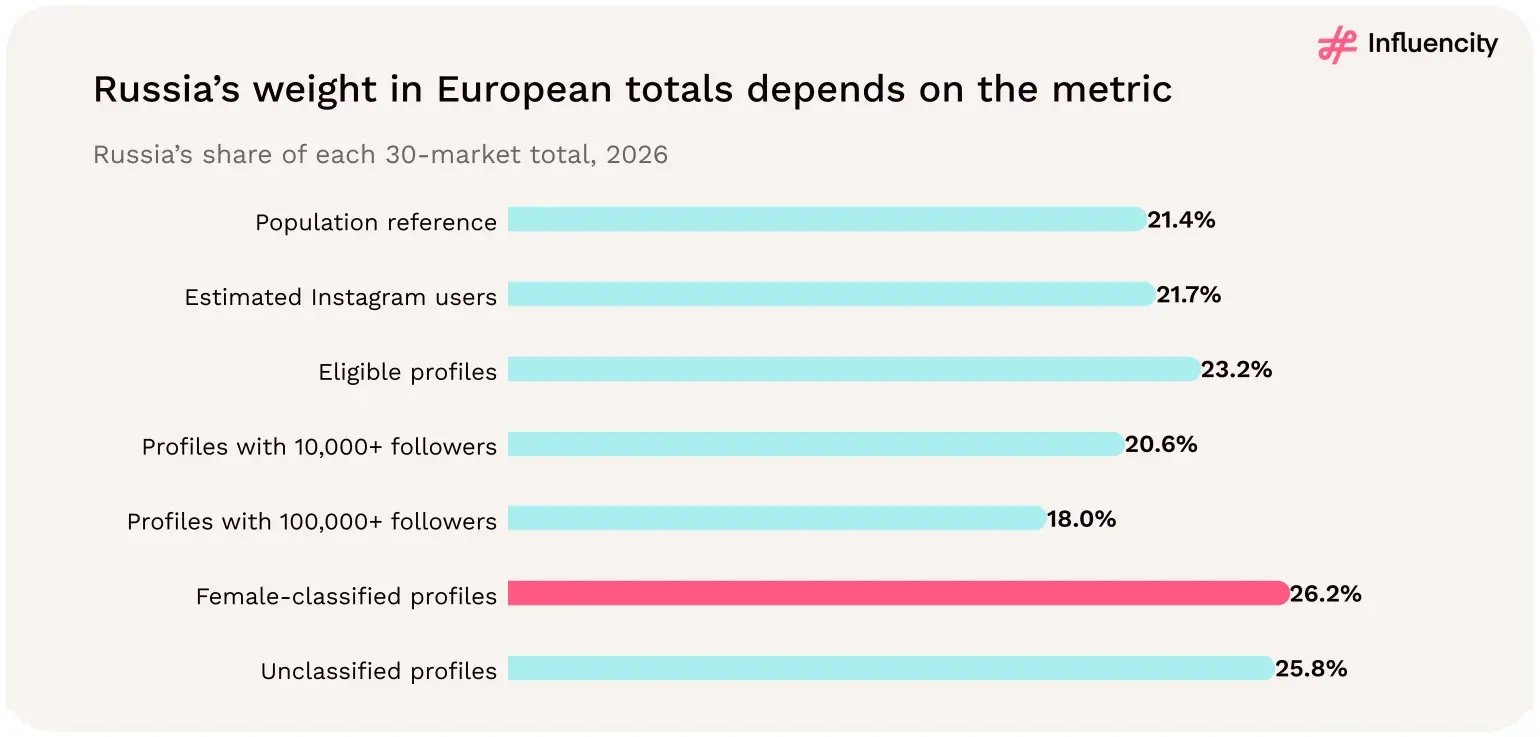
Figure 23 → Russia's weight in European totals depends on the metric: from 18.0% of profiles with 100,000+ followers to 26.2% of female-classified profiles. Source: [1].
Russia is essential to understanding the dataset, but its recorded creator supply must not be confused with commercially accessible inventory.
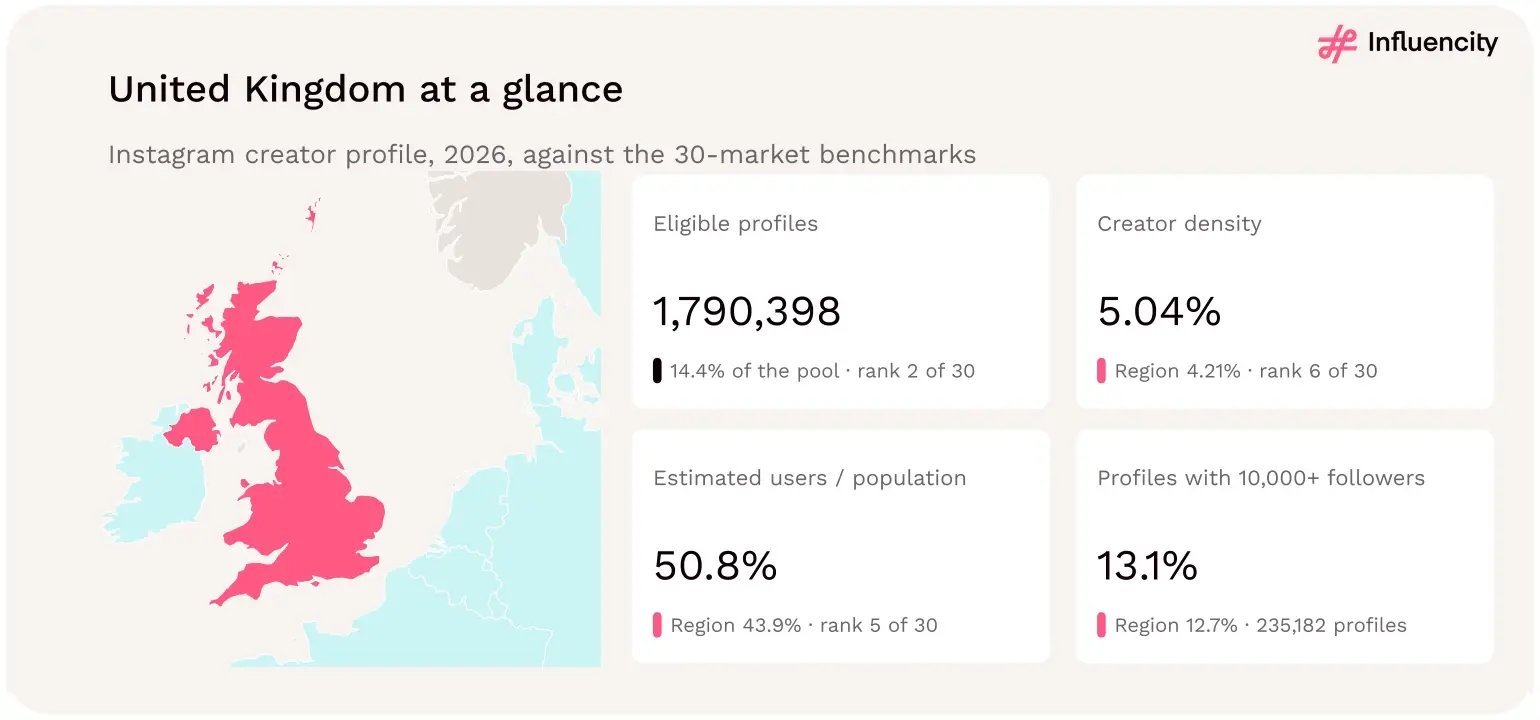
Figure 24 → United Kingdom at a glance: the second-largest creator pool, above the 30-market benchmark on creator density, reach and established-creator share. Source: [1].
The United Kingdom has 1,790,398 eligible Instagram creator profiles and an estimated audience of 35.5 million Instagram users. Its creator density is 5.04%, approximately 20% above the regional benchmark. [1]
It is the largest recorded creator market outside Russia and the second-largest overall. But the UK's strategic distinction becomes clearer when the analysis moves beyond total profile counts.
The UK records 29,222 profiles with at least 100,000 followers, compared with 29,206 in Russia. That is a difference of just 16 profiles, even though Russia's total eligible pool is approximately 61% larger than the UK's.
This contrast reveals how differently creator supply can be distributed across follower tiers. The UK also records 235,182 profiles with 10,000 or more followers, compared with Russia's 323,869. Its established-creator share is 13.1%, above the regional figure of 12.7%. [1]
The result is a market that combines a large discovery universe with considerable depth beyond the nano tier.
Across all 30 markets, the UK has the highest concentration of creators with 10,000 or more followers relative to estimated Instagram users: 6.62 profiles per 1,000 users. Spain follows closely at 6.53.
This is a different measure from overall creator density. It focuses on the supply of profiles above the 10,000-follower threshold rather than the full eligible pool.
Reading the study. For brands seeking established creators, that distinction can be more relevant than the headline number. It does not prove that UK creators have better engagement, stronger commercial experience, or greater availability. It establishes that the UK has a comparatively substantial recorded pool in those follower tiers.
Location remains an important limitation. An account assigned to the UK may attract followers from several countries. English-language content can reach audiences far beyond the creator's home market.
For a campaign targeting UK consumers, creator location and follower geography must therefore be evaluated separately.
This is especially important for retail campaigns, regional services, local events and other initiatives where audience location determines commercial relevance.
What should brands and agencies do? Use the UK's large creator pool to build shortlists across multiple follower tiers, but apply audience-geography requirements early.
For reach-led campaigns, compare the availability of established creators rather than relying exclusively on total eligible profiles.
For highly localized campaigns, validate the percentage and distribution of followers in the intended market before negotiating partnerships.
The UK's advantage is not simply that it has many creators. It has a large pool of creators above the 10,000-follower threshold, making its established-creator supply particularly important to evaluate.
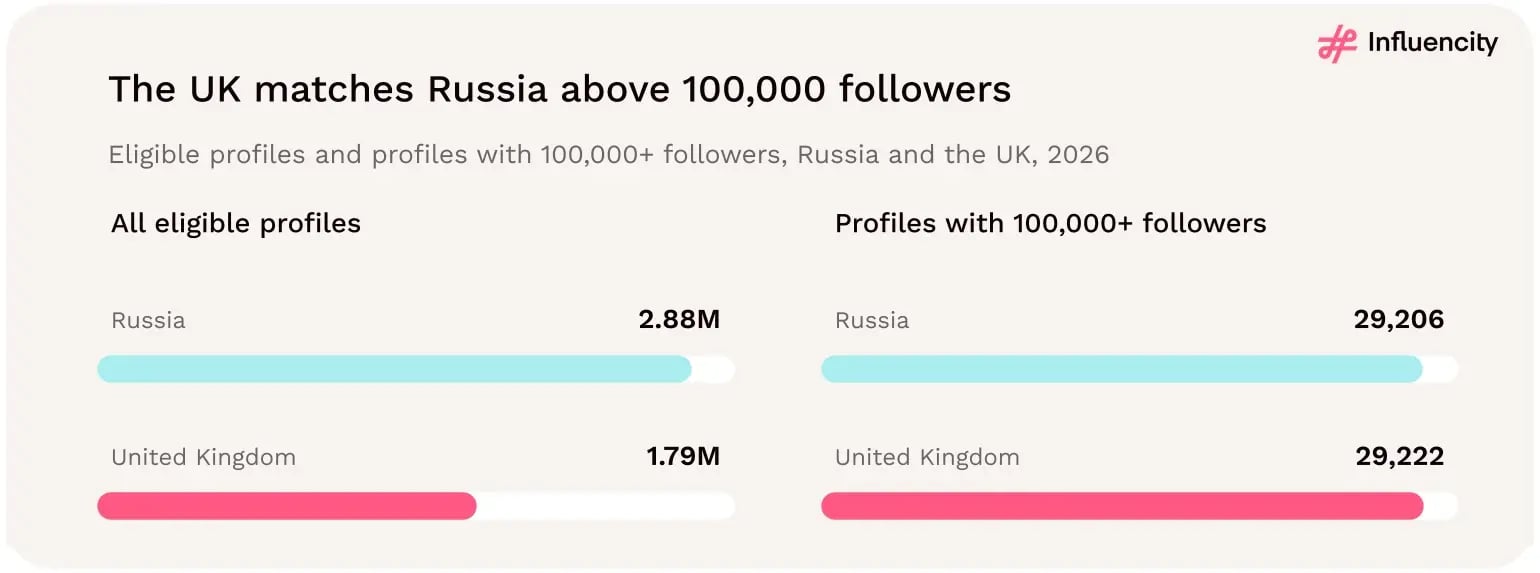
Figure 25 → The UK matches Russia's pool of creators with 100,000+ followers despite having far fewer eligible profiles overall. Source: [1].
The UK offers a substantial discovery scale and a particularly deep pool of established creators. Audience geography remains the critical qualification step.
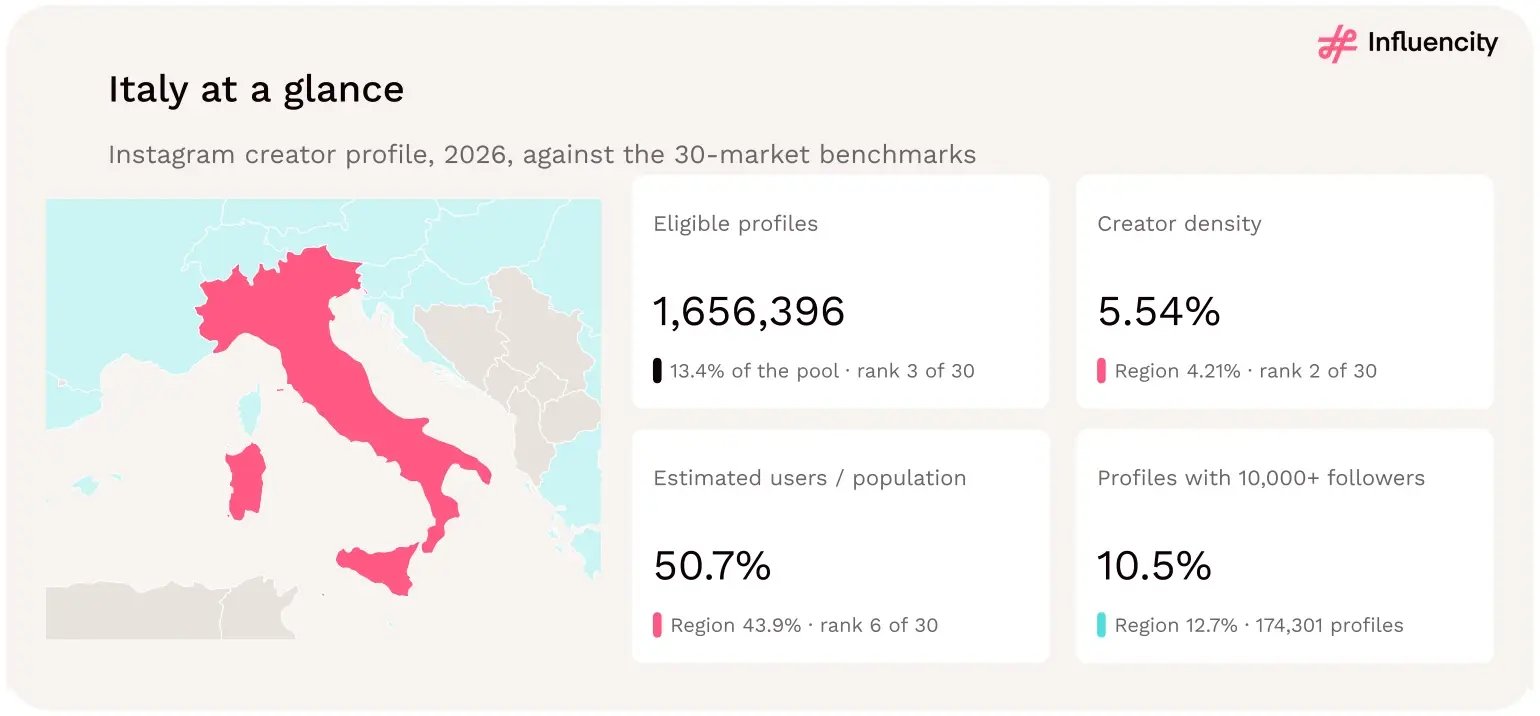
Figure 26 → Italy at a glance: the second-highest creator density in the study, with a below-benchmark share of established creators. Source: [1].
Italy has 1,656,396 eligible Instagram creator profiles, an estimated Instagram audience of 29.9 million, and a creator density of 5.54%. That places it second among the 30 markets, narrowly behind Cyprus at 5.57%. [1]
Italy's creator density is approximately 1.31 times the regional benchmark.
Its position is especially striking when compared with Germany, which has a slightly larger estimated Instagram audience but far fewer eligible profiles. Italy records approximately 1.70 times Germany's total eligible creator count.
The study cannot establish why this difference exists. But its follower-tier data reveals where the difference is concentrated.
Italy has approximately 4.95 nano profiles per 100 estimated Instagram users, compared with Germany's 2.62. That produces a nano-density gap of approximately 2.33 percentage points. The total creator-density gap between the countries is approximately 2.43 percentage points.
In other words, roughly 96% of Italy's density advantage over Germany comes from profiles below 10,000 followers. [1] The contrast narrows substantially when we examine more established creators.
Italy has approximately 0.58 profiles with 10,000+ followers per 100 estimated users, compared with Germany's 0.48.
This is one of the study's most consequential findings for campaign planning. Italy does not simply have more creators at every level in the same proportion. Its unusually high overall density is overwhelmingly associated with its nano-creator population.
Italy has 1.66 million eligible profiles, compared with Germany's 972,862. But Italy records approximately 174,301 profiles with 10,000+ followers, while Germany records approximately 151,686.
The ratio therefore narrows from 1.70 times at the total-profile level to approximately 1.15 times among established creators.
That difference should influence how brands compare the two markets.
A campaign requiring many smaller creators may find Italy's overall pool particularly relevant. A campaign focused on established profiles should compare the narrower 10K+ counts rather than assuming Italy offers 70% more suitable candidates.
Reading the study. What should brands and agencies do?
Segment the Italian creator pool by follower tier before developing the recruitment strategy.
For nano-led programs, test broader niche and geographic searches. For campaigns requiring established creators, evaluate the 10K+ universe directly.
Then apply the same quality, audience and pricing criteria used in other countries.
Italy's high density is primarily a story about the bottom of the follower ladder. Without examining creator tiers, its headline advantage over Germany can be misleading.
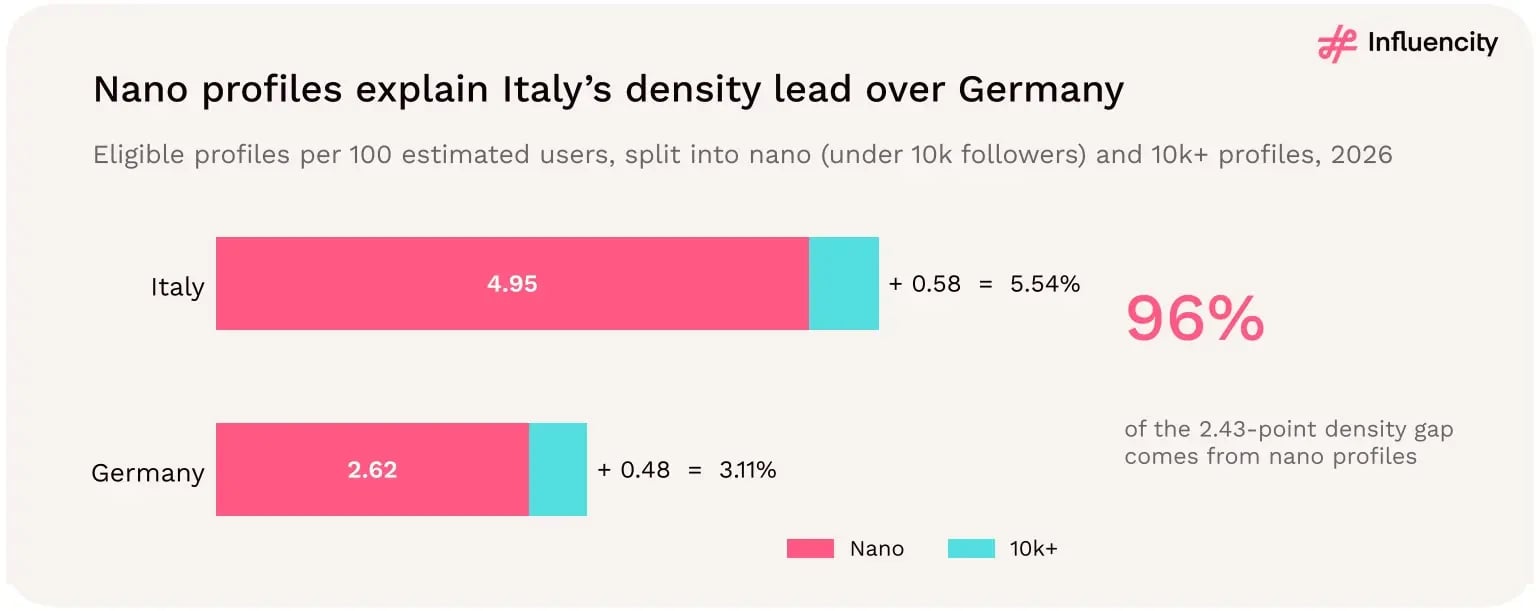
Figure 27 → Nano profiles account for 96% of Italy's 2.43-point creator-density lead over Germany. Source: [1].
Italy is a high-density market with a particularly large nano-creator population. Its advantages should be evaluated by tier, not inferred from its headline count.
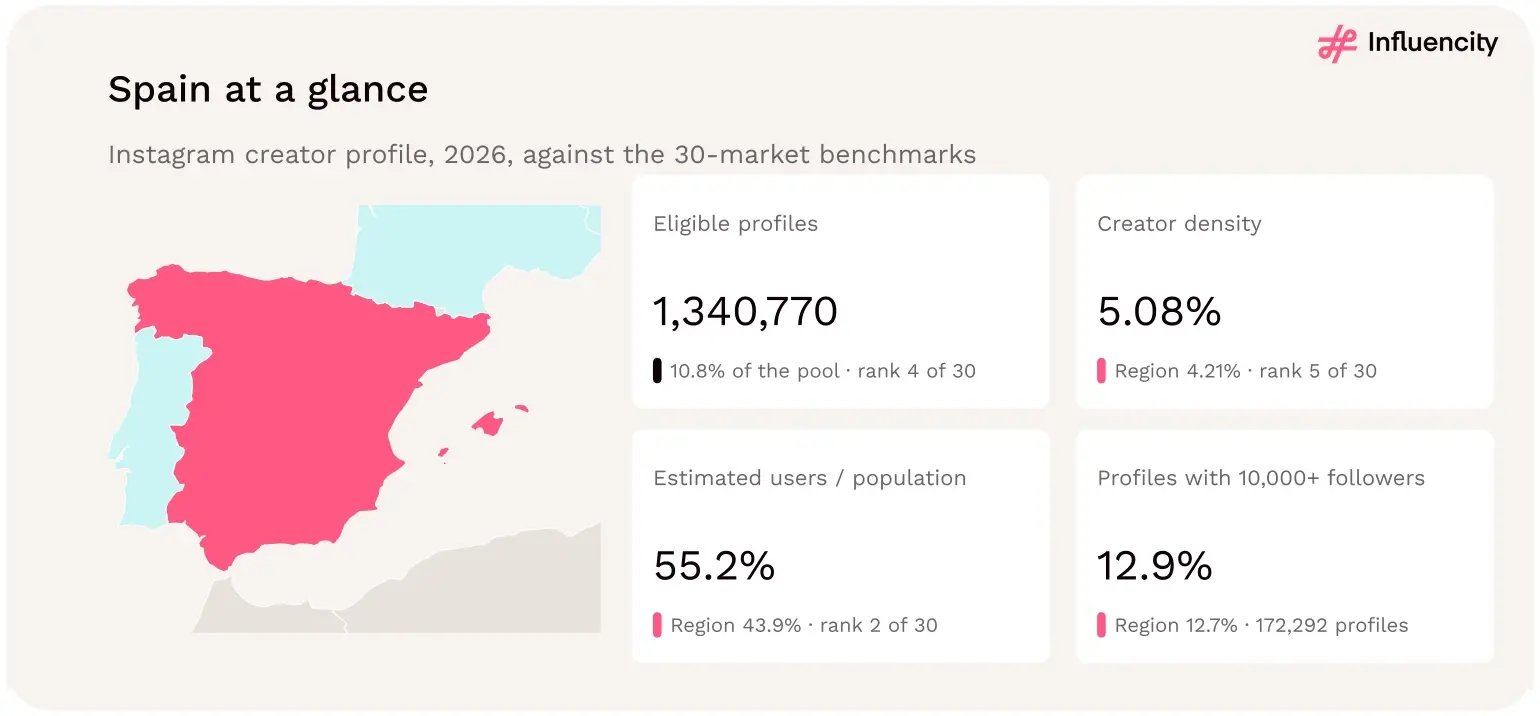
Figure 28 → Spain at a glance: above the 30-market benchmark on creator density, audience reach and established-creator share. Source: [1].
Spain records 1,340,770 eligible Instagram creator profiles and 26.4 million estimated Instagram users. Its creator density is 5.08%, while estimated Instagram audience penetration reaches 55.2% of the population reference. [1]
Spain ranks fourth in eligible creator count and fifth in creator density among the 30 markets.
It also has the highest estimated audience-to-population ratio among the six large markets examined here: its 55.2% is higher than the UK's 50.8%, Italy's 50.7%, Russia's 44.6%, France's 42.2% and Germany's 37.4%.
Across the full 30-market dataset, only Portugal has a higher audience-penetration ratio. This combination of audience penetration and creator supply makes Spain one of the clearest examples of a market where both measures are relatively high.
Spain has approximately 172,292 profiles with 10,000 or more followers. Its density of established creators is 6.53 per 1,000 estimated Instagram users, second only to the UK's 6.62 across the 30 markets. [1]
That matters because Spain's creator ecosystem is not defined solely by its nano population. Its established-creator supply is substantial relative to the size of its estimated Instagram audience.
Compare Spain with France:
As in the Italy–Germany comparison, the apparent difference between markets narrows when the analysis moves beyond the headline pool.
Together, Italy and Spain account for 24.2% of all eligible profiles in the 30-market study but only 19.1% of estimated Instagram users. Their combined creator density is 5.32%, above the regional benchmark of 4.21%. [1]
Reading the study. The two countries therefore contribute a disproportionately large share of recorded creator supply relative to their estimated audiences. This is a useful planning observation for brands operating across Southern Europe.
However, their combined figures should not erase differences in language, audience location, content conventions or commercial practices.
What should brands and agencies do? For Spanish campaigns, use the country's substantial estimated audience penetration as context for Instagram's importance, while using creator density and tier counts to structure discovery.
For campaigns spanning Spain and Italy, build separate market shortlists before comparing them.
A shared campaign objective does not require identical creators, formats or audience assumptions in every country.
Spain combines three distinct advantages in the dataset: substantial estimated audience penetration, above-benchmark creator density, and one of Europe's highest concentrations of established creators per user.
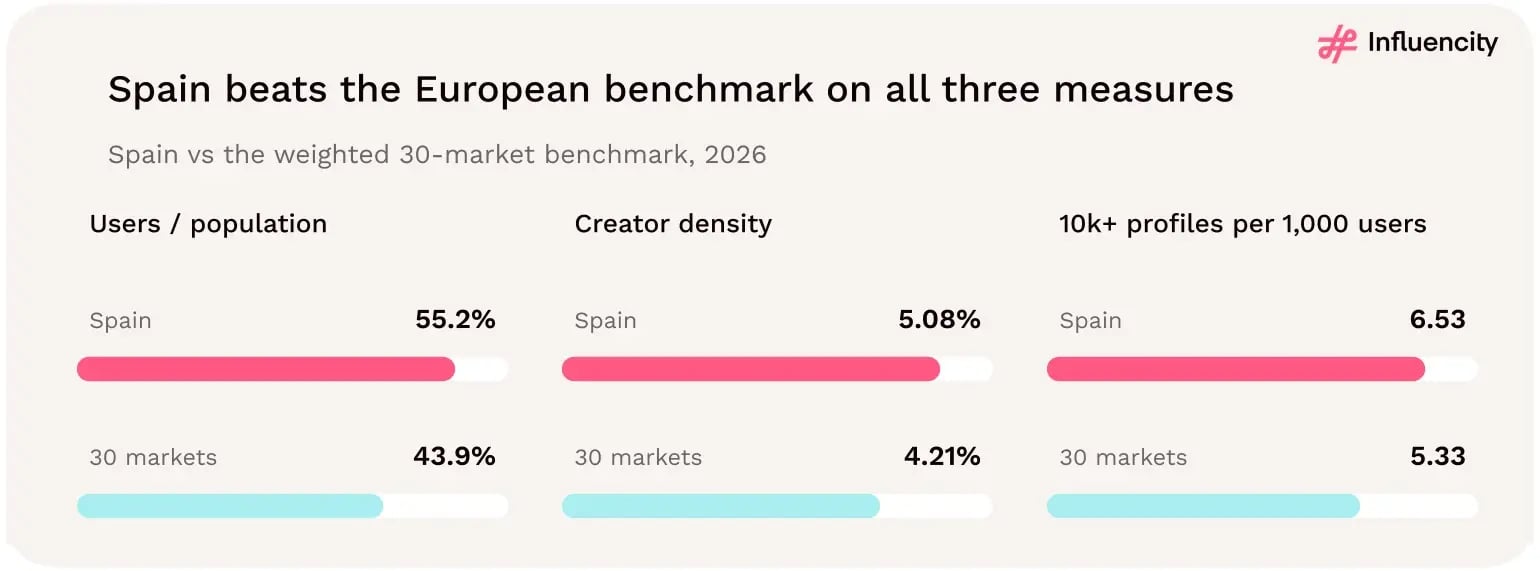
Figure 29 → Spain exceeds the European benchmark for estimated audience penetration, creator density and established creators per user. Source: [1].
Spain is not merely a high-density creator market. It also has strong estimated Instagram penetration and a substantial established-creator pool relative to its audience.
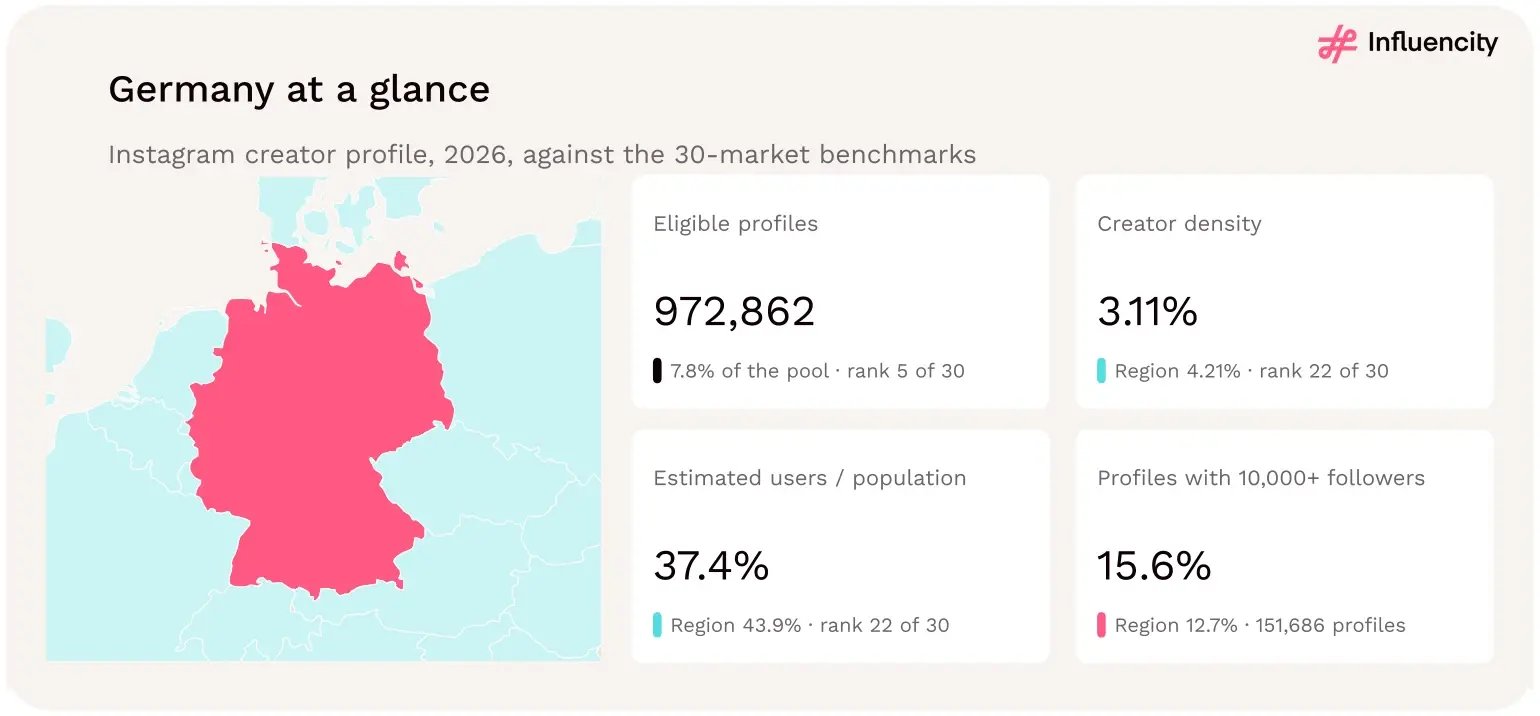
Figure 30 → Germany at a glance: a large estimated audience, below-benchmark creator density and an above-benchmark established-creator share. Source: [1].
Germany has 972,862 eligible Instagram creator profiles and an estimated Instagram audience of 31.3 million users. Its creator density is 3.11%, below the regional benchmark of 4.21%. [1]
Despite having approximately 1.4 million more estimated Instagram users than Italy, Germany has 683,534 fewer eligible creator profiles. The difference is substantial, but it is not evenly distributed across follower tiers.
As the Italy comparison shows, nano profiles explain approximately 96% of the difference in creator density between the two markets. Germany's lower overall density therefore should not be interpreted as an equally large deficit at every creator size.
Approximately 15.6% of Germany's eligible profiles have 10,000 or more followers, compared with 12.7% across the full 30-market dataset.
Among the ten largest markets, Germany ranks second on this measure, behind France. [1] Its recorded pool includes approximately 151,686 profiles with 10,000+ followers.
This creates an important distinction between relative creator supply and follower-tier composition. Germany has fewer eligible profiles relative to Instagram users than Italy or Spain, but a larger proportion of its eligible profiles sit above the 10,000-follower threshold.
What should brands and agencies do? Use the 10K+ profile count when planning campaigns involving established creators.
For nano-led programs, assess the size of the relevant pool after applying category, language, geography and audience-quality filters.
Do not assume that Germany's lower density implies weaker performance, higher prices or less commercial opportunity. The dataset measures none of those outcomes.
Germany demonstrates why a lower creator-density ranking can coexist with a comparatively strong established-creator segment.
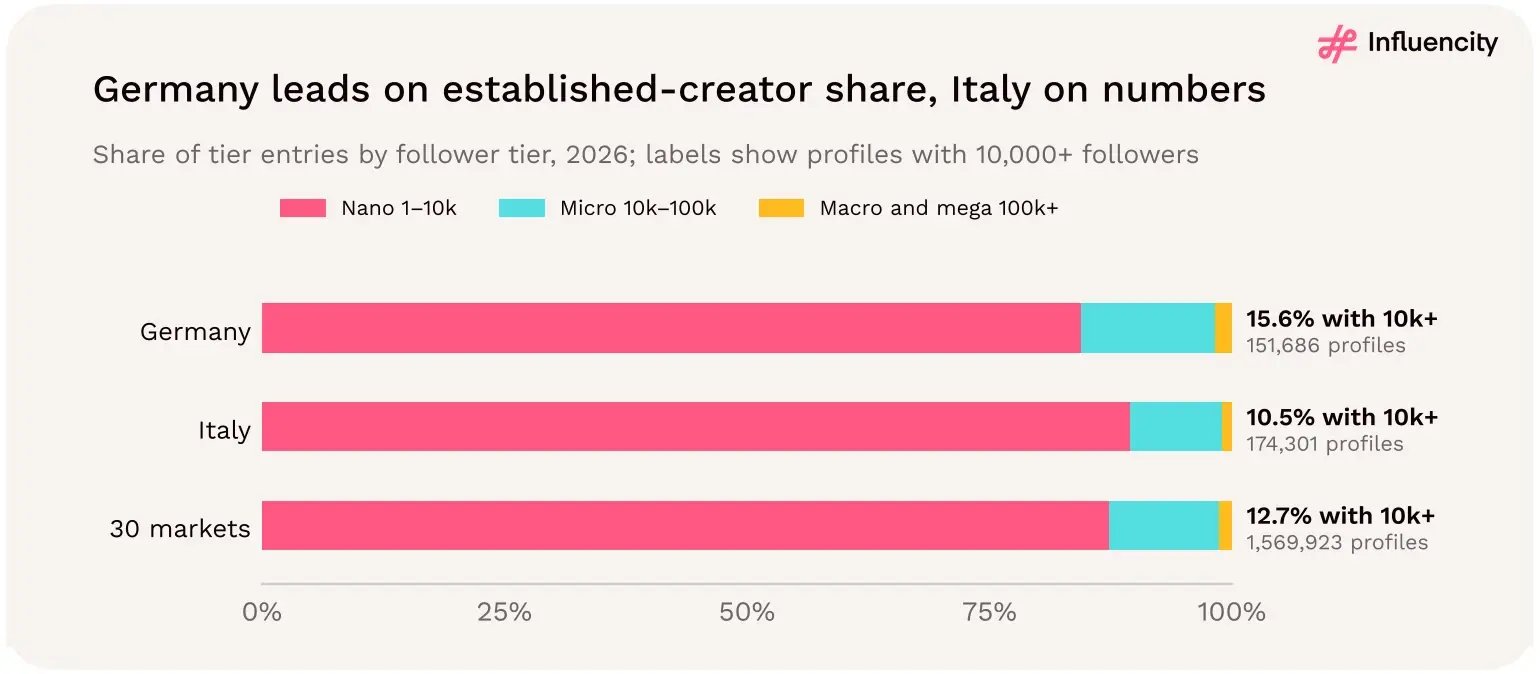
Figure 31 → Germany has lower overall creator density than Italy, but a higher proportion of established creators. Source: [1].
Germany's smaller relative creator pool should be evaluated alongside its comparatively high share of established creators.
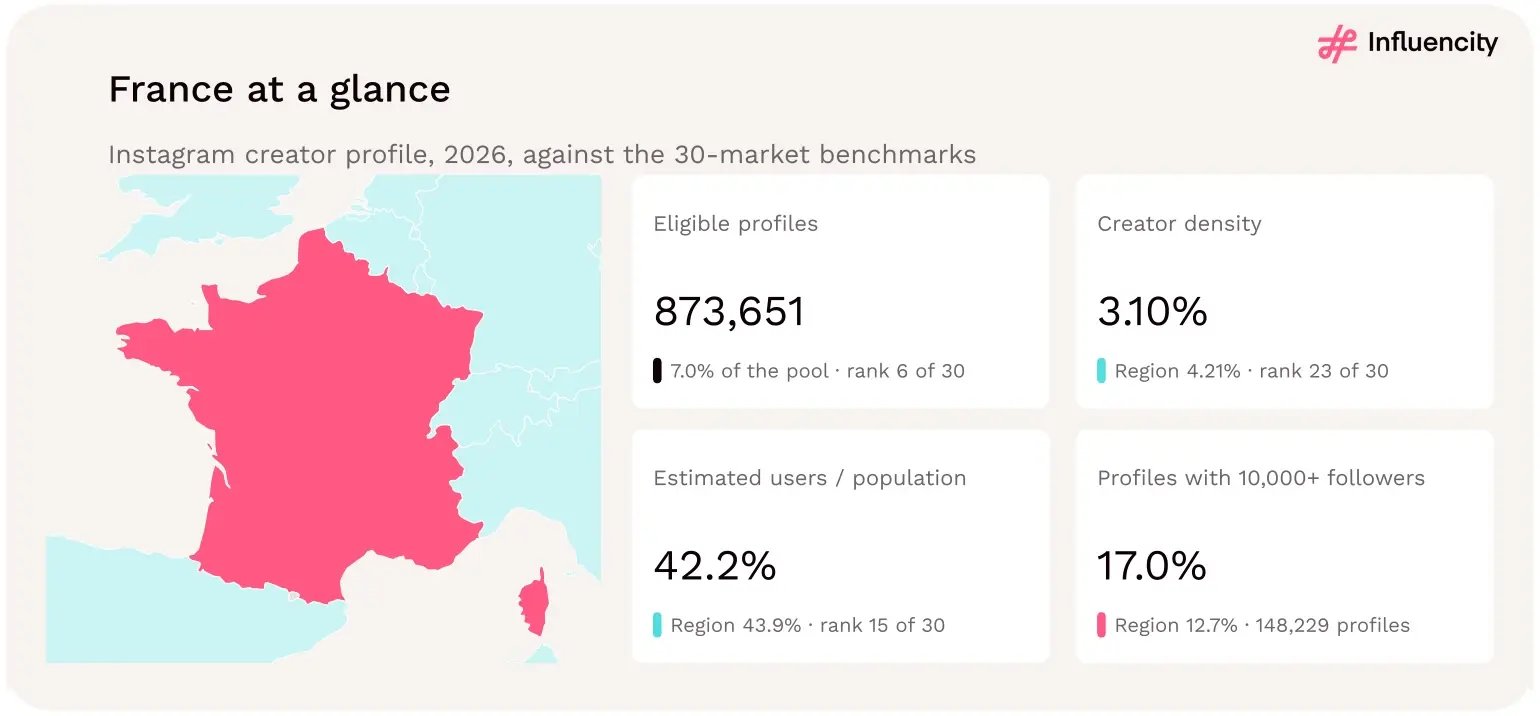
Figure 32 → France at a glance: the highest established-creator share in the study, with below-benchmark creator density. Source: [1].
France has 873,651 eligible Instagram creator profiles, an estimated audience of 28.2 million users, and a creator density of 3.10%. [1] Its overall density is almost identical to Germany's 3.11%. Yet France has a particularly distinctive follower-tier distribution.
17.0% of its eligible profiles have 10,000 or more followers, the highest proportion among all 30 markets in the study. This is one of the strongest examples of why a country-level creator ranking can obscure strategically relevant differences.
France's reported tier data contains approximately 148,229 profiles with 10,000+ followers. That is fewer than Russia, the UK, Italy, Spain or Germany in absolute terms.
But relative to its total eligible pool, France has the largest proportion of profiles above the 10,000-follower threshold.
The distinction is essential:
None of these metrics measures content quality, audience authenticity, campaign experience or performance.
Spain has approximately 1.34 million eligible profiles, compared with France's 873,651. That makes Spain's total pool about 1.53 times as large.
But Spain has approximately 172,292 profiles with 10,000+ followers, compared with France's 148,229. At that threshold, Spain's advantage narrows to approximately 1.16 times.
For a campaign that requires creators above 10,000 followers, the established-creator counts are more informative than the headline difference.
What should brands and agencies do? Treat France as a substantial established-creator recruitment market despite its below-benchmark overall density.
For campaigns requiring creators above 10,000 followers, begin with the relevant tier counts and then evaluate audience geography, content fit, recent activity, collaboration availability and expected rates.
For nano-focused programs, assess the eligible pool independently rather than assuming that France's established-creator composition makes it unsuitable.
France has the highest established-creator share in the study, yet one of the lowest overall densities among the six largest markets. Its position challenges the assumption that more creators per user automatically means more developed creator supply at every follower tier.
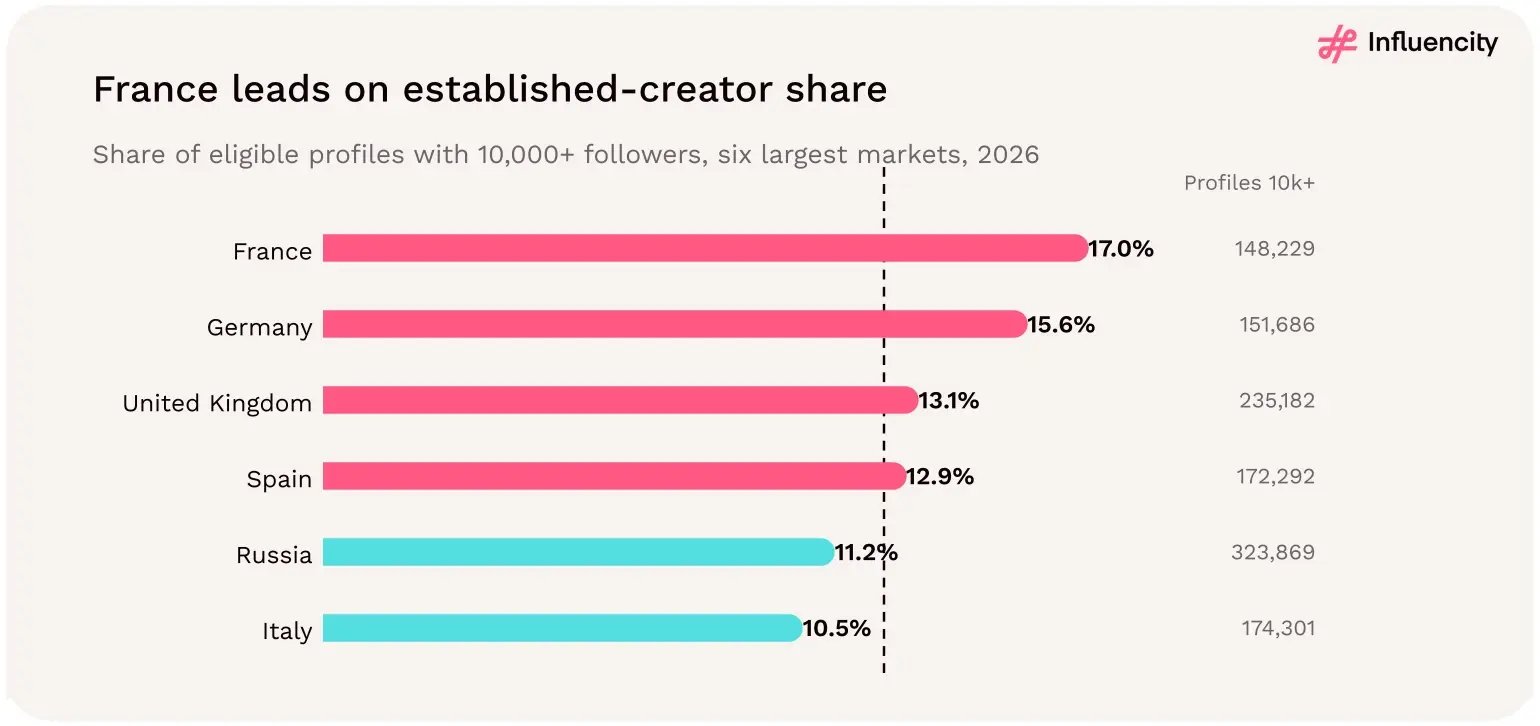
Figure 33 → France has the highest established-creator share among Europe's six largest Instagram markets—and among all 30 countries studied. Source: [1].
France's strategic distinction lies in the composition of its recorded creator pool, not its headline density.
The six-country comparison exposes a fundamental problem with treating creator markets as interchangeable.
A country can have a large eligible creator pool without having the highest creator density. It can have high creator density without having the highest proportion of established creators. And it can have substantial recorded supply without that supply being commercially accessible.
These differences produce several conclusions for European influencer marketing strategy.
Six markets contain 76.7% of eligible profiles, yet each has a different mix of scale, density, audience penetration and follower tiers.
A pan-European campaign built solely around total creator counts would heavily favor the largest markets.
That may be appropriate for some objectives, but it can also underrepresent commercially important smaller markets.
Reading the study. Planning tip: Set country-level discovery targets based on campaign objectives and audience priorities rather than distributing recruitment effort strictly in proportion to creator counts.
Across the 30 markets, creator density and nano density have a Spearman rank correlation of 0.98. The corresponding relationship between overall density and 10K+ density is weaker, at 0.73. [1] This suggests that country differences in overall creator density are particularly closely associated with differences in nano supply.
The Italy–Germany comparison makes that pattern concrete: approximately 96% of their density gap comes from nano profiles.
Reading the study. Planning tip: For seeding, UGC-style and other programs requiring many smaller creators, examine nano supply directly. For campaigns requiring established creators, use 10K+ counts or established creators per 1,000 estimated users.
France and Germany have lower overall creator density than Italy and Spain, but higher shares of profiles above 10,000 followers.
Among the ten largest markets, the study finds a strong negative rank correlation (−0.84) between overall creator density and the share of established creators. [1] This is an observed relationship within that group, not evidence that higher nano supply causes a smaller established-creator share.
Reading the study. Planning tip: Avoid describing one country as having a stronger or weaker influencer ecosystem based on a single metric. Specify whether the comparison concerns total profiles, creator density, or established-creator supply.
Spain illustrates why the distinction matters. Its estimated audience-to-population ratio is 55.2%, while its creator density is 5.08%. The first ratio provides context for Instagram's estimated reach relative to the population reference. The second describes eligible profiles relative to estimated Instagram users.
Neither measure establishes the number of unique residents using Instagram or the audience that a particular creator can reach.
Reading the study. Planning tip: Use audience penetration to contextualize market coverage, creator density to contextualize relative supply, and creator-level audience data to validate actual campaign targeting.
The data does not contain creator fees, campaign conversion rates, return on investment, response rates or engagement benchmarks. Those variables are necessary to assess whether one market offers better commercial outcomes than another.
A high-density country may offer a larger initial shortlist. A lower-density country may contain creators with a better fit for a particular brief. The study cannot determine which will deliver stronger results.
Reading the study. Planning tip: Treat national statistics as discovery inputs, then test campaign assumptions with creator-level data and comparable pilot results.
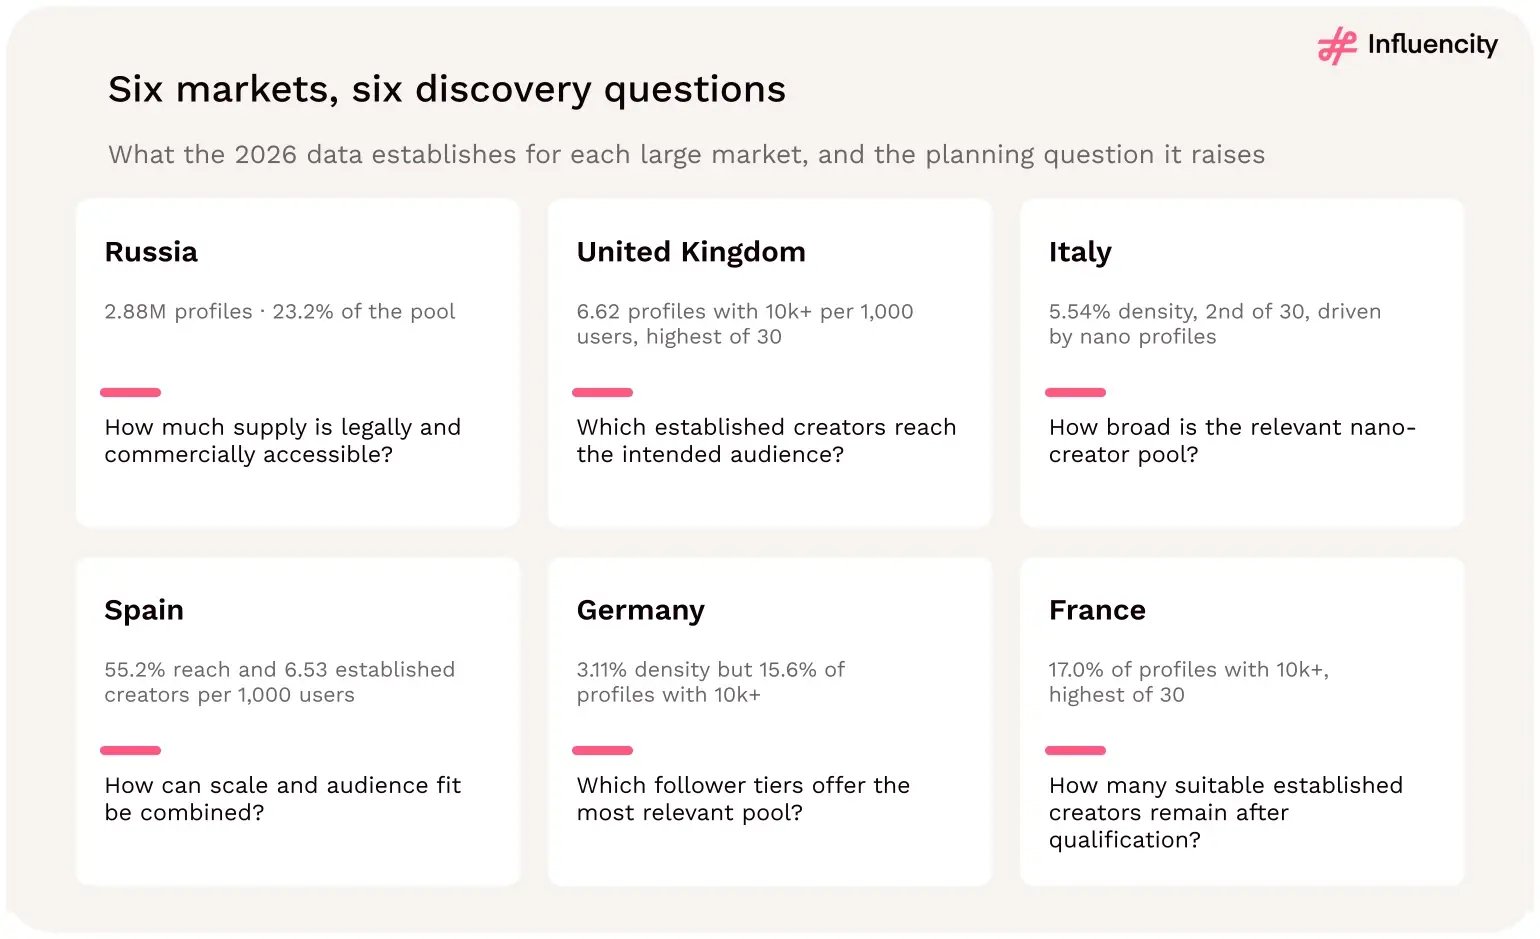
Figure 34 → Six large European Instagram markets require six different discovery questions. Source: [1].
Brands should use country-level creator statistics to estimate discovery scale, compare follower-tier supply, and design recruitment strategies, not to predict campaign performance.
The most effective approach is to move through four stages.
Begin with the commercial objective, the intended consumers, and the countries where the campaign needs to deliver results.
Use estimated Instagram audiences and population ratios for context, but do not treat them as verified unique reach.
Select the metric that matches the brief:
Female share among profiles classified as male or female. Values are rounded; percentage-point differences are calculated from unrounded values. Source: Influencity 2026 Europe dataset [1].
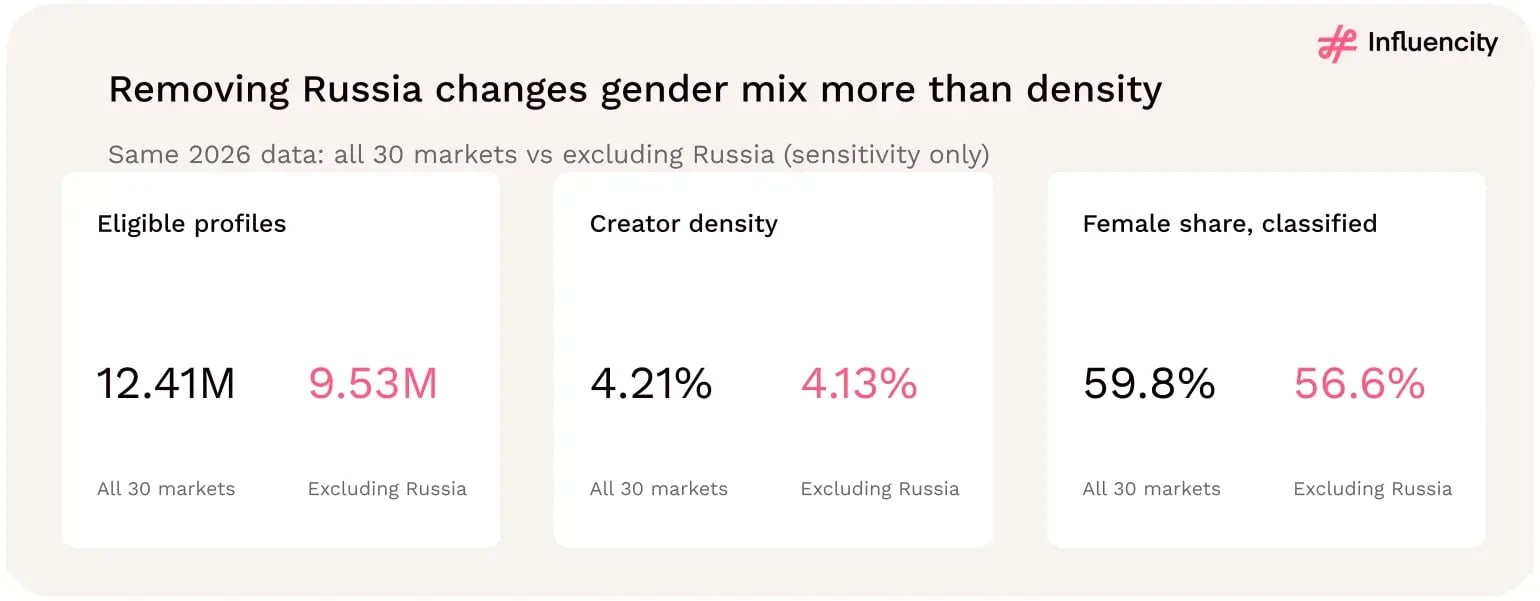
Figure 35 → Changing country coverage affects regional aggregates differently. A sensitivity analysis of the same 2026 Instagram dataset. Source: [1].
Excluding Russia reduces the regional eligible creator count by approximately 23.2%, from 12.41 million to 9.53 million. The estimated Instagram audience falls from 294.5 million to 230.6 million.
This is a substantial change in absolute market scale. Any discussion of the size of Europe's recorded creator ecosystem should therefore specify whether Russia is included.
For brands comparing recruitment universes across regions, the distinction is particularly relevant. A figure of 12.41 million profiles describes a different geographic pool from one of 9.53 million, even though both are derived from the same underlying study.
Despite the removal of almost 2.9 million profiles, Europe's aggregate creator density moves only from 4.21% to 4.13%. That is a difference of just 0.08 percentage points. Why?
Because excluding Russia removes both eligible creator profiles and estimated Instagram users. Russia's own creator density of 4.51% is only moderately above the full regional benchmark.
Its inclusion increases the aggregate density, but not dramatically. This illustrates why absolute counts and relative ratios can respond differently to a change in geographic coverage.
Reading the study. Russia has a major effect on how large the European creator market appears, but only a modest effect on how concentrated that supply is relative to estimated Instagram users.
The female share among male/female-classified profiles falls from 59.8% to 56.6% when Russia is excluded. That is a shift of approximately 3.2 percentage points, far larger than the change in creator density.
The explanation lies in Russia's demographic composition within the dataset. Russia has a classified female share of approximately 71.2%, compared with 59.8% across all 30 markets. Its large creator population therefore has a disproportionate influence on the regional gender calculation. [1]
This does not mean the underlying gender characteristics of any other country have changed. Only the countries included in the aggregate have changed.
It is also important to preserve the study's classification limitation: these percentages refer to profiles classified as male or female, not all eligible profiles, and should not be interpreted as a complete representation of gender identity.
The scope decision also affects the Europe–United States comparison discussed in section 13. Even after Russia is excluded, the remaining 29 European markets contain 9.53 million eligible profiles, approximately 6.5% more than the US comparison pool used in the study. [1, 5]
This is an important qualification to the argument that Europe's creator ecosystem is large because Russia is included. Russia substantially increases Europe's absolute total, but the remaining European markets still collectively exceed the US comparison count.
However, the comparison should not be interpreted as proof of greater influencer marketing maturity, commercial opportunity, or campaign performance. It remains a comparison of recorded eligible profiles under the respective study definitions.
What should researchers and campaign planners do? For regional reporting, specify the country coverage alongside the headline statistic.
For international comparisons, use consistent scope definitions wherever possible, and disclose when they differ.
For demographic interpretation, consider sensitivity calculations when one large country has a substantially different profile composition.
For campaign planning, evaluate commercial accessibility separately from recorded supply.
Geographic scope affects different metrics by different amounts. Russia's inclusion substantially changes Europe's creator count and classified gender composition, but only slightly changes aggregate creator density.
Reading the study. Planning tip: When presenting European influencer market data to stakeholders, show the 30-market benchmark as the primary result and the 29-market calculation excluding Russia as a clearly labeled sensitivity scenario. This preserves the study's scope while making its influence transparent.
Smaller countries are easily overlooked in regional rankings because their absolute creator counts cannot compete with those of Russia, the UK, Italy, or Spain. Yet absolute size is only one dimension of a creator ecosystem.
A market with 40,000 eligible profiles may have a higher creator density than a market with nearly one million. A country with fewer recorded creators may also have higher estimated Instagram audience penetration.
These distinctions can be relevant to campaigns targeting local audiences, specific languages, or tightly defined geographic communities.
They do not automatically make smaller markets more attractive. They indicate that small-market analysis requires more than a ranking by total profiles.
Three questions are particularly useful:
The first two questions can be explored using this study. The third requires creator-level and commercial evidence.
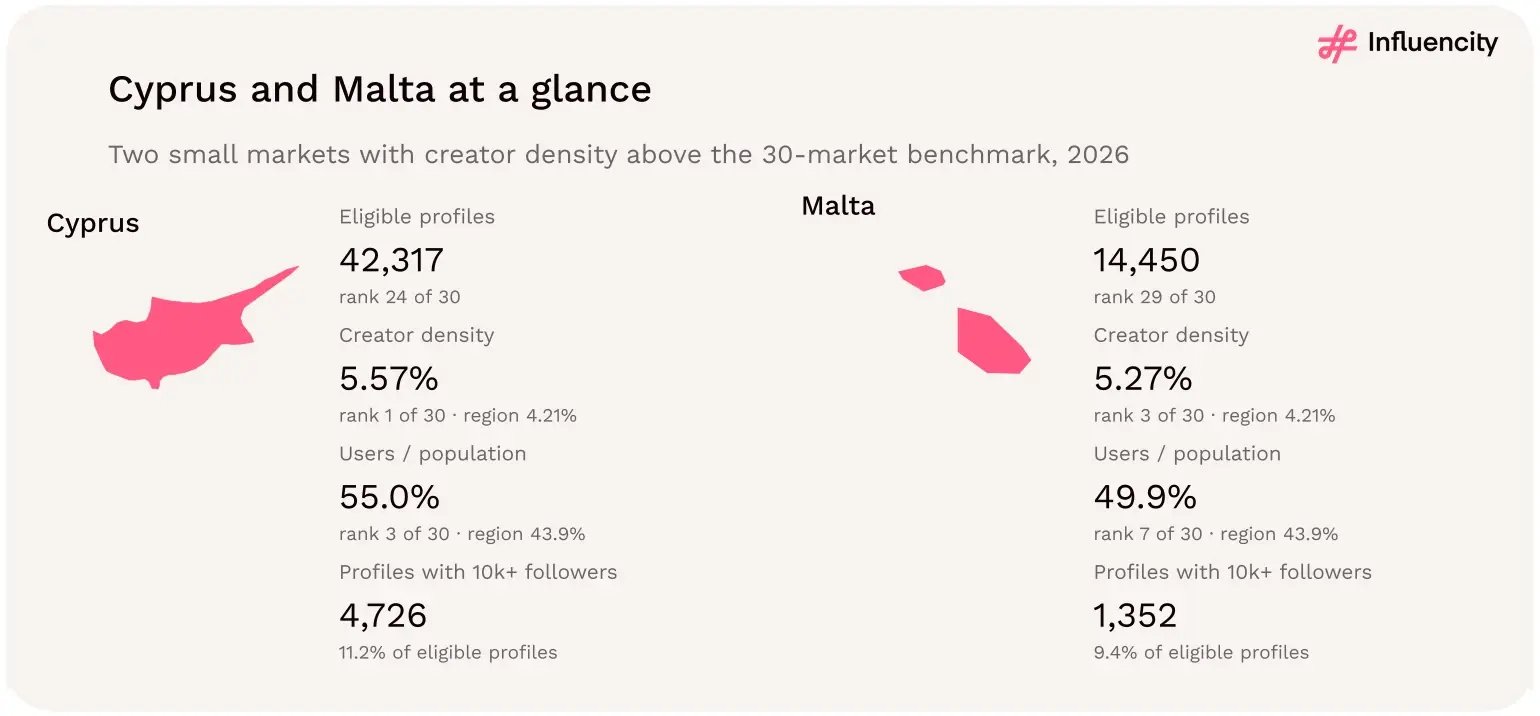
Figure 36 → Cyprus and Malta at a glance: two small markets with creator density above the 30-market benchmark. Source: [1].
Cyprus and Malta demonstrate why creator density and creator count should never be treated as equivalent measures. Cyprus records 42,317 eligible Instagram creator profiles, while Malta records 14,450. [1]
Neither market approaches the absolute scale of the largest European creator ecosystems. Yet their relative creator concentrations make them noteworthy in the regional comparison. Cyprus has the highest creator density among the study's 30 markets, at 5.57%, narrowly ahead of Italy's 5.54%.
This means Cyprus has a high number of eligible creator profiles relative to its estimated Instagram audience—not that it has a larger or more commercially valuable creator market than Italy.
Cyprus illustrates the distinction between market intensity and market volume. Its 5.57% creator density is approximately 32% above the regional benchmark of 4.21%. But its absolute pool of 42,317 eligible profiles is only about 2.6% of Italy's 1.66 million.
Both figures can be true because they answer different questions. Cyprus has a higher creator-to-user ratio, while Italy offers a much larger recorded discovery universe.
Reading the study. For a campaign specifically targeting Cyprus, the country's high density may justify a focused search for relevant local creators. For a campaign requiring hundreds of collaborators across several categories, its much smaller absolute pool becomes a more important constraint.
Cyprus leads the density ranking, but that does not make it Europe's largest influencer market. Its position is a reminder that relative concentration and absolute capacity are different characteristics.
Malta's 14,450 eligible profiles represent a comparatively small recruitment universe. For a local campaign, this may still provide a useful starting point for discovery.
However, once a brand applies requirements for language, audience geography, content category, follower tier, engagement quality, and collaboration availability, the qualified shortlist may be considerably smaller than the headline count.
The study does not establish how many Maltese profiles would meet any particular campaign brief. That number must be determined through creator-level discovery.
What should brands and agencies do? Use creator density to understand the relative size of the ecosystem, but begin operational planning with the absolute number of eligible profiles.
Then assess audience location, creator relevance, available follower tiers, collaboration feasibility, and expected costs.
For campaigns requiring a large number of creators, establish recruitment feasibility before finalizing deliverables or timelines.
Reading the study. Planning tip: In Cyprus and Malta, prioritize a qualified-creator count over a density ranking. A shortlist of 50 suitable and available creators is more actionable than a national density percentage, provided the shortlist has been validated against the campaign brief.
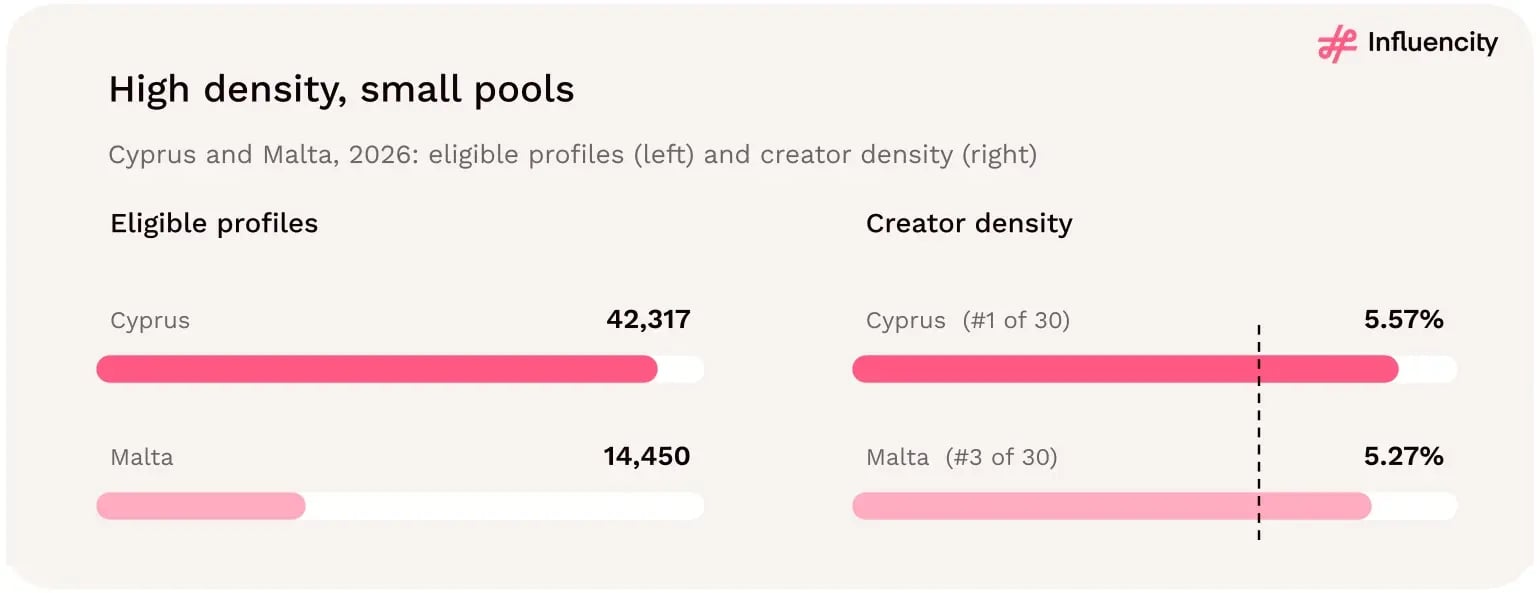
Figure 37 → Smaller markets can have high relative creator supply without large absolute recruitment pools. Source: [1].
Cyprus and Malta show why high creator concentration should be interpreted alongside absolute market size and the availability of qualified creators.
Portugal, Greece and the Netherlands occupy an interesting middle ground in the European creator landscape. Their eligible creator populations are substantial enough to support meaningful discovery, but they remain far smaller than the continent's largest markets.
More importantly, each country leads the other two on a different metric.
This comparison illustrates why market selection should begin with a campaign objective rather than a generic ranking.
Portugal records 302,624 eligible creator profiles and an estimated Instagram audience-to-population ratio of 61.1%. [1] That is the highest estimated audience penetration in the full 30-market study.
This is an important contextual finding: relative to the population reference used in the study, Portugal has an especially large estimated Instagram audience. However, estimated audience penetration should not be interpreted as verified unique-person reach.
Instagram audience estimates may include account-level effects and methodological differences, and the study does not establish that every estimated account corresponds to a unique resident. Nor does high penetration demonstrate that Portuguese creators achieve better engagement or conversions.
It supports considering Instagram as an important channel when planning campaigns for Portuguese audiences.
But brands still need to evaluate whether the creators under consideration reach the intended demographic and geographic segments.
A high national audience-to-population ratio does not eliminate the need for creator-level audience validation.
Reading the study. Planning tip: Use Portugal's penetration figure to contextualize platform relevance, then assess audience geography and demographic fit before selecting creators.
Portugal stands out for estimated Instagram audience penetration, not for having the largest creator pool among the three markets.
Greece has 239,580 eligible Instagram creator profiles and a creator density of 5.21%. [1] That is the highest density among Portugal, Greece and the Netherlands. Greece's figure is also above the 30-market regional benchmark of 4.21%. Its position illustrates a different kind of relative market strength from Portugal's.
Portugal leads on estimated audience penetration. Greece leads on creator profiles relative to estimated Instagram users. These measures are not interchangeable.
A higher density indicates a larger eligible creator pool relative to the estimated Instagram audience. For a campaign targeting Greece, this can support broad initial discovery across creator categories and follower tiers.
However, density does not establish how the pool is distributed by niche, audience quality, commercial availability or price. A campaign requiring a narrow type of creator may still face recruitment constraints.
Reading the study. Planning tip: Use Greece's high density as a reason to investigate a broad initial shortlist, then narrow it using audience, content and commercial criteria.
Greece has the strongest relative creator concentration of these three markets, although it has the smallest absolute eligible pool.
The Netherlands records 336,304 eligible Instagram creator profiles, more than Portugal's 302,624 and Greece's 239,580. [1] That makes it the largest discovery universe among these three countries by recorded eligible profiles. The difference is meaningful, but it should not be overstated.
The Netherlands has approximately 11% more eligible profiles than Portugal and approximately 40% more than Greece. These comparisons establish relative scale, not superior campaign performance.
A larger recorded pool may provide more starting points for discovery across categories, locations and follower tiers. But the number of profiles that match a campaign brief may differ substantially from the total.
Brands should therefore distinguish between the size of the initial search universe and the number of qualified, reachable creators.
Reading the study. Planning tip: When comparing the Netherlands with Portugal or Greece, use absolute creator counts to scope discovery, but make the final market decision using qualified shortlist sizes and audience evidence.
The Netherlands offers the largest recorded creator pool of the three markets, but that advantage must be tested against campaign-specific requirements.
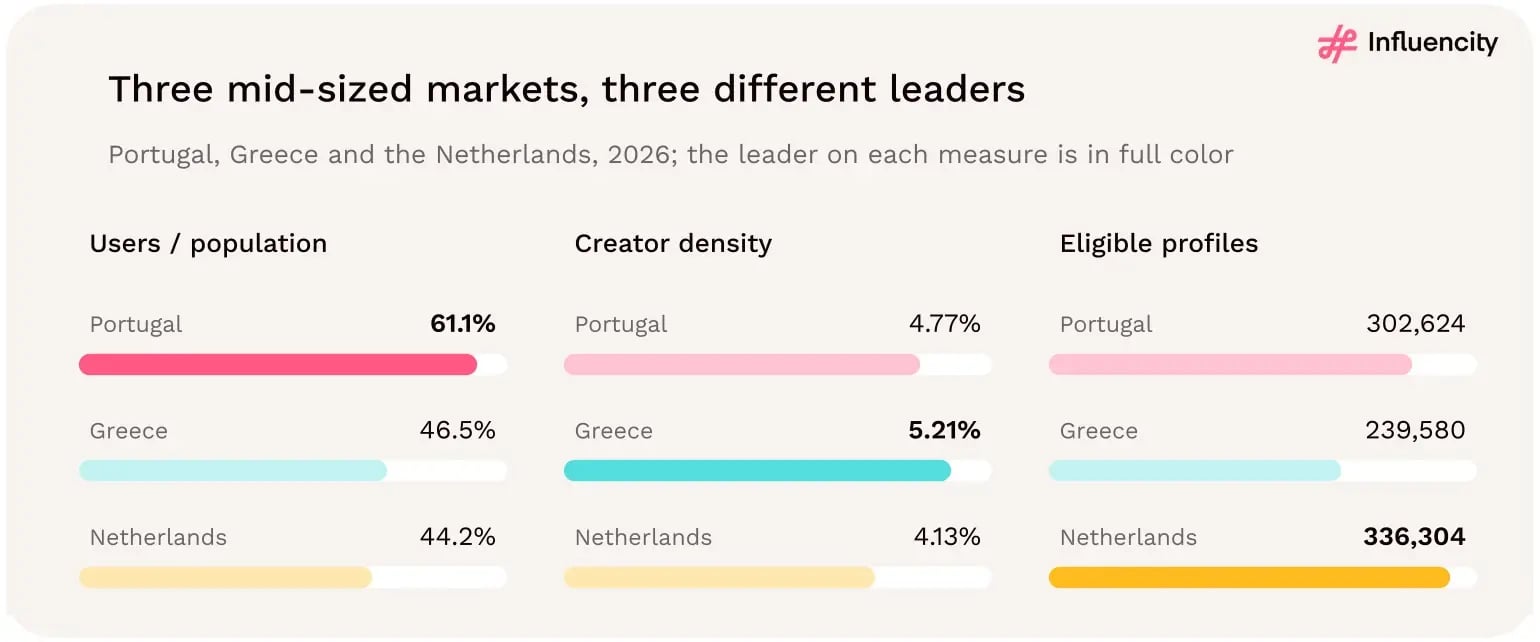
Figure 38 → Portugal, Greece and the Netherlands lead on different measures of Instagram market scale and concentration. Source: [1].
The smaller-market comparison reinforces several findings from the study's larger country analysis.
Cyprus has the highest creator density in the dataset, yet its eligible profile count is far below those of Italy, Spain or the United Kingdom.
Greece similarly leads Portugal and the Netherlands on density while having the smallest absolute pool of the three. Density measures relative supply. Count measures absolute supply. Both are needed for a meaningful comparison.
Portugal's 61.1% estimated audience penetration makes it distinctive. But that metric describes estimated Instagram users relative to a population reference, not eligible creator profiles relative to Instagram users.
Platform audience penetration and creator density describe different relationships and should not be used as substitutes.
A market does not need millions of creators to be worth considering. For a campaign targeting a specific country, language community or local audience, a smaller creator ecosystem may contain suitable collaborators.
The relevant question is whether enough qualified creators exist to meet the brief. Commercial relevance depends on campaign requirements, not the country's position in a Europe-wide ranking.
A high density percentage can create an impression of abundant supply. But in a small market, the absolute number of creators may still limit recruitment once audience, niche, language, quality and availability requirements are applied.
Vet the qualified pool before committing to creator volumes or campaign timelines.
The 30-market European total, the 29-market sensitivity scenario, and individual country rankings are all valid within their stated definitions.
Problems arise when those definitions are omitted or when statistics from different geographic scopes are compared without qualification. Transparent methodology is part of useful market intelligence, not a footnote to it.
For smaller and mid-sized markets, the most useful approach is to move from regional statistics to campaign-specific feasibility.
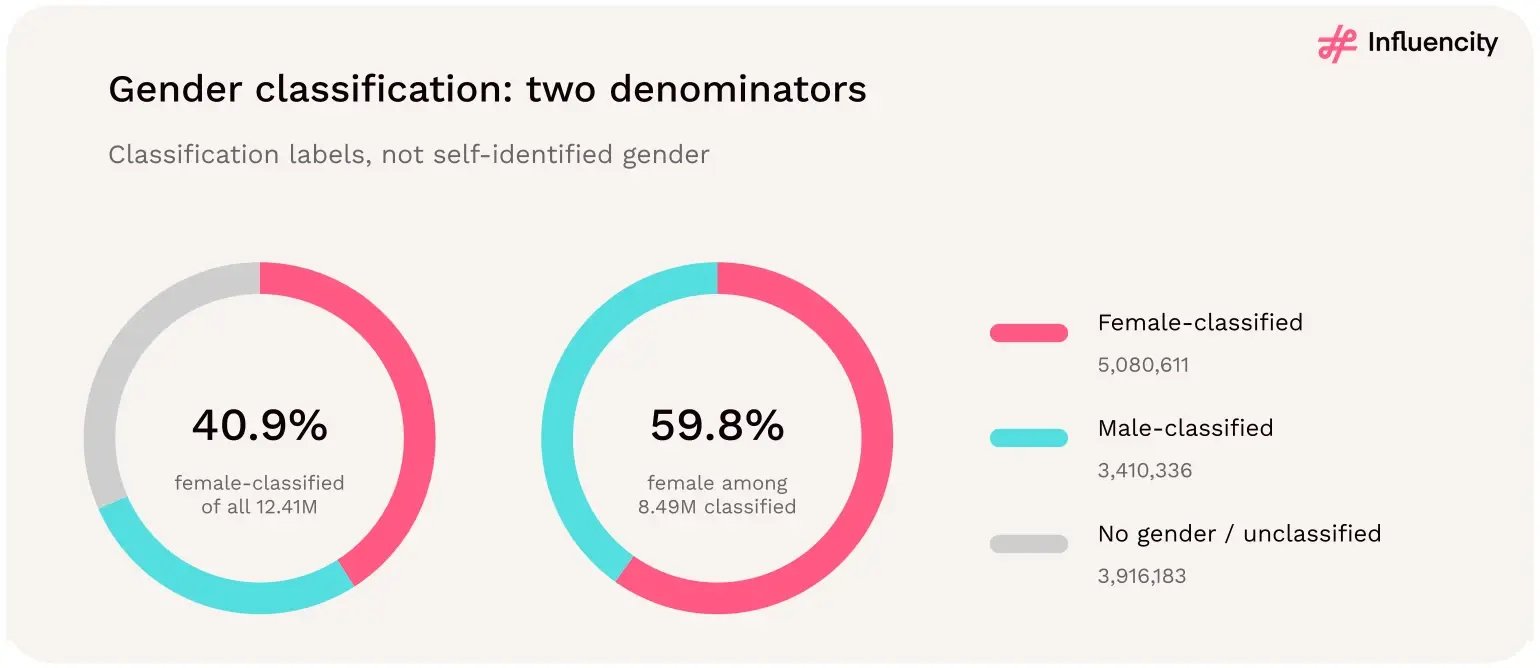
Figure 39 → Classified-only gender shares differ from shares of all eligible Instagram profiles. Source: [1].
Two different statements are therefore accurate, but they mean different things:
59.8% of female/male-classified European Instagram creator profiles are female-classified.
40.9% of all eligible European Instagram creator profiles are female-classified.
The first describes the balance within the classified subset. The second describes the proportion of the entire recorded pool that received a female classification.
Neither should be rewritten as a definitive claim about the gender identities of all European Instagram influencers.
Reading the study. A demographic percentage is only as interpretable as its denominator. In this study, the classified-only distribution and the all-profile distribution answer different questions.
The European and US classified-only gender distributions are strikingly similar. In Europe, 59.8% of female/male-classified profiles are female-classified. In the United States, the equivalent figure is 60.2%. [1, 5]
That is a difference of less than half a percentage point. At first glance, the figures suggest a comparable female-majority pattern in the classified creator populations of both regions.
But a second comparison reveals an important difference in the data.
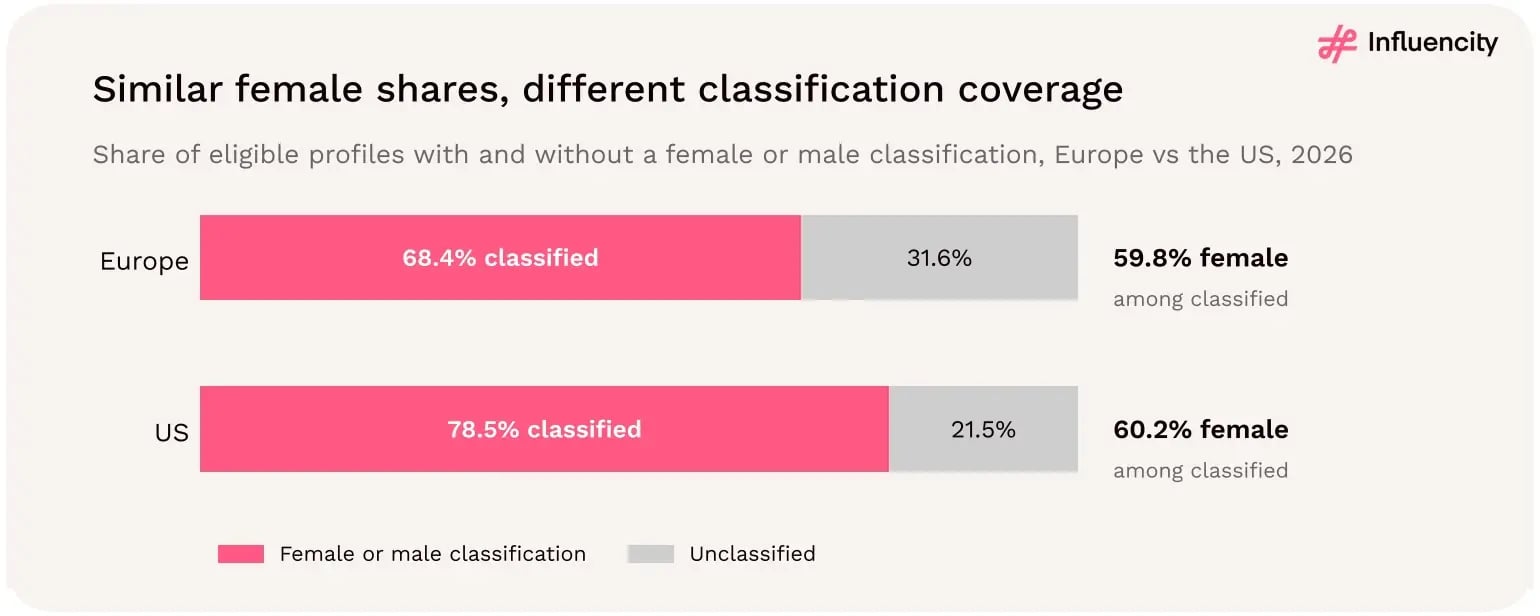
Figure 40 → Europe and the US have similar classified-only female shares, but different levels of gender classification coverage. Sources: [1, 5].
The two regions show similar female-majority patterns within their classified subsets, but Europe has substantially more unclassified profiles.
Female-classified profiles form the majority of the classified subset, but the dataset does not assign a female or male classification to nearly one-third of eligible profiles.
All 30 country totals have more female- than male-classified profiles. Switzerland has only 78 more female-classified profiles than male-classified profiles; Greece has 380 more. Both should be described as near parity. Classification is a dataset attribute, not self-reported identity or evidence of interests, purchasing power, content category, effectiveness or audience composition. [1]
These figures show that a female-classified majority is present across the study footprint, but its magnitude is not uniform. They also demonstrate why classification coverage should be considered alongside the female share.
Russia has a 71.2% female share among classified profiles, the highest figure in the study. At the same time, 35.0% of all eligible Russian profiles are unclassified.
This combination deserves careful interpretation. The classified subset has a pronounced female majority, but more than one-third of the country's total eligible pool has no gender classification.
Russia's size also gives its classified distribution considerable weight in the European aggregate. As shown in section 07, excluding Russia reduces the regional classified female share from 59.8% to 56.6%.
The finding therefore matters at two levels: it describes Russia's classified profile composition and helps explain the composition of the broader regional statistics.
Reading the study. Country insight: Russia's classified female majority is substantial, but its high unclassified share and large contribution to regional totals make methodological context essential.
Lithuania records a 70.2% female share among classified profiles, while Poland records 69.8%. Their classified distributions are similar. Their unclassified shares, however, differ: 30.9% in Lithuania versus 25.6% in Poland.
That is a difference of 5.2 percentage points in classification coverage. The comparison illustrates a recurring limitation of demographic rankings: two countries can have nearly identical classified-only percentages while differing in the proportion of profiles for which the classification is available.
Reading the study. Country insight: Lithuania and Poland exhibit similarly high female-classified shares, but the share of unclassified profiles is lower in Poland.
Romania has a 69.1% female share among classified profiles, alongside an 18.0% unclassified share. Among the six country examples highlighted here, Romania has the lowest proportion of unclassified profiles.
That means 82.0% of its eligible profiles receive a female or male classification. This provides a broader classified subset than in Russia, Lithuania, or Switzerland. It does not establish that individual classifications are more accurate. It establishes that fewer profiles are left without a classification.
Reading the study. Country insight: Romania combines a pronounced female-classified majority with comparatively high classification coverage.

Figure 41 → Countries with similar classified female shares can differ substantially in gender classification coverage. Source: [1].
Switzerland and Greece have the most nearly balanced female/male-classified distributions among the country examples in this section. Switzerland records 50.04% female-classified profiles, while Greece records 50.11%.
The differences in absolute classified profile counts are exceptionally small:
Both countries technically have female-classified majorities. But describing either as a strongly female-dominated creator market would be misleading. Their distributions are much more accurately characterized as near parity.
A percentage slightly above 50% establishes a numerical majority, but it does not necessarily establish a meaningful imbalance. Switzerland's female share exceeds 50% by just 0.04 percentage points. Greece's exceeds it by 0.11 percentage points. Those differences are too small to justify sweeping interpretations about the gender composition of their creator ecosystems.
The unclassified shares reinforce the need for caution. Switzerland has 36.5% unclassified profiles, while Greece has 27.6%. The near-parity finding applies to their classified subsets, not necessarily to their entire eligible creator populations.
What can brands conclude from near parity? They can conclude that the recorded female/male-classified profile counts are almost evenly divided. They cannot conclude that the markets are equally balanced across content categories, follower tiers, audience demographics, or campaign participation. Those would require additional data.
The difference between 50.04% and 71.2% is not simply a matter of ranking countries. It represents fundamentally different classified distributions. Switzerland is effectively balanced within its classified subset; Russia is not.
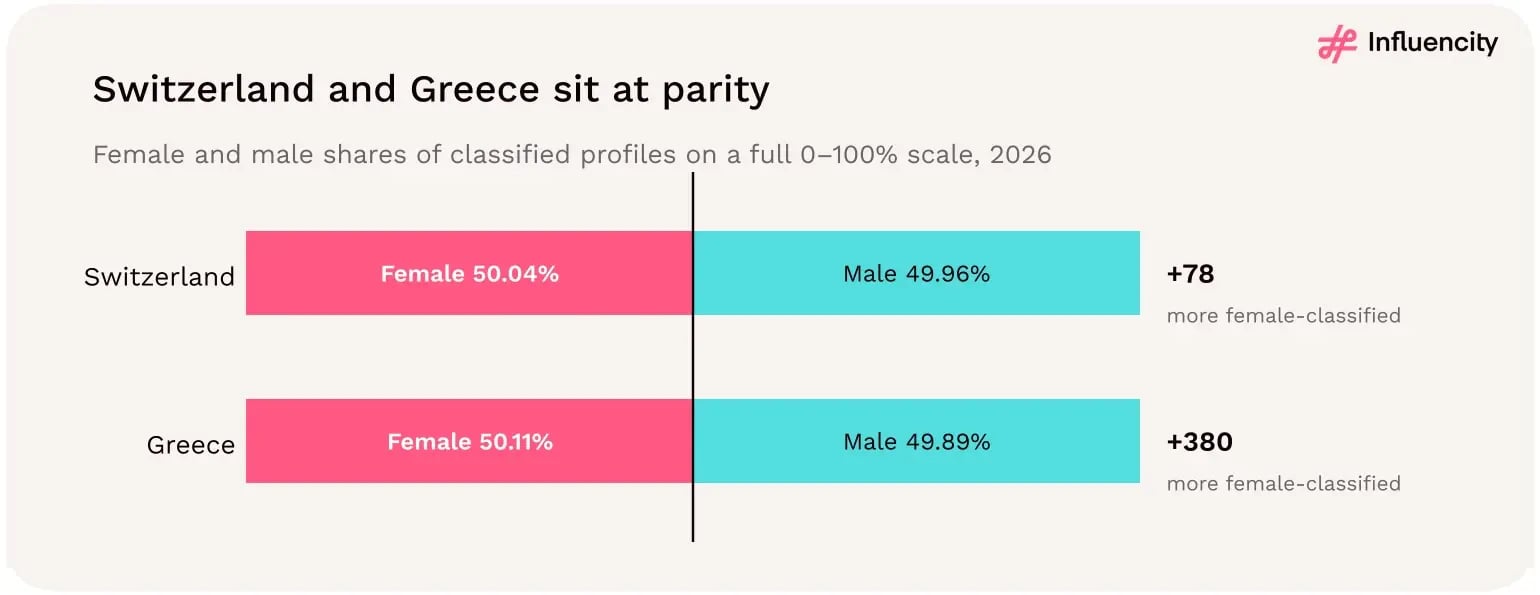
Figure 42 → Switzerland and Greece are effectively at parity among female/male-classified Instagram creator profiles. Source: [1].
A numerical majority is not necessarily a substantial demographic difference. Switzerland and Greece should be described as near-parity markets.
The 3,916,183 unclassified profiles are not a marginal detail. They represent nearly one-third of the study's eligible European creator population.
Their presence is one of the most important methodological considerations in gender analysis.
The category means that the dataset does not contain a female or male classification for those profiles. It should not be treated as a third gender identity. Nor should it be assumed to consist primarily of nonbinary creators, organizations, anonymous accounts, or any other specific group.
The classification counts do not establish why individual profiles are unclassified.
Likewise, a female or male classification is a dataset attribute. It is not necessarily a self-reported statement of gender identity. These distinctions matter because classification systems describe the information available in a dataset, not the full complexity of the people or entities behind the profiles.
The study cannot answer that question from the classification counts. It would be inappropriate to assume that unclassified profiles follow the same female/male proportions as classified profiles.
That assumption would require evidence about how classifications are assigned and why profiles remain unclassified. It would also be inappropriate to distribute unclassified profiles proportionally across female and male categories simply to create a complete-looking demographic table.
Doing so would replace an observed data limitation with an unsupported estimate.
The unclassified share varies across countries. Among the examples presented here, Romania has 18.0% unclassified profiles, while Switzerland has 36.5%.
That difference affects how much of each country's eligible creator pool is represented in the classified-only gender distribution.
A country with a high classified female share and a high unclassified share should not automatically be described as having a more female creator population than a country with a lower classified female share and broader classification coverage.
The observed classified percentages can be compared, but claims about the entire population require additional evidence.
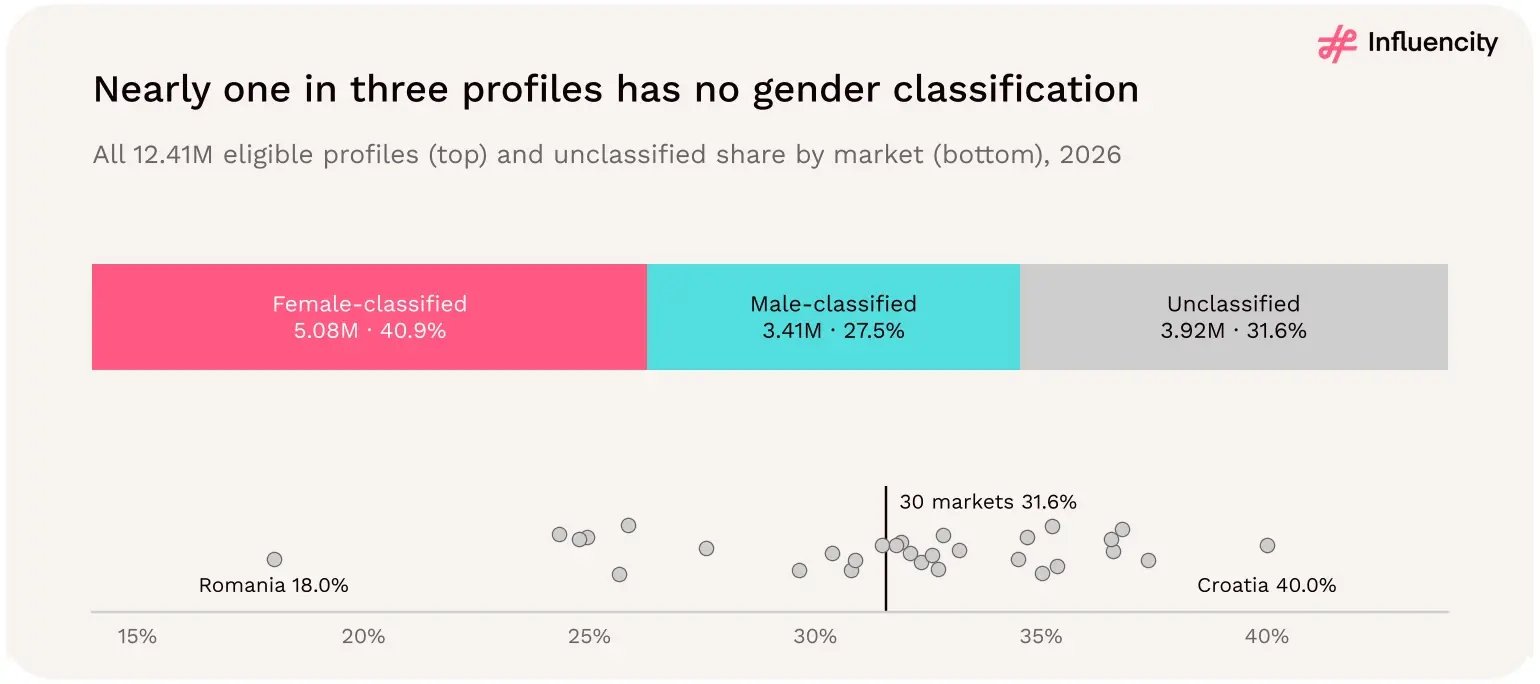
Figure 43 → Nearly one in three eligible European Instagram creator profiles has no gender classification. Source: [1].
No. A creator's gender classification does not establish the gender distribution of their followers, their content category, their commercial effectiveness, or the audiences they can reach. This is an essential distinction for influencer marketing.
A female-classified creator may have a predominantly male audience. A male-classified creator may have a predominantly female audience. Creators of any classification may produce content across a wide range of categories and reach diverse communities.
For brands targeting a particular consumer demographic, creator gender is not a substitute for follower demographics.
Audience composition must be evaluated using audience-level evidence. A campaign aimed at women, for example, should not automatically restrict discovery to female-classified creators. The relevant question is which creators reach the intended consumers with appropriate, credible content.
The niche data in section 15 shows that some content niches skew more female than others: 73.8% of classified beauty profiles are female, against 50.5% in tech & gaming. But every niche contains large numbers of both female- and male-classified creators, and a niche tag describes a profile, not an individual's expertise.
Gender classification should not be used to infer which content a creator produces. Content relevance should be evaluated directly.
A creator's classification does not reveal the purchasing power of their audience. Nor does it establish engagement quality, conversion rates, trust, credibility, or return on investment.
Those characteristics require different evidence.
Reading the study. Gender classification can describe a recorded creator population. It should not be used as a shortcut for audience targeting, category relevance, or campaign effectiveness.
The most useful application of the study's gender data is descriptive and analytical. It can help brands understand the composition of the recorded creator ecosystem, compare classified subsets across countries, and identify where demographic interpretation requires additional caution.
It should not determine campaign selection by itself.
Reading the study. Keep creator gender classification separate from audience demographics in your campaign reports. Combining them into a single targeting assumption can obscure the factors that actually determine relevance.
Female-classified profiles account for 59.8% of profiles classified as female or male. That is a clear recorded majority within the classified subset. It is not a verified estimate of the gender identities of all eligible creators.
The European figure of 59.8% is close to the US figure of 60.2%. But Europe's higher unclassified share means the comparison must be qualified.
Russia, Lithuania, Poland, and Romania have classified female shares of approximately 69–71%. Switzerland and Greece are close to 50%. A single European percentage therefore conceals considerable variation across countries.
Russia's large creator population and high classified female share materially affect Europe's aggregate distribution. Excluding Russia reduces the regional classified female share from 59.8% to 56.6%.
The dataset describes creator profiles, not the demographics of their followers or the effectiveness of their campaigns. For brands, the distinction between descriptive research and actionable targeting must remain explicit.
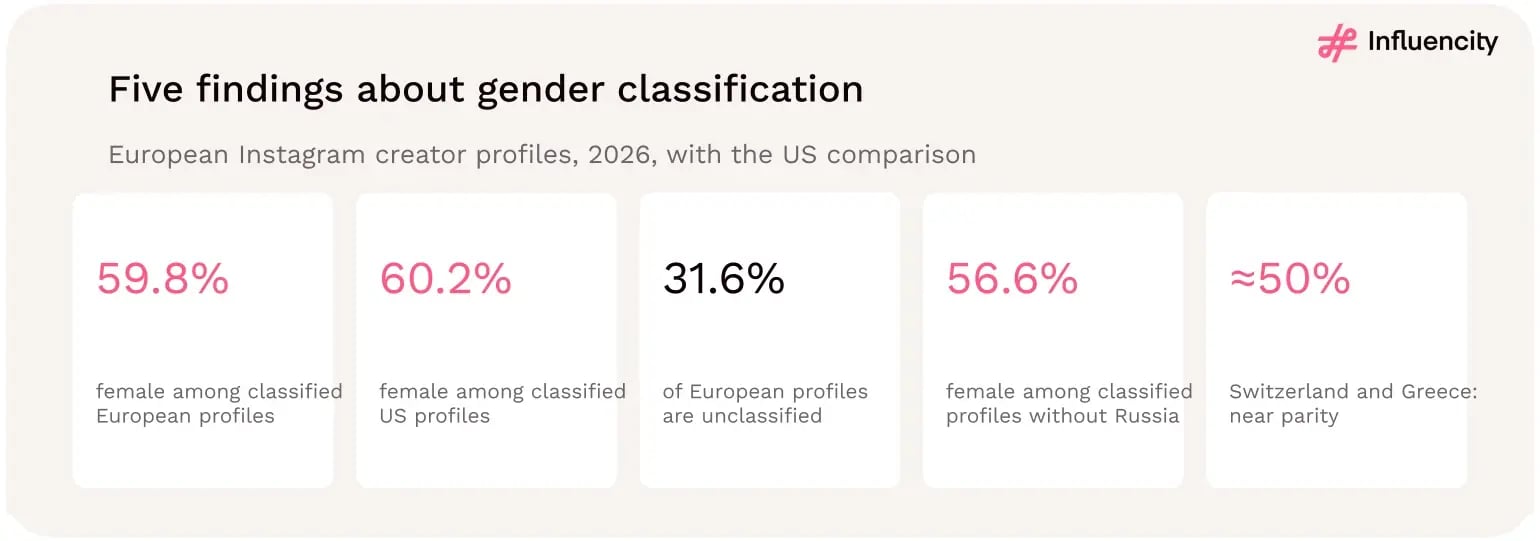
Figure 44 → Five findings that explain Europe's Instagram creator gender classifications—and their limits. Sources: [1, 5].
Europe's Instagram influencer marketing scene has a clear female-classified majority within the profiles assigned a female or male classification. That majority appears across all 30 markets, although its size varies from pronounced differences in Russia, Lithuania, Poland, and Romania to near parity in Switzerland and Greece.
The European classified-only distribution also closely resembles the US figure. But the study's most important qualification is equally clear: 31.6% of eligible European creator profiles have no gender classification.
Campaign planning takeaway. Use gender classification to understand the recorded creator landscape, not to infer audience composition or commercial value. Always report the unclassified share, preserve the distinction between classified-only and all-profile percentages, and evaluate individual creators against the actual campaign brief.
The male share rises by 15.3 percentage points between the overall classified eligible pool and the classified mega tier. Conversely, the female share falls by 15.3 percentage points. This is not a small fluctuation around parity. It is a reversal of the majority.
Reading the study. The overall creator population is heavily influenced by the large number of profiles in smaller follower tiers. Mega creators represent a much narrower group. Comparing the two reveals that their recorded gender compositions differ, but it does not establish a progression in which individual creators move from one tier to another.
The study is a cross-sectional analysis. It does not track the same creators over time or observe how their follower counts change.
Therefore, the findings should be described as differences between follower-tier populations, not as evidence that creators of one gender are more likely to advance.
Europe's classified Instagram creator population has a female majority overall, while its classified mega-tier population has a male majority. The distribution changes with follower tier, but the dataset does not explain why.
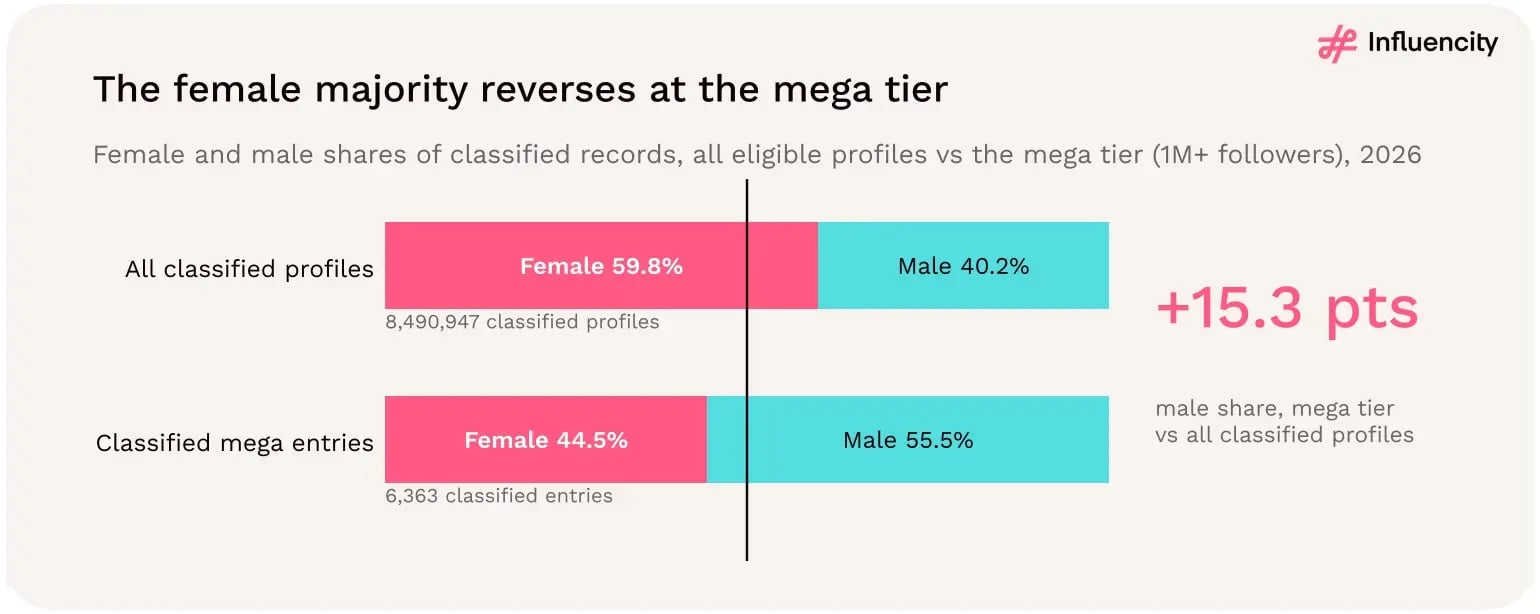
Figure 45 → The classified female majority across eligible European Instagram profiles becomes a male majority at the mega tier. Source: [1].
The regional reversal is visible in several of Europe's largest creator markets.
France, Spain, Italy, Germany, and the United Kingdom all have more male-classified than female-classified mega-tier entries.
Russia is the notable exception among the six countries examined here: its classified mega tier remains female-majority. [1]
Male share = male ÷ (male + female) within the reported mega tier. Source: [1].
France has 448 male-classified mega entries and 254 female-classified entries. Its male share of 63.8% is the highest among these six markets. That produces a gap of approximately 27.6 percentage points between the male and female shares within France's classified mega tier.
The contrast is particularly noteworthy because France's overall creator ecosystem has a female-classified majority, as discussed in section 08. The mega-tier distribution is therefore not representative of the country's broader classified profile population.
Reading the study. France illustrates how dramatically the gender composition of a follower tier can differ from the overall creator pool.
Spain records 521 male-classified and 335 female-classified mega entries, producing a male share of 60.9%. Italy records 438 male-classified and 282 female-classified mega entries, producing a male share of 60.8%.
The difference between their male shares is less than 0.1 percentage points. Yet the countries differ substantially in overall creator density and follower-tier composition.
As earlier sections show, Italy's high creator density is overwhelmingly associated with nano profiles, while Spain has one of the highest concentrations of established creators relative to estimated Instagram users.
Despite those differences, their classified mega-tier gender distributions are almost identical.
Reading the study. Similar mega-tier gender distributions do not imply similar creator ecosystems. Spain and Italy arrive at nearly the same classified mega-tier split despite different overall supply patterns.
Germany records 321 male-classified and 232 female-classified mega entries. Its classified mega-tier male share is 58.0%. Germany has a lower overall creator density than Italy and Spain, but a comparatively high share of established creators in its eligible pool.
The gender composition of its mega tier adds another distinct characteristic to that market profile.
However, the study does not establish a causal relationship between Germany's creator density, its established-creator share, and the gender distribution of its mega entries. These are separate descriptive findings.
Reading the study. Germany's mega tier has a male-classified majority, but that pattern cannot be explained from creator-density figures alone.
The United Kingdom records 853 male-classified and 643 female-classified mega entries. That produces a male share of 57.0%. The UK has the largest number of classified mega entries among the six countries shown in the table, with 1,496 records classified as female or male.
It also has 568 unclassified mega entries, more than any other country in this six-market comparison. This combination makes the UK particularly important when interpreting the mega-tier data. It has substantial absolute volume, a male majority among classified entries, and a sizeable group for which no gender classification is available.
Reading the study. The UK's classified mega tier is male-majority, but the substantial unclassified population limits conclusions about the full mega-tier distribution.
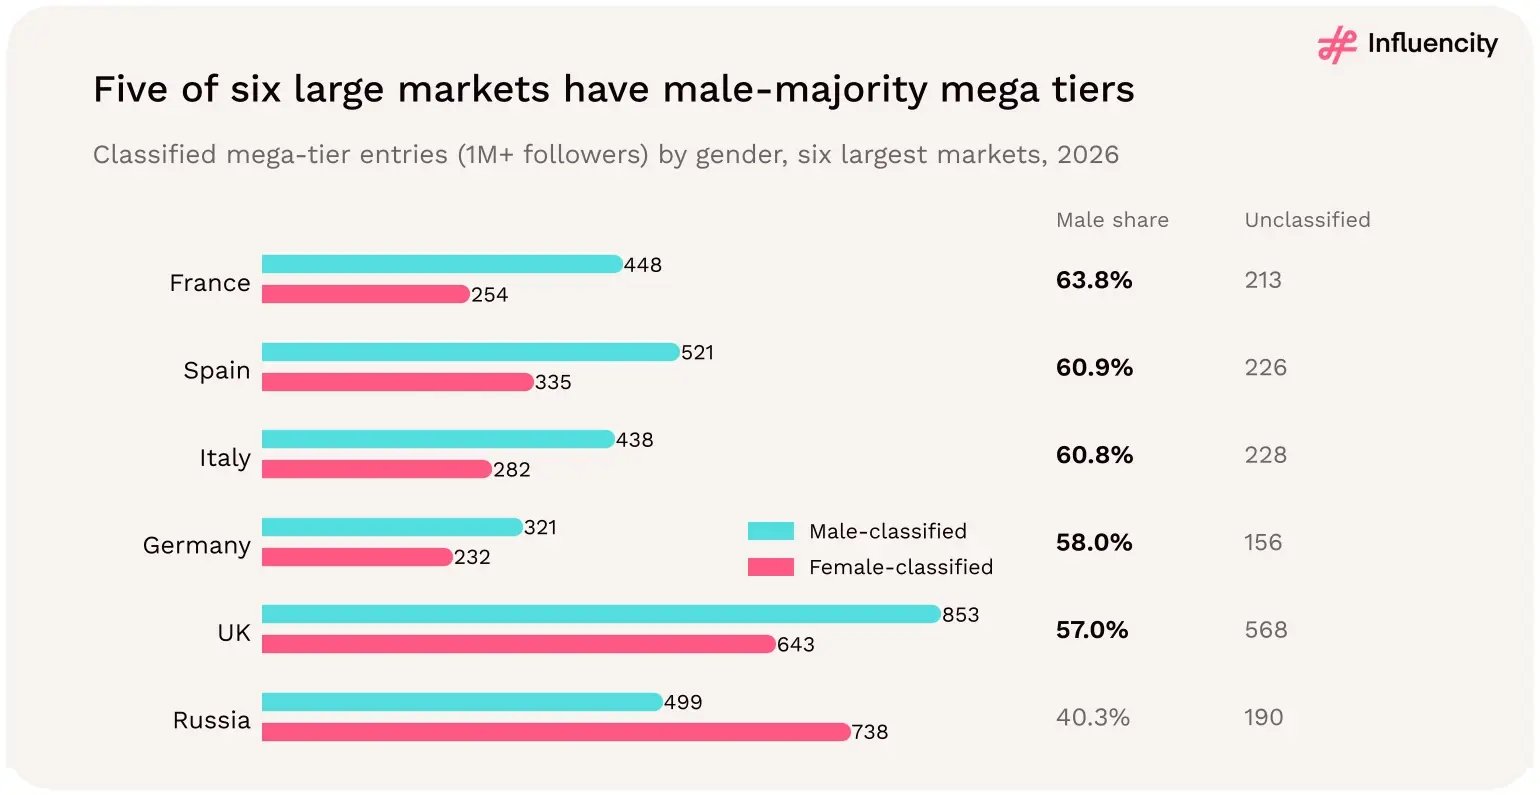
Figure 46 → Mega-tier gender patterns differ from country-wide classified gender patterns. Five of the six large markets shown have male majorities among classified mega entries; Russia has a female majority. Source: [1].
No. Russia records 738 female-classified mega entries and 499 male-classified entries. Female-classified entries account for 59.7% of Russia's classified mega tier, while male-classified entries account for 40.3%. [1] That makes Russia the only female-majority market among the six large countries examined above. The result is especially interesting when considered alongside Russia's overall gender classification.
As section 08 established, 71.2% of Russia's female/male-classified eligible profiles are female-classified. At the mega tier, the female share is lower, at 59.7%, but remains a majority.
Russia demonstrates that the regional pattern is not universal. Its classified mega tier contains proportionally fewer female entries than its overall classified eligible pool.
But unlike France, Spain, Italy, Germany, and the UK, it does not cross into a male majority. The female share declines by approximately 11.6 percentage points between the overall classified pool and the classified mega tier.
This fits the wider pattern of a female majority that narrows at higher follower levels, but it also shows that not every country has a male-majority mega tier.
Russia's large creator population influences several European aggregate statistics, including the overall classified female share. Its mega-tier pattern also differs from those of the other large markets in this section.
This reinforces the importance of examining both regional totals and country-level distributions. A single European mega-tier percentage can describe the aggregate while concealing meaningful national differences.
Reading the study. Russia does not contradict the finding that the female share narrows at the mega tier. It shows that narrowing and reversal are not the same phenomenon.
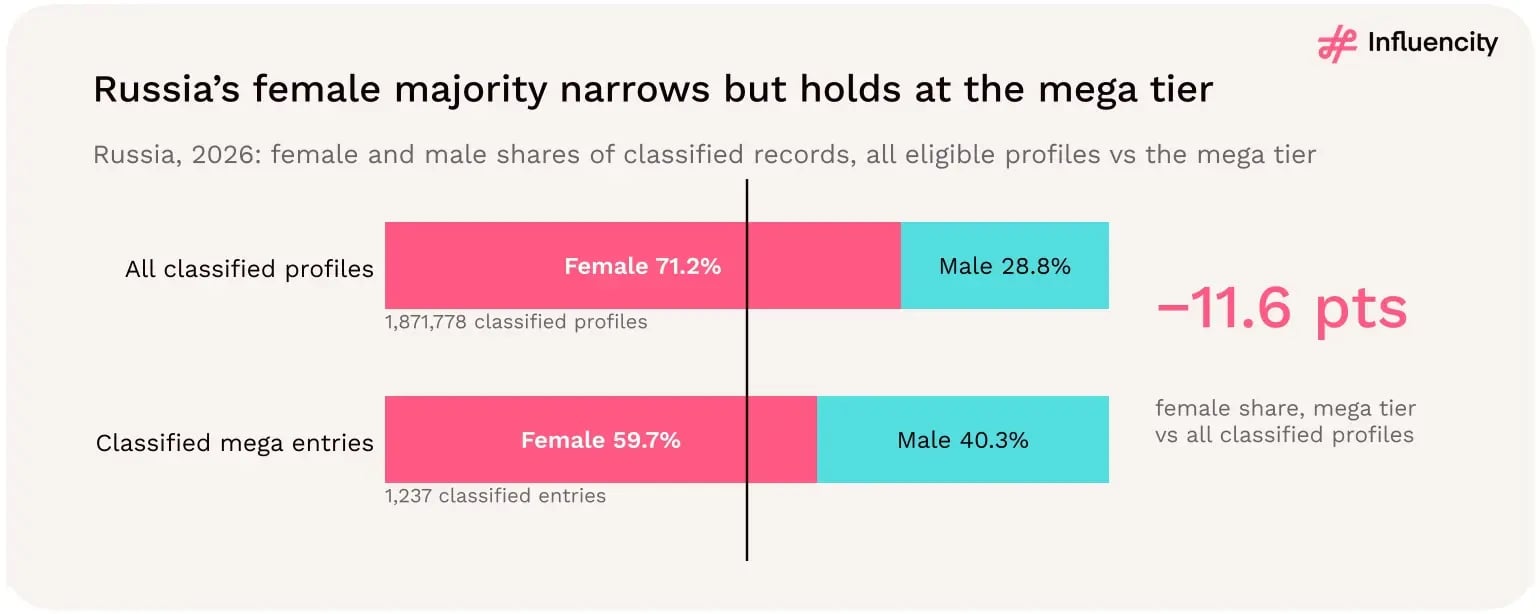
Figure 47 → Russia retains a female-classified majority at the mega tier, although that majority is narrower than in its overall classified pool. Source: [1].
Russia is an exception to the male-majority mega-tier pattern among the six large markets, but it still shows a narrowing of the overall female-classified majority.
No. The study records three different country-level outcomes. Across the 30 European markets:
The male-majority pattern is therefore more common, but it is not universal.
Some countries have fewer than ten classified mega-tier entries. In such cases, a small difference in absolute counts can produce a large percentage difference.
For example, a hypothetical market with six male-classified and three female-classified mega entries would have a male share of 66.7%.
That percentage might appear substantial, but it would describe a difference of only three records. The example is illustrative, not a finding about any particular country. This is why percentages should not be presented without denominators, especially in smaller markets.
We can conclude that male-classified mega entries outnumber female-classified entries in most countries covered by the study. We cannot conclude that the magnitude of those differences is similar across countries.
Nor can we conclude that every country provides an equally informative comparison. A market with hundreds of classified mega entries offers a different level of descriptive detail from a market with only a handful. The study also does not establish statistical significance, sampling uncertainty, or the underlying causes of the differences.
Reading the study. For markets with very small denominators, prioritize counts and avoid strong demographic characterizations.
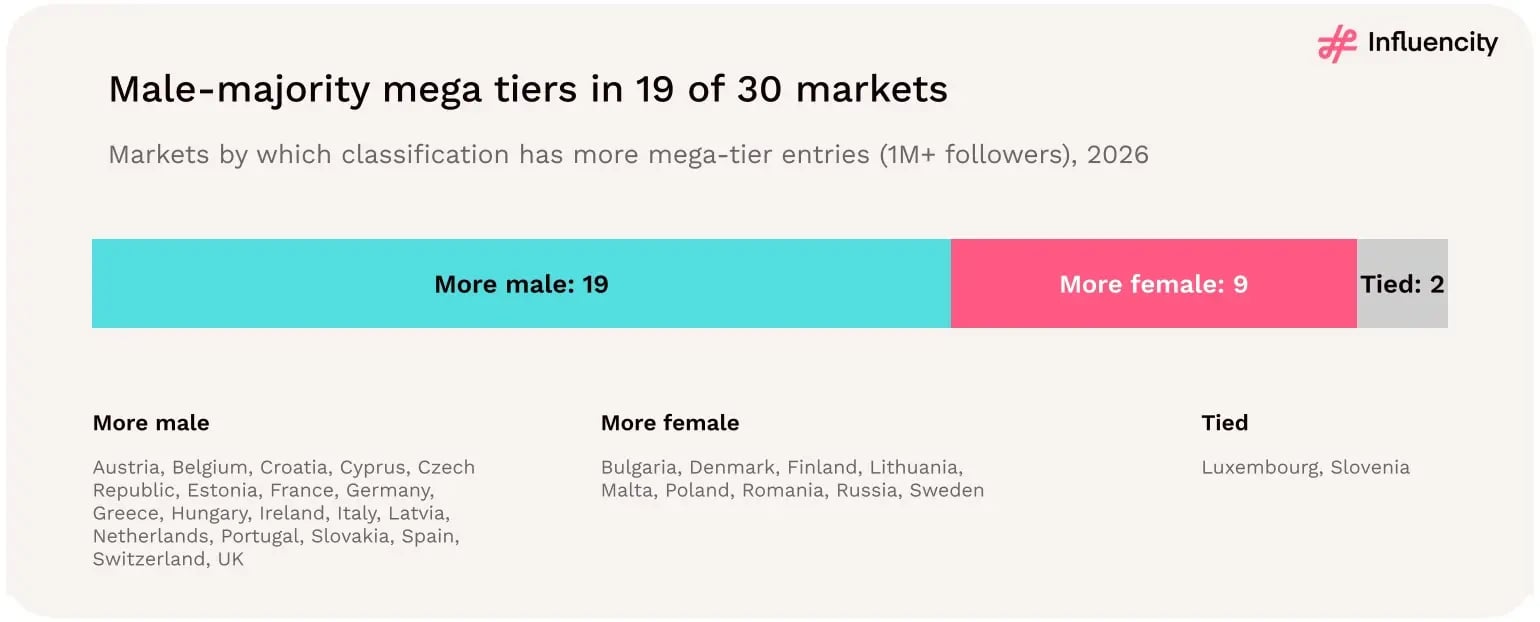
Figure 48 → Male-classified mega entries outnumber female-classified entries in 19 of the 30 European markets. Source: [1].
The study records 1,856 mega-tier entries without a gender classification, alongside 6,363 entries classified as female or male.
That means approximately 22.6% of reported mega-tier entries are unclassified. The classified subset accounts for the remaining 77.4%.
Calculated from reported mega-tier counts in [1]. Percentages are rounded.
This is a lower unclassified share than the 31.6% recorded across all eligible European profiles. That difference is descriptively interesting, but it does not establish that gender classification is more accurate at the mega tier. Coverage and accuracy are different properties.
The reported male majority of 55.5% applies only to mega-tier entries classified as female or male. It does not establish the gender composition of the 1,856 unclassified entries. If those records were assigned classifications, the full-tier distribution could differ from the classified-only result.
The dataset does not support assigning them to either category. The correct interpretation is therefore that male-classified profiles account for 55.5% of classified European Instagram mega-tier entries, not that 55.5% of all European Instagram mega creators are men.
The six-country table shows substantial unclassified counts. The UK records 568 unclassified mega entries, France 213, Spain 226, Italy 228, Germany 156, and Russia 190.
These records should remain visible in visualizations and interpretation. They should not be distributed proportionally between female and male categories unless a separate, validated estimation method is available.
Reading the study. The mega-tier gender reversal is a real feature of the classified records. The unclassified population is a limitation on how broadly that result can be generalized—not a reason to ignore the observed pattern.
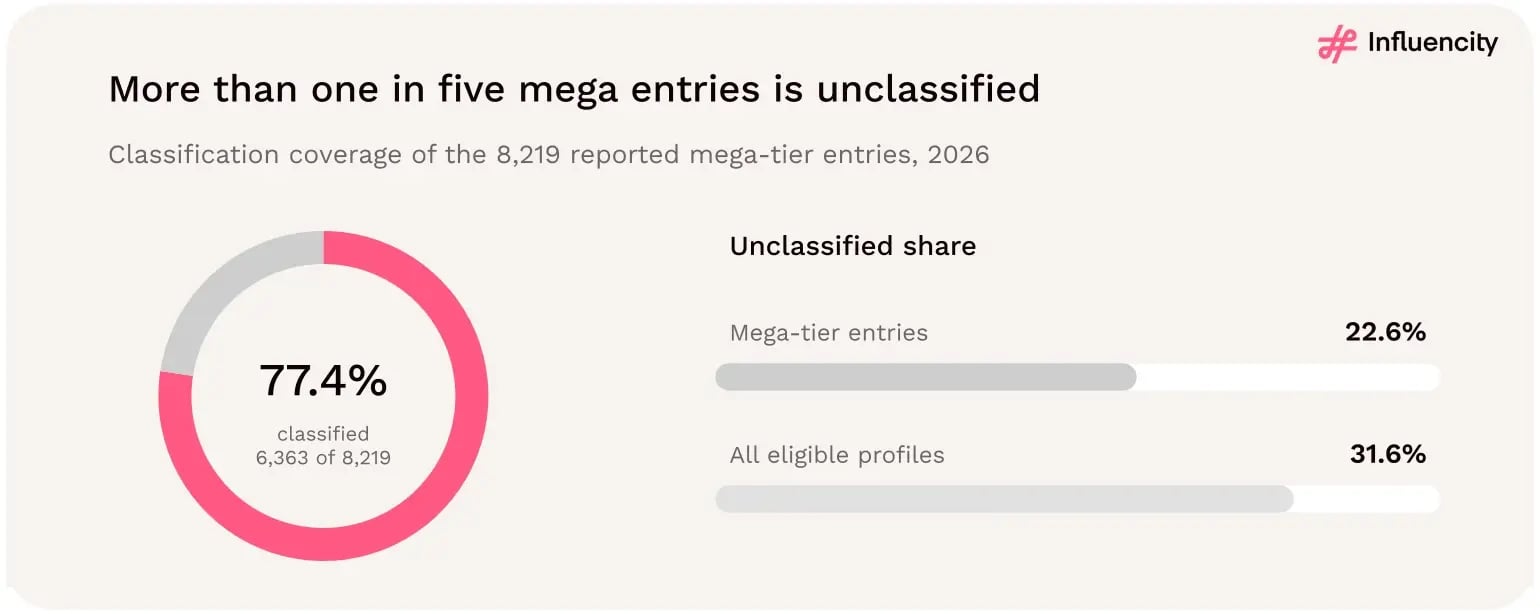
Figure 49 → More than one in five reported European Instagram mega-tier entries has no gender classification. Source: [1].
No. The study's comparison datasets show related patterns in US Instagram and US TikTok, although the final mega-tier distributions differ.
In all three datasets, the female share among classified profiles is lower at the top of the follower ladder than in the broader classified creator population.
But the mega-tier outcome is not identical.
Europe's classified Instagram mega tier has a male share of 55.5%. That is a noticeable departure from the female majority in its overall classified eligible population.
The US Instagram mega tier is almost evenly balanced, with a 50.1% female share. This is an important counterexample to the idea that mega-tier creator populations necessarily become male-majority.
The female share narrows, but the classified distribution remains fractionally female-majority. It is best described as near parity.
US TikTok records a 52.4% male share among classified mega-tier entries. This resembles the direction of the European Instagram finding, although the magnitude is smaller. The result shows that a male-majority mega tier is not exclusive to European Instagram.
However, the datasets cover different platforms and geographies. Their classification methods, eligible populations, and creator ecosystems should not be assumed to be perfectly interchangeable.
It supports a descriptive observation: the female majority narrows at the highest follower levels across all three datasets. It does not establish a common cause.
Potential explanations involving platform algorithms, content categories, audience preferences, creator monetization, historical participation, or structural inequality would require additional evidence.
Reading the study. The narrowing of the female majority appears across European Instagram, US Instagram, and US TikTok. A male-majority mega tier appears in two of the three datasets, while US Instagram is near parity.
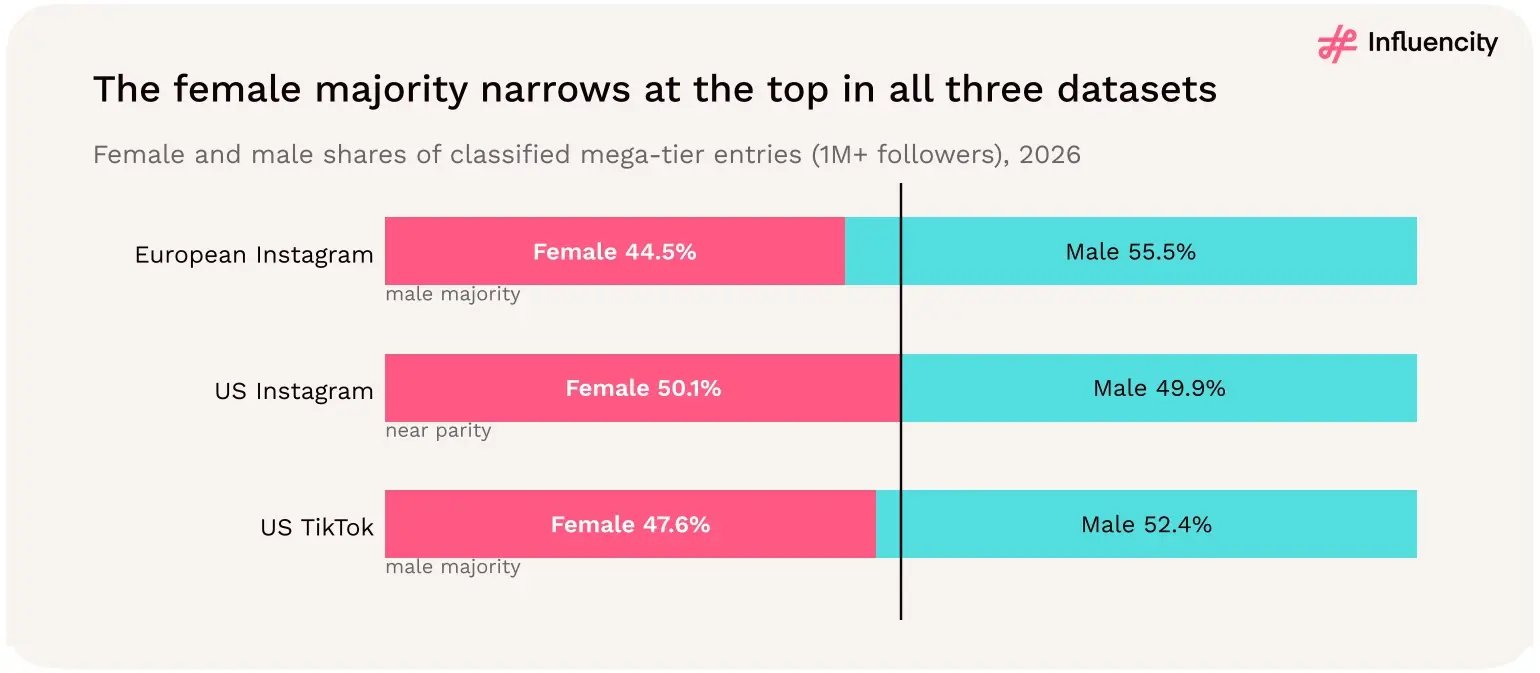
Figure 50 → The female majority narrows at the mega tier across European Instagram, US Instagram, and US TikTok, but the final gender balance differs. Sources: [1, 5, 6].
The study identifies a pattern, not its cause. This distinction is especially important because demographic differences can invite explanations that sound plausible but are not supported by the available evidence.
The dataset does not establish why male-classified profiles are more prevalent in Europe's mega tier than in its overall classified creator pool. It also does not establish whether the difference results from creator-category composition, platform dynamics, account age, audience behavior, or other factors.
Causal restraint matters. A descriptive imbalance is not evidence of a particular mechanism.
The finding that male-classified entries form a majority of Europe's classified mega tier does not, by itself, demonstrate unequal opportunities, algorithmic preference, differences in ambition, or differences in creator quality.
Those claims would require evidence beyond the tier counts.
The study establishes a gender-composition difference across follower tiers. It provides a basis for further investigation, not a causal explanation.
The gender composition of the mega tier is useful for understanding the recorded creator landscape, but it should not determine creator selection.
Brands should distinguish between three separate questions:
The study's mega-tier gender data answers the first question only, and only for classified records. It does not answer the second or third.
A male-classified mega creator may reach a predominantly female audience. A female-classified mega creator may reach a predominantly male audience.
The relationship between creator classification and audience composition must be evaluated directly. For brands targeting a particular consumer demographic, follower-level evidence is more relevant than creator gender classification alone.
Mega creators have large audiences by definition, but follower count does not establish campaign performance. Reach, engagement quality, audience relevance, conversion potential, creator fees, and content fit remain essential considerations.
A smaller creator may be more suitable for a particular campaign than a mega creator, regardless of gender classification.
The study does not establish that male- or female-classified mega creators are concentrated in particular industries or content niches. Section 15 reports niches by gender across all eligible profiles in six markets, not by follower tier. Category assumptions should be tested using content-level evidence.
The most actionable implication is methodological. If a campaign requires mega creators, the relevant discovery universe is the mega tier—not the overall creator population.
Brands should avoid assuming that the demographic composition of the full eligible pool describes the creators available at the required follower level.
Reading the study. Build creator shortlists using follower tier, audience geography, content relevance, and campaign objectives first. Treat gender classification as a descriptive attribute rather than a substitute for audience fit or expected performance.
The study's findings are most useful when presented with consistent definitions and clear denominators.
The difference between the tiers is enormous. The nano tier contains more than 10.8 million reported entries.
The micro tier contains approximately 1.41 million. The macro tier contains just over 154,000, while the mega tier contains 8,219.
In other words, the European Instagram creator population is not evenly distributed across follower sizes. It resembles a steep pyramid: a very broad base of smaller accounts, narrowing sharply toward the largest audiences.
At 87.3%, nano entries dominate the recorded distribution. This is important because the largest creator population is not composed of celebrities or accounts with hundreds of thousands of followers. It consists overwhelmingly of profiles at the lower end of the study's eligible follower range.
That finding helps explain why countries with large nano populations can have high overall creator density without necessarily having an equally large supply of established creators. Italy provides a clear example, as discussed in section 06.
Its unusually high creator density relative to Germany is driven overwhelmingly by nano profiles.
Micro creators account for 11.4% of reported tier entries. Although that percentage is much smaller than the nano share, it still represents more than 1.4 million records. For brands seeking creators above the nano threshold but below macro scale, the micro tier therefore represents a substantial recorded discovery universe.
However, the study does not establish how many of these creators are active, available for partnerships, or suitable for any specific campaign.
Macro entries account for approximately 1.24% of the tier distribution. Mega entries account for approximately 0.066%. These small shares demonstrate that large follower counts are uncommon relative to the full eligible creator population.
They do not establish that macro or mega creators are more valuable, more effective, or more commercially successful. Follower size is a measure of account scale, not a direct measure of influence or campaign performance.
Reading the study. Europe's Instagram creator ecosystem is overwhelmingly composed of smaller accounts. The larger follower tiers are numerically scarce, making tier-specific discovery more informative than headline creator counts.
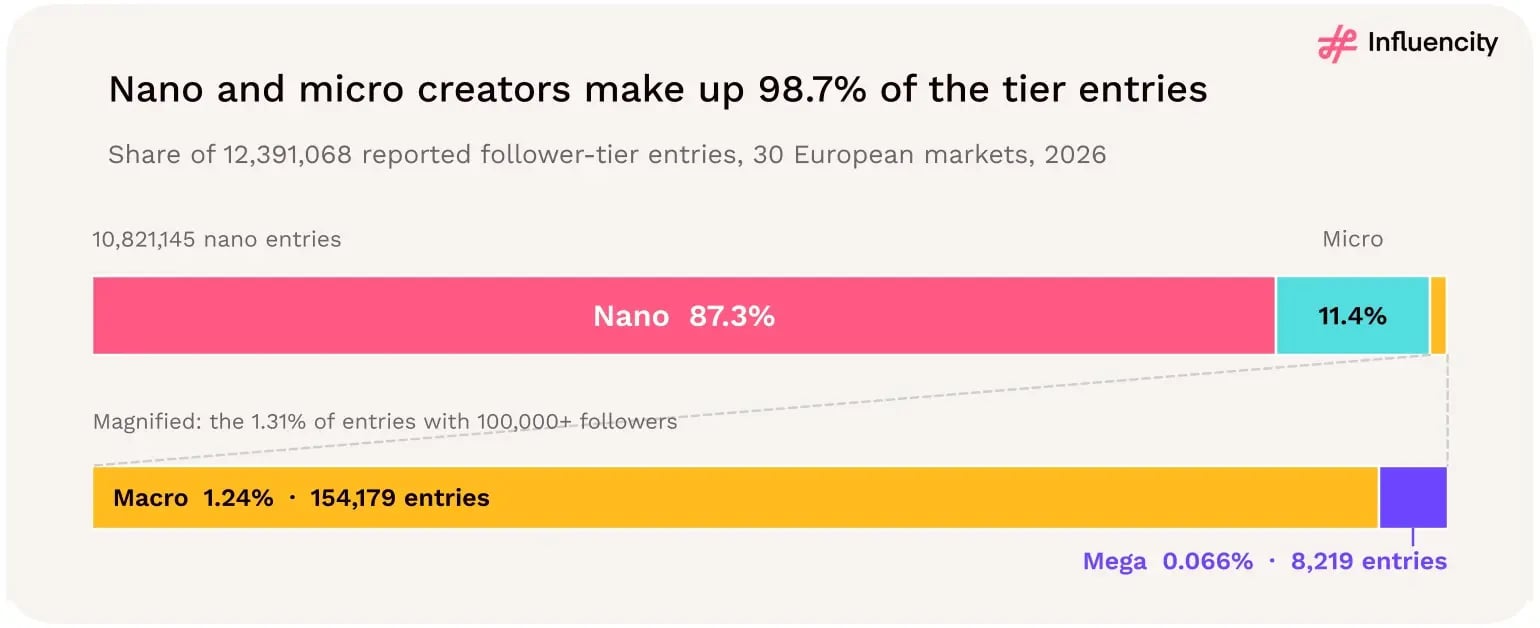
Figure 51 → Nano and micro creators account for approximately 98.7% of reported Instagram follower-tier entries across 30 European markets. Source: [1].
Nano and micro creators account for approximately 98.7% of reported follower-tier entries. That means the overwhelming majority of the recorded eligible creator ecosystem sits below 100,000 followers.
This finding is important for understanding the structure of the market, but it should not be confused with evidence about creator behavior or commercial performance.
The dataset identifies eligible Instagram profiles according to the study's criteria.
It does not establish that every eligible profile is operated by someone who considers themselves a professional influencer.
Nor does it establish that every profile is actively seeking brand partnerships.
A creator with a few thousand followers may produce content regularly, collaborate with brands, or maintain a highly engaged community.
Another profile in the same follower band may have little interest in commercial partnerships.
The follower-tier data cannot distinguish between those situations.
It means that total creator counts are heavily influenced by the size of the nano population. A country can rank highly in overall creator supply because it contains many nano profiles.
That does not necessarily mean it has a similarly strong position among macro or mega creators. This is why total eligible profiles and follower-tier composition should be analyzed together.
The country-level findings in section 06 demonstrate the distinction. Italy has approximately 1.70 times Germany's total eligible creator count, but only about 1.15 times Germany's number of profiles with 10,000 or more followers.
The difference narrows substantially when the analysis moves beyond nano supply.
It provides a strong reason to include smaller creators in discovery rather than restricting searches to the largest accounts. However, it does not establish that nano creators deliver better engagement, stronger trust, lower fees, or higher returns.
Those claims require campaign-level evidence.
Reading the study. The dominance of nano creators is a structural feature of the recorded market. Whether that abundance translates into a commercial advantage depends on the campaign objective and the quality of the creators available.
The study records approximately 1.57 million entries across the micro, macro and mega tiers. These are the reported entries above the nano tier. Together, they account for approximately 12.7% of the follower-tier distribution.
The 10,000-follower threshold provides a useful way to distinguish the large nano population from the smaller pool of profiles with more substantial follower counts.
It is not a universal definition of professional influence. A creator with 9,000 followers may be commercially experienced, while one with 20,000 followers may have no partnership history. Nevertheless, the threshold is useful for comparing the structure of creator supply across markets.
France illustrates the importance of this distinction. It has a relatively low overall creator density compared with Italy or Spain, but the highest proportion of eligible profiles above 10,000 followers among the 30 markets.
Germany shows a similar pattern, with a comparatively high established-creator share despite below-benchmark overall density. The United Kingdom and Spain, meanwhile, lead the study in profiles with 10,000+ followers relative to estimated Instagram users.
These findings show why a country ranking based on total eligible profiles cannot substitute for a follower-tier comparison.
Reading the study. Planning tip: If a campaign requires creators above 10,000 followers, compare countries using their 10K+ counts and qualified shortlist sizes rather than total eligible profiles alone.
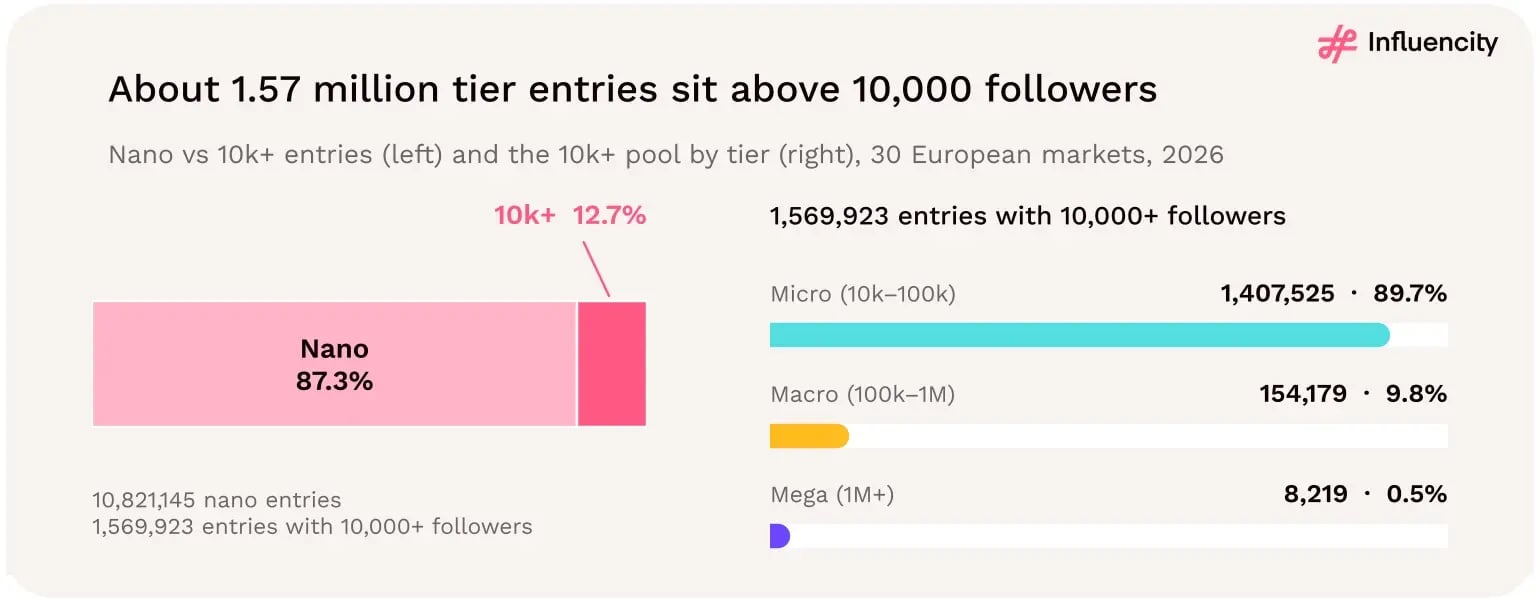
Figure 52 → Approximately 1.57 million reported European Instagram tier entries fall above the nano tier. Source: [1].
The mega tier is extremely small relative to the full eligible creator population.
Across the 30 markets, the study records 8,219 mega-tier entries, representing approximately 0.066% of all reported follower-tier entries. [1] Yet those entries are not evenly distributed across Europe.
The United Kingdom alone accounts for approximately 25.1% of the regional mega tier. The six largest creator markets—Russia, the UK, Italy, Spain, Germany and France—account for 86.9% of all mega-tier entries.
Those same six countries account for 76.7% of the headline eligible creator pool. This reveals a stronger geographic concentration at the top of the follower ladder.
The UK records 2,064 mega-tier entries, the largest national count in the dataset. That represents approximately one-quarter of all European mega entries. Russia, despite having a substantially larger overall eligible creator pool, records 1,427 mega entries.
This contrast demonstrates that total creator supply and mega-tier supply are not distributed in the same proportions.
The UK is the largest recorded mega-creator market in the study, even though Russia leads on total eligible profiles.
The six largest creator markets collectively contain approximately 86.9% of mega entries. That is 10.2 percentage points higher than their 76.7% share of headline eligible profiles. The concentration is therefore more pronounced at the mega tier than in the overall creator population.
This does not establish that mega creators in those markets are more effective or commercially accessible. It establishes that the reported mega-tier supply is concentrated geographically.
Brands planning campaigns around creators with more than one million followers may find that the initial discovery universe is concentrated in a relatively small number of countries.
But creator location does not necessarily correspond to audience location. A mega creator assigned to the UK may have a substantial international following. For cross-border campaigns, audience geography may matter more than the creator's assigned country.
Reading the study. Europe's creator population is geographically concentrated, but its mega tier is even more so. The UK is particularly prominent at the top of the follower ladder.
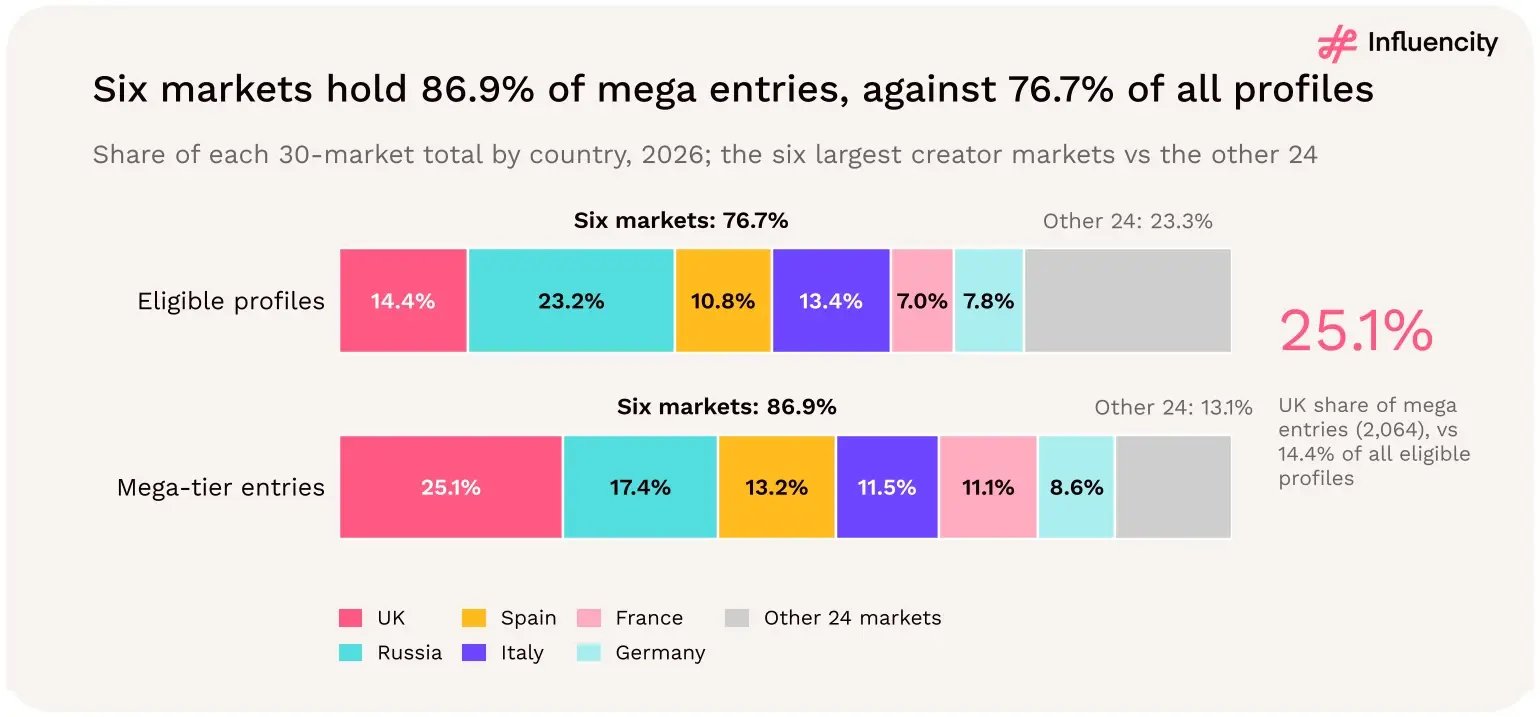
Figure 53 → Europe's six largest creator markets account for a disproportionately high share of mega-tier entries. Source: [1].
The follower-tier distribution helps explain why countries with similar creator counts can have different recruitment characteristics.
It also explains why a country's overall creator-density ranking may not reflect its position among established or mega creators.
Italy has one of Europe's highest overall creator densities. But the study shows that most of its density advantage over Germany comes from nano profiles.
For brands requiring numerous smaller creators, that is a relevant discovery characteristic. For brands requiring creators above 10,000 followers, the difference between Italy and Germany is much narrower.
France has a smaller eligible creator pool than Italy, Spain or Germany. Yet it has the highest proportion of profiles above 10,000 followers in the study, at approximately 17.0%.
This makes France an important example of how a lower total creator count can coexist with a comparatively established-heavy tier distribution.
The UK has the largest recorded mega-tier count and one of the strongest pools of established creators relative to estimated Instagram users. Its position differs from Italy's nano-driven density advantage.
Both markets are significant, but for different reasons.
Spain combines above-benchmark overall creator density with one of Europe's highest concentrations of profiles above 10,000 followers relative to estimated Instagram users.
Its profile illustrates why established-creator density can be a useful additional measure alongside total supply.
A country should not be classified as a strong or weak influencer market using one follower-tier metric. The relevant measure depends on the campaign.
For a program requiring many nano creators, total eligible supply and nano counts may be particularly useful. For a campaign requiring established creators, 10K+ counts provide a more relevant starting point. For a mega-creator campaign, the number of recorded mega entries and their audience characteristics become central.
Reading the study. The follower-tier mix determines what a country's creator count actually means for recruitment.
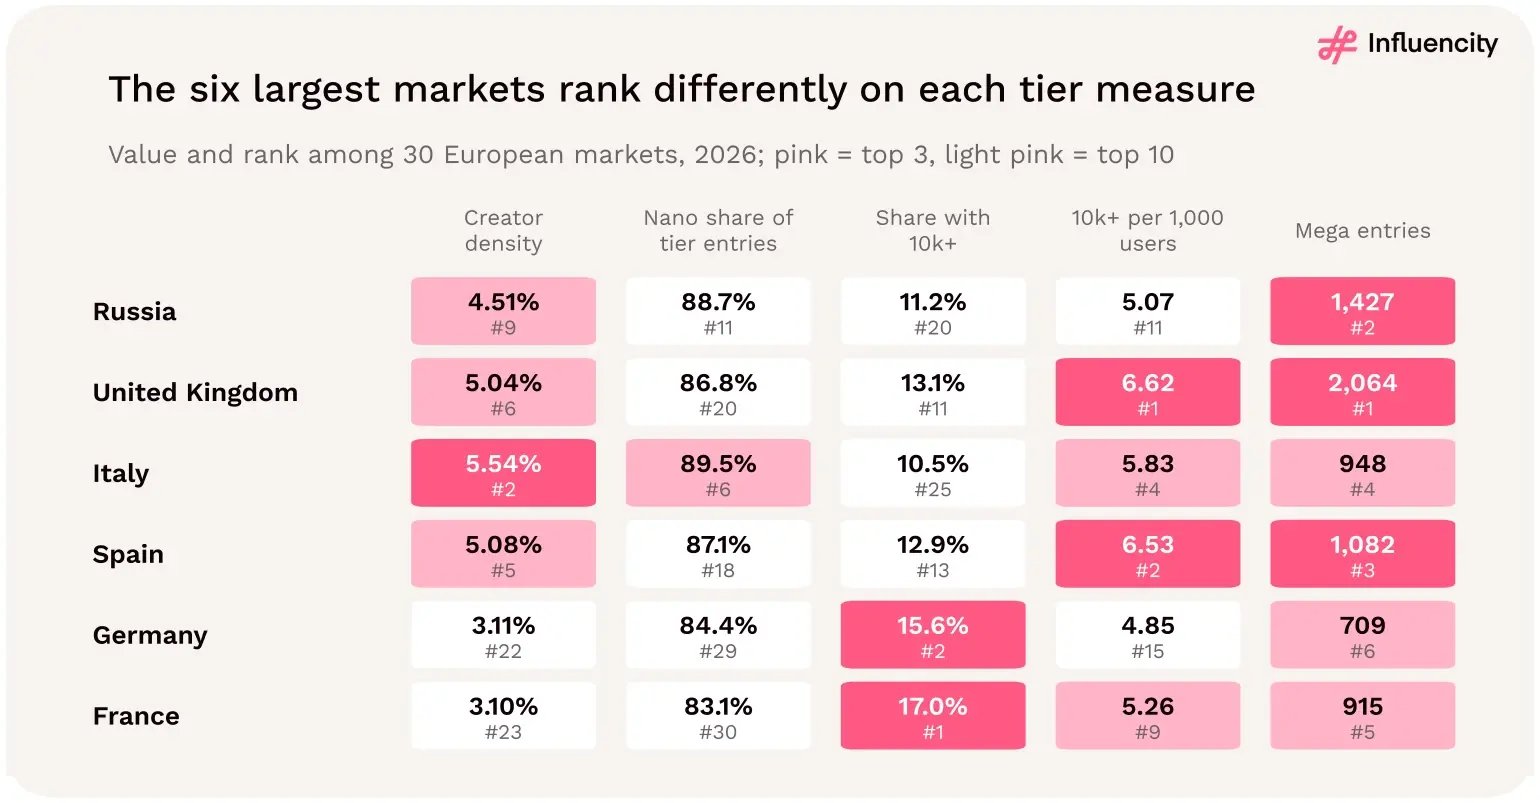
Figure 54 → European Instagram markets differ not only in total creator supply but in how that supply is distributed across follower tiers. Source: [1].
No. The European dataset does not establish which follower tier delivers the strongest engagement, conversions or return on investment. It records creator supply and follower-tier distribution. It does not provide European engagement-rate benchmarks by tier, creator fees, conversion rates or campaign performance data.
This limitation matters because follower-tier discussions often move too quickly from supply statistics to performance claims.
A tier can contain many creators without being the best-performing tier for a particular objective. Likewise, a small tier can contain commercially valuable creators without being universally more effective.
Two additional Influencity studies provide relevant, but geographically separate, evidence.
These findings provide examples of how follower tiers may differ in specific categories and markets. They do not establish the performance of nano, micro, macro or mega creators across Europe.
They also measure different outcomes: one reports engagement, while the other describes the distribution of tagged posts. Those outcomes should not be treated as interchangeable.
Reading the study. The European tier distribution shows where creator supply is concentrated. The US and Mexico category studies suggest questions worth testing, not performance rules for European campaigns.
The study supports a tier-aware discovery strategy rather than one that relies exclusively on large accounts. However, tier selection should follow the campaign objective.
These are planning starting points, not findings that one tier consistently performs better than another.
Begin with the outcome the campaign needs to achieve. That might be awareness, content production, product discovery, traffic, qualified leads or sales. The objective determines which creator characteristics matter.
Use the study's tier counts to understand the potential discovery universe. A campaign requiring many smaller creators should not be scoped using only macro and mega profiles. A campaign requiring creators above 100,000 followers should not be planned from the total eligible count.
Apply content, audience, geography, activity, authenticity and brand-fit requirements. Follower count alone does not establish suitability.
Confirm creator availability, fees, deliverables, rights, disclosure requirements and campaign timing. The number of eligible profiles is not the number of creators willing or able to participate.
Compare outcomes against the campaign objective. Do not assume that a larger follower tier will deliver better results or that a smaller tier will automatically be more cost-effective.
Reading the study. Build shortlists by follower tier and country, then evaluate qualified supply and campaign economics before deciding how much budget to allocate to each group.
The nano tier contains 10.82 million entries, accounting for 87.3% of the follower-tier distribution.
Together, nano and micro entries represent approximately 98.7% of reported tier entries.
Macro and mega entries together account for approximately 1.3% of the reported distribution.
The six largest creator markets account for 86.9% of mega entries, compared with 76.7% of headline eligible profiles.
The UK contributes 2,064 mega entries, or approximately 25.1% of the regional total.
Italy's strength is particularly pronounced in nano supply, while France has the highest established-creator share and the UK leads in mega entries.
The study does not measure European engagement rates, creator fees, conversions or ROI by follower tier.
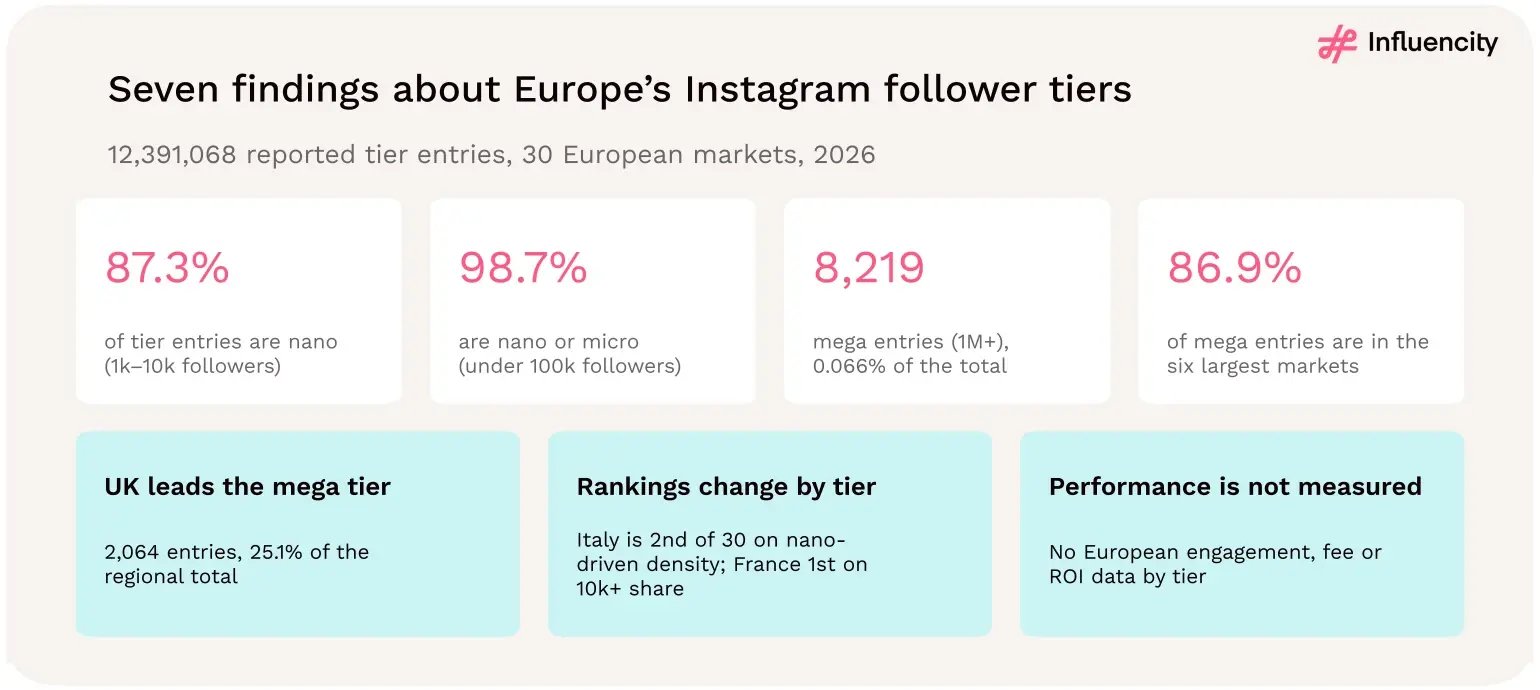
Figure 55 → Seven findings explain the structure and geographic concentration of Europe's Instagram follower tiers. Source: [1].
Europe's recorded Instagram creator ecosystem is overwhelmingly composed of nano and micro profiles. Together, they account for almost 99% of reported follower-tier entries.
Macro and mega creators are numerically rare, and the largest accounts are concentrated disproportionately in a small group of countries. The United Kingdom's position is especially striking: it contributes approximately one-quarter of all recorded European mega-tier entries, despite accounting for a much smaller share of the overall creator population.
These findings challenge the idea that a country's influencer market can be understood through its largest creators, or through its total creator count alone.
The relevant measure of supply changes with the follower tier a campaign needs. For a brand planning broad creator discovery, the nano and micro populations provide the largest recorded universe.
For a campaign requiring established creators, the 10K+ pool is more relevant. For a mega-creator campaign, geographic concentration and audience reach become particularly important.
None of these structural findings determines which tier will produce the strongest commercial outcome. That question requires campaign-level evidence.
Campaign planning takeaway. Use follower-tier counts to understand the scale and structure of potential recruitment. Compare countries at the relevant follower threshold, qualify creators using audience and content evidence, and measure performance rather than assuming it from follower size.
Creator density is calculated as: Eligible creator profiles ÷ estimated platform users × 100. The resulting percentage describes the number of eligible creator profiles relative to the platform's estimated audience.
That gives TikTok a calculated density approximately 2.01 times Instagram's. On these inputs, TikTok has more eligible creator profiles relative to its estimated user base.
It does not mean that 8.48% of unique TikTok users are verified professional influencers. The numerator counts eligible profiles, not necessarily unique individuals or commercially active creators.
The denominator is an estimated platform audience, not a verified census of unique residents. Creator density is therefore best understood as a supply-to-estimated-audience ratio. It is not a measure of engagement, audience quality, monetization, influence or campaign effectiveness.
Reading the study. TikTok's European figures imply approximately twice Instagram's creator density. The result describes a difference between two reported ratios—not a validated difference in unique creator participation.
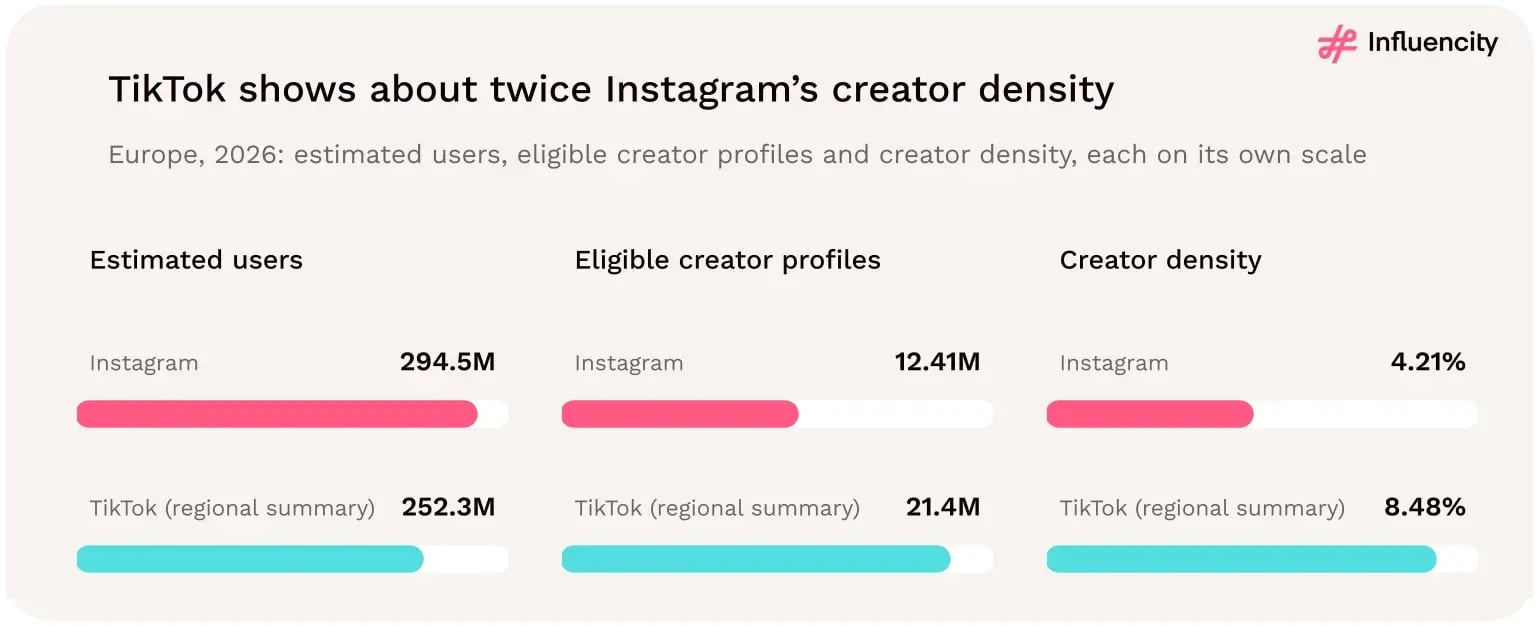
Figure 56 → The European TikTok summary implies approximately twice Instagram's creator density, but the figures are not a validated like-for-like platform comparison. Sources: [1, 4].
The difference comes from two features of the regional figures. TikTok has a larger reported eligible creator pool. At the same time, it has a smaller estimated user base. Both affect the density ratio.
The TikTok summary contains approximately 21.4 million eligible profiles. Instagram's headline dataset contains approximately 12.41 million. That makes TikTok's reported eligible profile pool approximately 72.5% larger than Instagram's.
This is a comparison of reported profile counts. It is not evidence that TikTok has 72.5% more unique European people creating content.
Instagram's estimated European audience is approximately 294.5 million. TikTok's estimated audience is approximately 252.3 million.
That places TikTok's estimated audience about 14.3% below Instagram's. A smaller denominator increases the calculated density when the number of eligible profiles is held constant. In this case, TikTok also has the larger numerator. The combination produces the approximately twofold difference.
Looking only at eligible creator profiles would suggest that TikTok has a substantially larger recorded supply. Looking only at estimated users would suggest that Instagram has the larger platform audience. Creator density brings the two measures together.
But it does not resolve differences in the underlying definitions. If one platform's eligibility filters include more account types, lower activity thresholds or a different geographic footprint, its creator count may not be directly comparable with the other's. The ratio is mathematically clear.
Reading the study. TikTok's higher calculated density reflects both a larger reported creator numerator and a smaller estimated audience denominator. Neither component, on its own, explains whether the platform offers a better creator market.
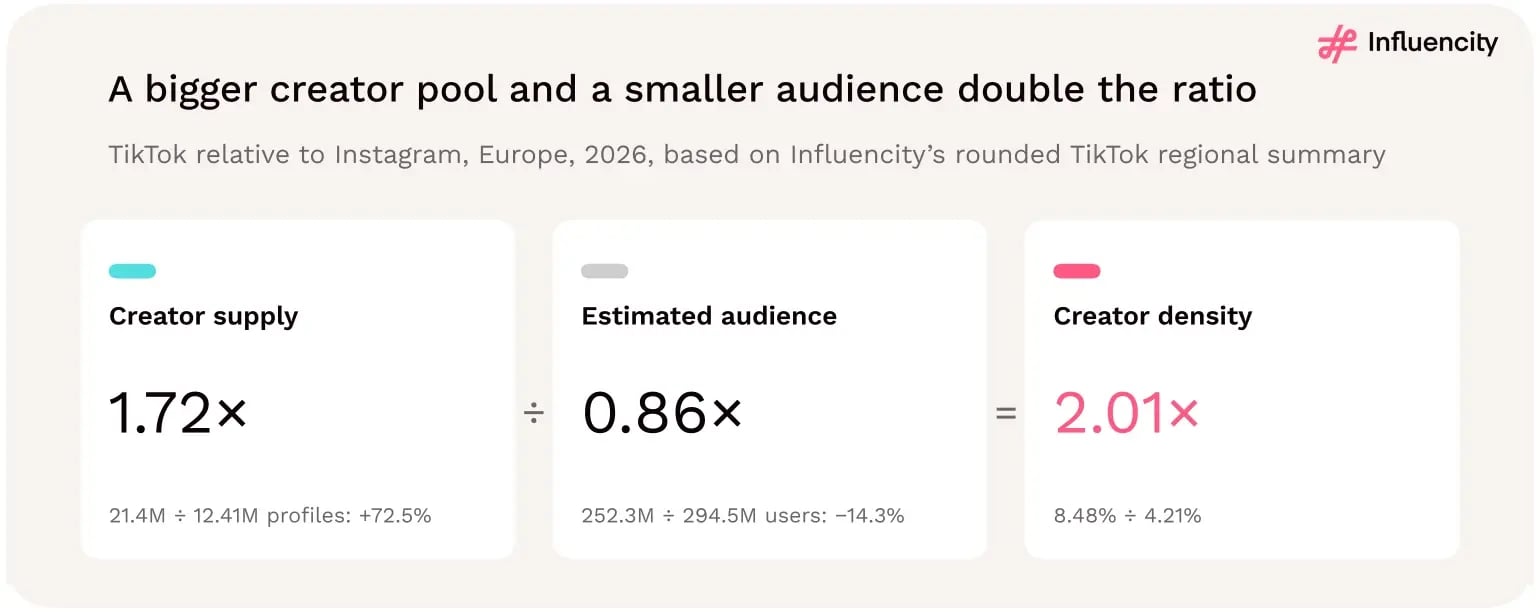
Figure 57 → TikTok's higher calculated creator density reflects a larger reported eligible profile pool and a smaller estimated audience. Sources: [1, 4].
The US comparison provides a useful contextual check.
According to Influencity's fully reconciled US platform totals, TikTok's creator density is approximately 2.04 times Instagram's. [5, 6]
That is close to the 2.01-times ratio calculated from the European figures.
Two different geographic comparisons produce nearly the same relative density.
That makes the European result plausible as a descriptive pattern.
It suggests that the higher TikTok supply-to-audience ratio is not necessarily an isolated feature of the European summary.
But similarity is not validation.
It does not establish that the European TikTok figures cover exactly the same countries as the Instagram study.
It does not establish that eligibility filters or account definitions are identical.
It does not confirm that the two European platform datasets use matching observation dates.
And it does not establish that the creator populations are comparable in their activity, commercial availability or audience characteristics.
The US comparison therefore provides supporting context, not a substitute for matched European data.
A validated comparison would require a European TikTok dataset with:
With those conditions met, the study could distinguish a robust platform-level difference from one partly driven by data construction.
Reading the study. Research takeaway: The US ratio makes the European estimate more plausible, but the European result remains provisional until the underlying platform datasets are harmonized.
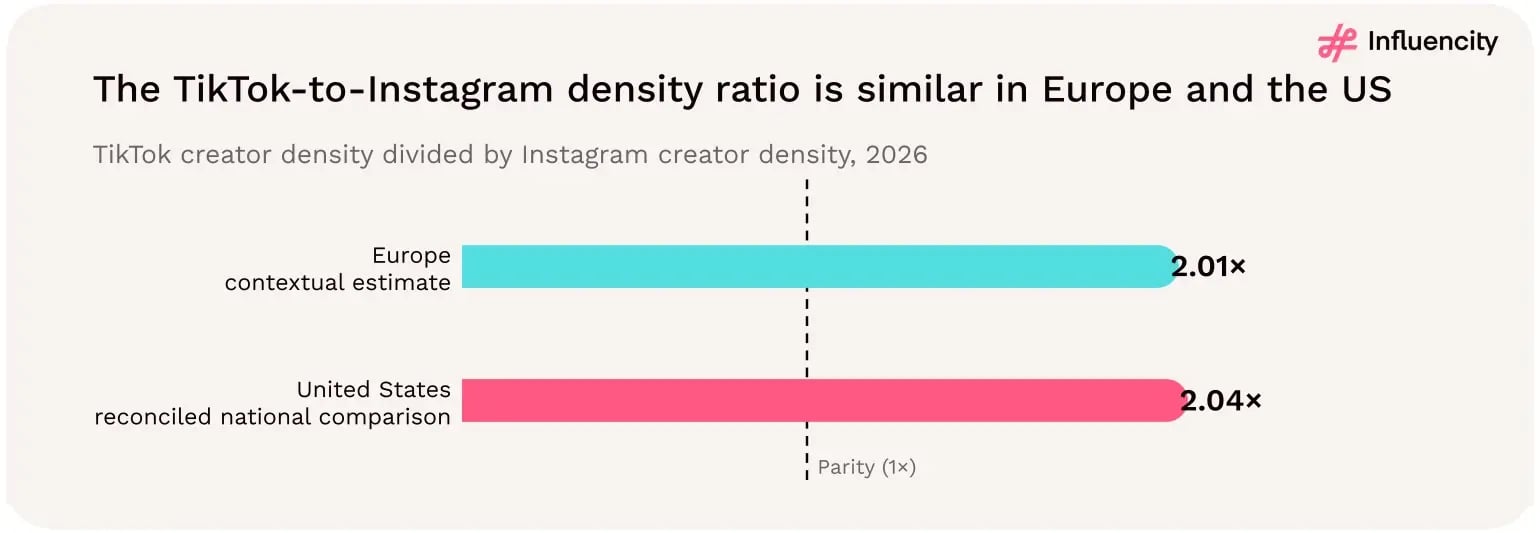
Figure 58 → The European TikTok-to-Instagram creator-density ratio resembles the reconciled US ratio, but the evidence bases differ. Sources: [1, 4, 5, 6].
Cross-platform comparisons often appear straightforward because both platforms have creators, followers and accounts. But similar-looking metrics are not necessarily equivalent. Several methodological differences can affect the interpretation.
The Instagram and TikTok datasets may use different criteria for deciding which accounts qualify as eligible creator profiles. A broader eligibility definition can produce a larger recorded pool without reflecting a larger number of commercially active creators.
Until those definitions are aligned, a higher creator count should not be interpreted as a definitive participation advantage.
The Instagram study covers 30 specified European markets. The TikTok regional summary does not provide a matched country-level breakdown in the material used for this section.
If the TikTok summary covers a different geographic footprint, its regional totals may not be directly comparable.
The eligible pools may include different proportions of individual creators, organizations, brands or other account types. The figures do not establish that their composition is identical.
Both denominators are estimated platform audiences. The figures should not automatically be interpreted as verified monthly active users or deduplicated unique residents. If the estimation methods differ, the calculated densities may reflect methodological differences as well as differences in the recorded ecosystems.
One individual may operate an Instagram account and a TikTok account. The two creator populations are therefore not mutually exclusive. Adding their eligible profile counts does not produce a count of unique European creators.
Reading the study. Cross-platform creator statistics are only as comparable as their definitions, geography, timing and account-level measurement rules.
No. The figures do not support that conclusion. Adding Instagram's approximately 12.41 million eligible profiles to TikTok's approximately 21.4 million produces a combined figure of roughly 33.8 million platform-specific eligible profile records.
That is not the same as 33.8 million distinct creators. A person may have an eligible account on both platforms. Some creators may operate multiple accounts. Some eligible profiles may represent brands, organizations or other entities rather than individual people.
The two datasets may also use different eligibility and geographic assignment rules. Without a deduplication method, the number of distinct creators represented across the two platforms cannot be established.
Reading the study. Research tip: Never describe the sum of platform-specific creator counts as a unique creator population unless overlap has been measured and removed.
Not necessarily. A larger number of eligible creator profiles relative to estimated users may suggest a more crowded recorded supply environment.
A profile may qualify for the dataset without being available for brand partnerships. The study does not measure how many eligible profiles are actively seeking collaborations.
The ratio does not measure posting frequency, content volume, impressions, algorithmic distribution or competition for attention. A platform with more eligible creators per estimated user does not necessarily expose each user to more creator content.
The figures do not include creator fees, media costs, production costs or negotiation outcomes. A higher creator-density ratio does not establish that creators are cheaper or more expensive.
The comparison does not measure engagement, conversions, sales, brand lift or campaign ROI. Those outcomes depend on campaign objectives, creator selection, audience fit, creative execution and other factors.
Reading the study. A higher supply-to-audience ratio may change the questions a marketer asks about a platform. It does not answer those questions by itself.
The European density comparison cannot establish which platform performs better. However, a separate Influencity supplements study covering the United States and Mexico provides examples of platform differences within a specific category. [7]
In that sample:
These findings concern the study's supplements sample, not the European creator populations analyzed here.
They also measure sentiment and disclosure, not creator density.
Within the US and Mexico supplements sample, Instagram had a higher reported share of positive sentiment. That is a category-specific observation. It does not establish that Instagram produces more positive sentiment across Europe or across all industries.
The supplements study recorded a higher share of explicit disclosure on Instagram. That may be relevant to questions about branded-content practices in the category.
But the figures do not establish that disclosure behavior is universally better on Instagram or that European campaigns follow the same pattern.
Creator density describes the scale of recorded eligible supply relative to estimated users. Sentiment describes the tone of analyzed content. Disclosure describes whether the study identified explicit partnership disclosure.
These are different measures. A platform can have higher creator density and lower positive sentiment in a particular category without one causing the other.
Reading the study. Category studies can inform hypotheses for platform testing, but they should not be used to convert Europe's creator-density comparison into a performance ranking.
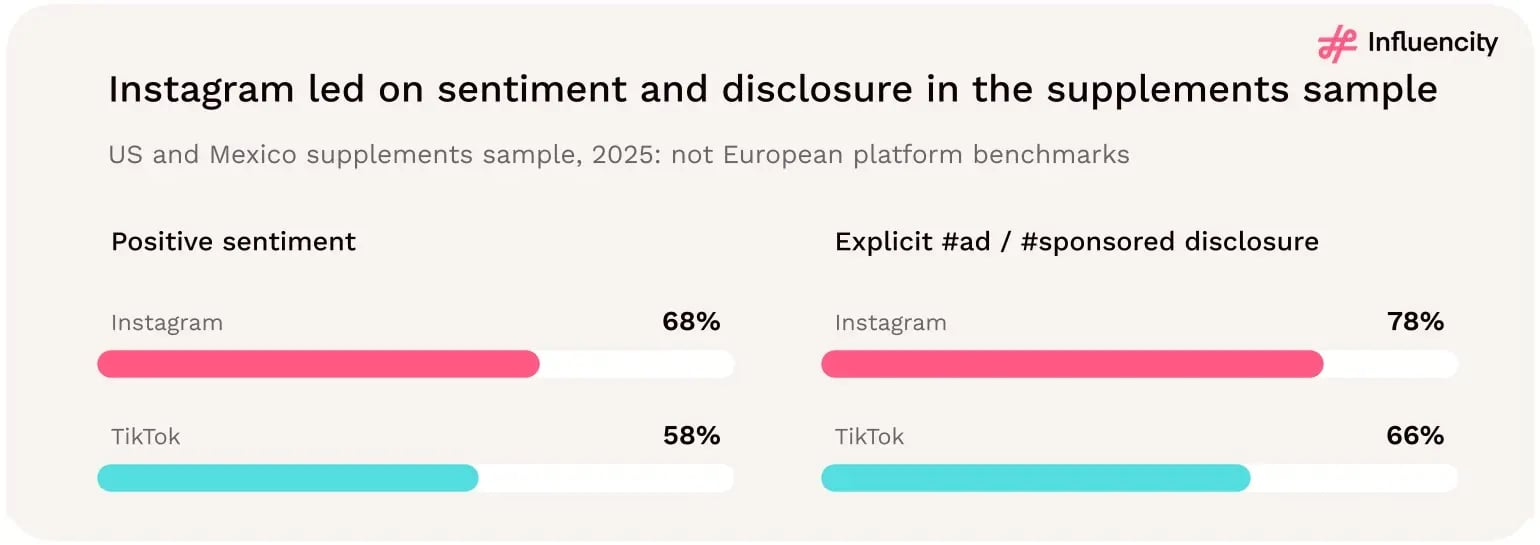
Figure 59 → In Influencity's US and Mexico supplements sample, Instagram recorded higher positive sentiment and explicit disclosure than TikTok. These findings are not European benchmarks. Source: [7].
The data does not justify choosing one platform solely because it has more eligible creators or a higher creator-density ratio. Instead, platform selection should begin with the campaign objective and the audience the brand needs to reach.
The regional estimates suggest that Instagram has a larger estimated audience than TikTok in the regional comparison.
But regional audience size does not establish which platform offers better access to a specific demographic, country or consumer segment. That requires audience-level evidence.
A platform may have a large eligible creator pool without having a large number of creators suitable for a particular brief. Brands should compare creators by country, category, follower tier, audience geography, content style and availability.
The regional headline count is only the starting point.
Instagram and TikTok have different content environments and publishing conventions. A campaign should be designed for the formats and audience expectations of the selected platform. The study's density figures do not measure creative effectiveness.
Creator fees, usage rights, production requirements, timelines and deliverables can differ between creators and campaigns. None of these variables is captured by creator density.
Where both platforms are viable, brands can test comparable creator briefs and evaluate results against the same objective. Depending on the campaign, relevant measures may include qualified reach, engagement, traffic, conversions, cost per result or brand lift.
Reading the study. Planning tip: Use the cross-platform density figures to frame discovery questions. Use audience, creator and campaign evidence to make the final platform decision.
1. Compare like with like. Align geographic coverage, eligibility rules, dates and measurement methods wherever possible.
2. Keep profiles separate from people. Platform-specific eligible account counts are not deduplicated creator counts.
3. Distinguish supply from performance. More eligible creators do not automatically mean better campaign outcomes.
4. Use regional statistics as context. Platform decisions should ultimately be based on the creators and audiences relevant to the campaign.
The TikTok summary contains approximately 21.4 million eligible TikTok profiles, compared with 12.41 million on Instagram.
The estimates are 294.5 million users for Instagram and 252.3 million for TikTok.
These inputs imply densities of approximately 8.48% and 4.21%, respectively.
The reconciled US totals produce a TikTok-to-Instagram density ratio of approximately 2.04, close to Europe's provisional 2.01.
A matched European TikTok dataset is needed to establish a robust like-for-like platform comparison.
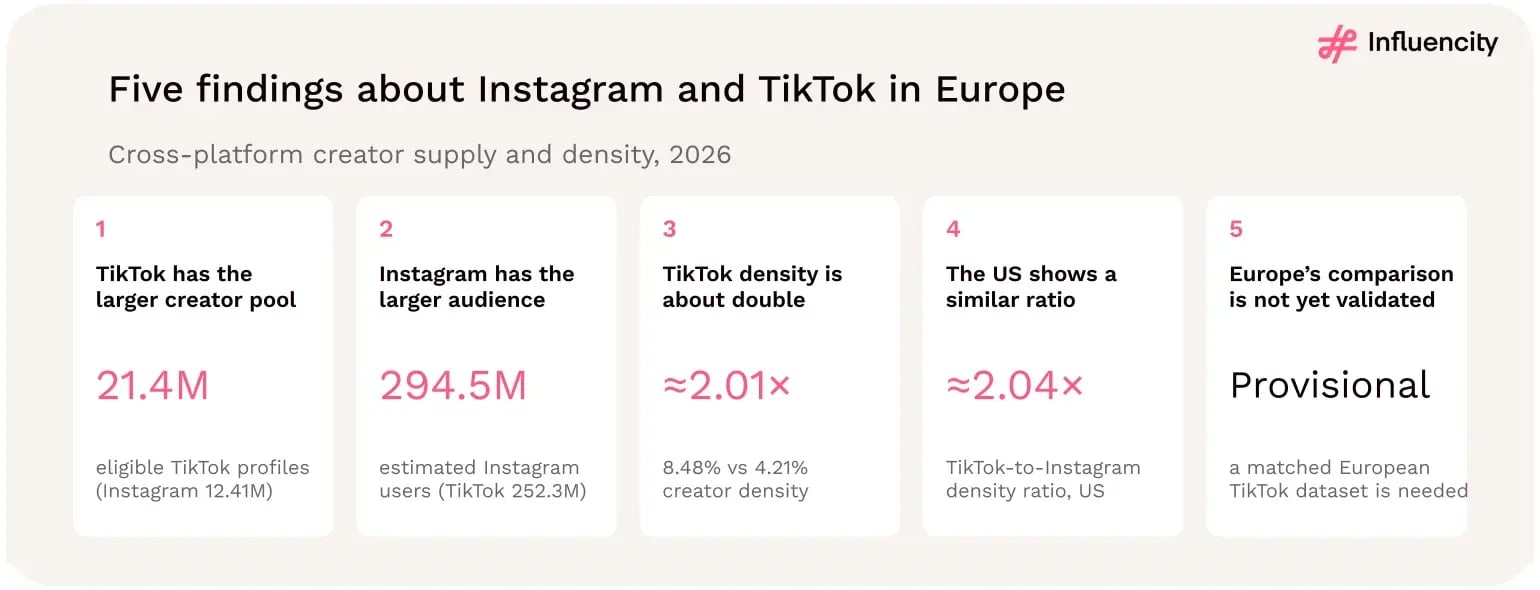
Figure 60 → The data suggests higher TikTok creator density in Europe, but platform comparability remains a methodological limitation. Sources: [1, 4, 5, 6].
The European data suggests that TikTok has a larger eligible creator pool than Instagram despite having a smaller estimated audience.
That combination produces a calculated creator density approximately twice Instagram's. The similarity with the reconciled US comparison makes the European pattern plausible. But plausibility is not methodological equivalence.
The European TikTok figures have not been validated against a matched country-level dataset, and differences in eligibility rules, geographic coverage, account types and observation dates may affect the comparison. The figures also do not identify unique creators across platforms or measure commercial performance.
The central finding is that TikTok appears to have more recorded creator supply relative to its estimated audience, not that it offers twice the influencer marketing opportunity. For researchers, the priority is harmonizing the underlying datasets. For brands and agencies, the priority is evaluating creators and audiences at the level where campaigns actually operate.
A higher creator-density ratio may be an interesting characteristic of a platform ecosystem. It is not a substitute for evidence about relevance, reach, cost or results.
Campaign planning takeaway. Use regional creator-density comparisons as context for platform discovery, not as a platform-selection score. Validate creator availability, audience geography, content relevance and commercial performance before allocating budget between Instagram and TikTok.
The most immediately visible difference is the number of reported eligible profiles. The 2020 study reported approximately 8.6 million. The 2023 edition, describing 2022 data, reported just over 10.5 million. The 2026 study reports approximately 12.4 million.
The estimated Instagram audience also increases across the editions, from 213 million to 252.1 million and then to approximately 294.5 million. These are meaningful differences between published snapshots. But a difference between snapshots is not automatically a measured change in the same underlying population.
The 2023 edition describes data observed in 2022. Referring to its figures simply as “2023 data” would misstate the timeline. For consistency, the historical analysis should use 2022 when describing the observation and the 2023 edition when identifying the publication.
This distinction also matters for charts. Placing the middle observation at 2023 would imply a different interval between data points.
Reading the study. The historical series contains three reference points—2020, 2022 and 2026—not three fully comparable annual measurements.
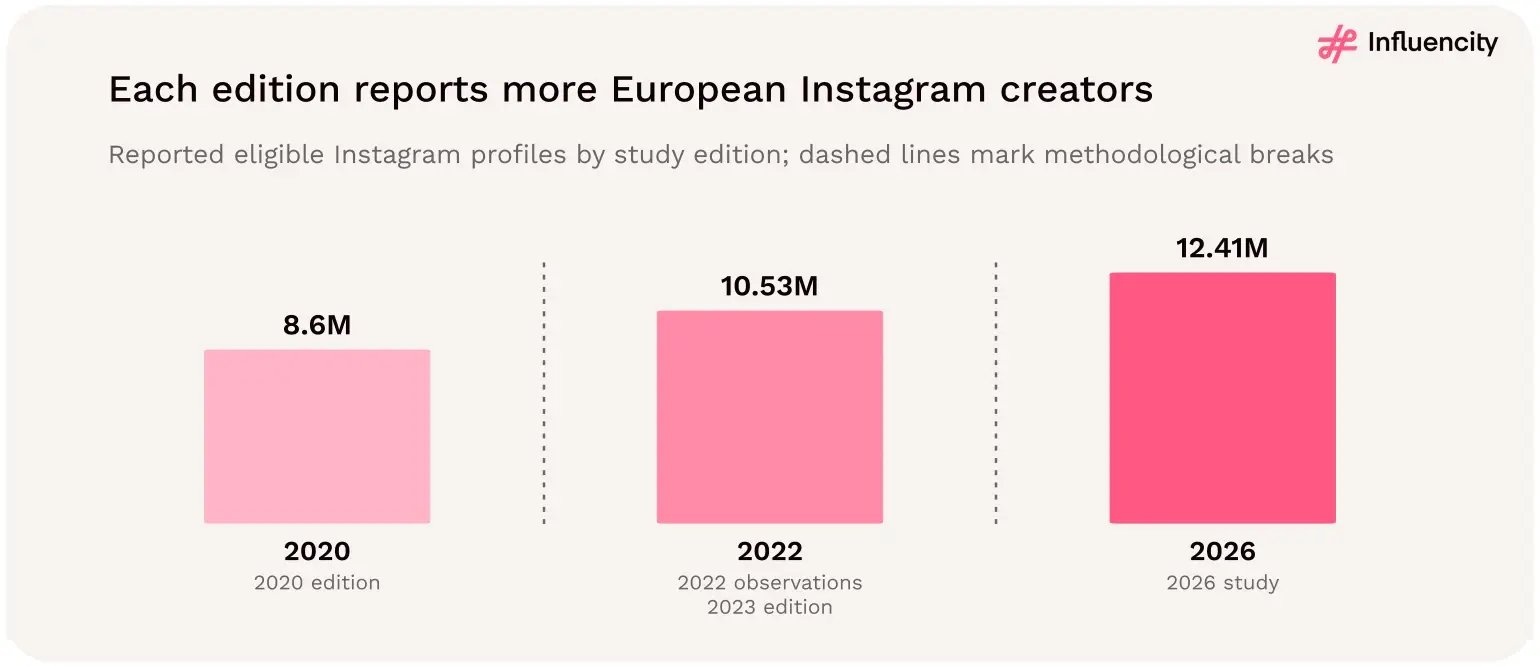
Figure 61 → Reported European Instagram creator counts are higher in successive Influencity study editions, but methodological differences prevent interpretation as a validated longitudinal growth series. Sources: [1–3].
The 2026 study reports 12,407,130 eligible profiles, compared with 10,526,558 in the 2022 observation. The difference is 1,880,572 profiles. Expressed relative to the earlier count, that is an increase of approximately 17.9%.
Against the rounded 2020 baseline of 8.6 million, the 2026 count is approximately 44.3% higher.
The audience estimates follow a broadly similar direction to the creator counts.
Between the 2022 observation and 2026, the reported eligible creator count is 17.9% higher, while the estimated Instagram audience is approximately 16.8% higher.
Those two percentages are close. That similarity helps explain why calculated creator density changes so little between the editions.
A rise in creator profiles is easier to interpret when considered alongside the size of the platform's estimated audience.
If creator counts increase while estimated audience remains constant, creator density rises. If creator counts and estimated audience increase in similar proportions, creator density remains relatively stable. The latter is what the published European figures suggest.
However, the estimated audience figures are not necessarily harmonized counts of unique European Instagram users. The comparison remains conditional on the methods used in each edition.
Reading the study. The reported expansion in creator profiles is accompanied by a broadly similar increase in estimated Instagram audience. This makes the historical density pattern more informative than creator counts alone.

Figure 62 → Reported eligible creator counts and estimated Instagram audiences are higher in successive European study editions. Sources: [1–3].
Creator density is calculated by dividing the number of reported eligible profiles by the estimated platform audience. Using that formula across the published historical figures produces:
The figures are remarkably close. Between 2022 and 2026, the calculated density changes from approximately 4.18% to 4.21%. That is a difference of only about 0.04 percentage points. Between 2020 and 2026, the change is approximately 0.18 percentage points.
Conditionally, it suggests that the number of recorded eligible creator profiles has remained broadly proportional to the estimated Instagram audience across the three editions.
The creator pool becomes larger in absolute terms, but not dramatically larger relative to the reported user base. That is a different narrative from one in which creator supply is rapidly outpacing platform audience size.
No. The study does not measure market maturity directly. It does not establish whether creators are earning more, whether brands are investing more, whether creator activity is increasing or whether competition is intensifying. Nor does it establish that the density ratio was measured using perfectly consistent definitions over time.
A relatively stable calculated ratio is compatible with several possible industry conditions. It should not be used as proof of any one of them.
No. The historical editions do not track a fixed group of accounts. A stable aggregate ratio could coexist with substantial changes in the identities, activities and follower counts of individual profiles. The data cannot reveal creator entry, exit or retention.
Reading the study. The historical figures suggest relative stability in the reported supply-to-audience ratio, not necessarily stability in the creator population itself.
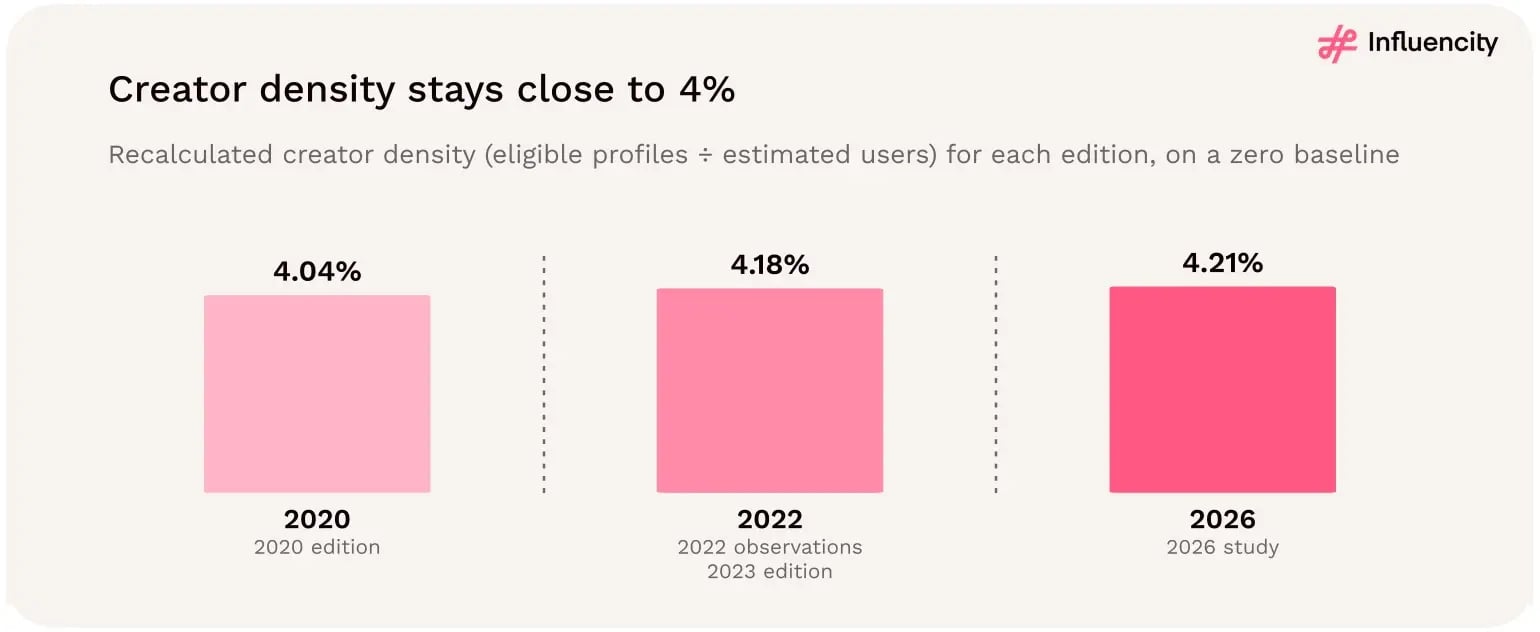
Figure 63 → Recalculated European Instagram creator density remains close to 4% across the 2020, 2022 and 2026 observations, although the underlying editions are not fully harmonized. Sources: [1–3].
The principal limitation is comparability. The historical studies were produced as separate snapshots rather than as a single longitudinal panel following the same accounts.
The 2023 publication, using 2022 observations, specified public profiles belonging to people over 18 with more than 1,000 followers. [3] The 2020 edition used five follower bands. [2] The current 2026 study reports eligible profiles using its own documented criteria and four follower tiers.
These differences matter because the definition of an eligible profile determines which accounts enter the count. A change in the threshold, account-type rules or treatment of public and private profiles could alter the reported population even without an equivalent change in the underlying platform.
A later study may identify accounts that an earlier study did not capture. Improved coverage can increase a reported count without demonstrating that every additional account is newly created.
Conversely, changes in coverage could exclude accounts previously counted. The historical material does not quantify those effects.
Accounts may be classified differently across editions. That can affect eligibility, follower-tier assignment and geographic reporting. The study does not provide a complete harmonization analysis of those classifications.
A valid European growth comparison requires consistent geographic coverage. If the set of included countries changes, regional totals can change for reasons unrelated to within-country creator growth.
The current study covers 30 markets. The historical totals should not be assumed to cover an identical footprint without confirming their country lists.
A longitudinal panel would follow the same defined entities over time. These studies instead provide separate aggregate observations. As a result, they cannot establish:
Those are different questions from the total number of profiles reported in each edition.
Reading the study. The historical series is valuable for contextual comparison, but it does not support precise claims about creator entry, exit, retention or industry growth under a constant methodology.
Several mechanisms could contribute to differences between study editions. The available historical comparison does not quantify their relative importance.
More accounts may have reached the study's eligibility thresholds. Existing accounts may have gained followers, and new accounts may have entered the platform. These are plausible sources of change, but the aggregate snapshots do not measure them directly.
Profiles may become public or private over time. Because eligibility can depend on account visibility, those changes may affect recorded totals. The studies do not provide comparable transition counts.
Different eligibility rules can include or exclude different groups of accounts. Even a small definitional change can matter when applied to a population measured in millions.
The way profiles are associated with European markets may also affect regional counts. Without a consistent assignment method, the historical totals cannot be treated as fully equivalent.
Reading the study. A reported increase can contain both real-world change and measurement change. The published snapshots do not provide enough information to separate them.
The historical data is useful for understanding the scale of the recorded European Instagram scene. It is less useful for predicting future creator supply or campaign performance.
The 2026 study reports more eligible profiles than earlier editions. But it does not establish that more creators are available for partnerships, responsive to outreach or commercially suitable.
Recruitment capacity depends on the qualified creator population, not simply the headline count.
A supply-to-audience ratio cannot establish how intensely creators compete for attention. Competition depends on factors such as content volume, audience behavior and platform distribution, none of which is measured by the historical density series.
The historical comparison contains no consistent time series of creator fees, conversion rates, engagement or ROI. It cannot establish whether influencer marketing has become more or less expensive or effective since 2020.
For practical campaign decisions, the 2026 country-level and follower-tier findings are more directly useful than the unharmonized historical totals.
Brands can use the current study to compare eligible supply across markets and follower tiers. They should then qualify individual creators using audience, content and commercial evidence.
Reading the study. Use the historical figures to explain the evolution of Influencity's reported datasets. Use the current, internally consistent study to make creator-discovery decisions.
The US series provides a further point of context. As section 13 shows, Influencity's US historical observations show a different pattern over the same observation years. [5] That contrast matters because it cautions against assuming that all Instagram creator ecosystems evolve in the same way.
However, the European and US historical series should not be treated as directly comparable growth trajectories unless their eligibility rules, geographic definitions and observation methods are aligned.
It can show that the published regional snapshots differ in their reported counts and calculated density patterns. It cannot, without harmonization, establish that one market's creator industry grew faster or matured earlier than the other.
Brands operating across Europe and the United States should avoid extrapolating creator-market trends from one region to another. Current creator availability, follower-tier composition and audience characteristics are more relevant to campaign planning than a presumed shared historical trajectory.
Reading the study. Different regional histories reinforce the need for local market evidence. A global creator strategy should not assume that platform supply evolves uniformly across geographies.
The 2026 study reports 12.41 million eligible profiles, compared with approximately 8.6 million in the 2020 edition.
That represents a 17.9% difference between the published totals.
The reported audience increases from 213 million in 2020 to approximately 294.5 million in 2026.
The historical ratios are approximately 4.04%, 4.18% and 4.21%.
Differences in definitions, data coverage and observation methods prevent the snapshots from being interpreted as a harmonized longitudinal series.
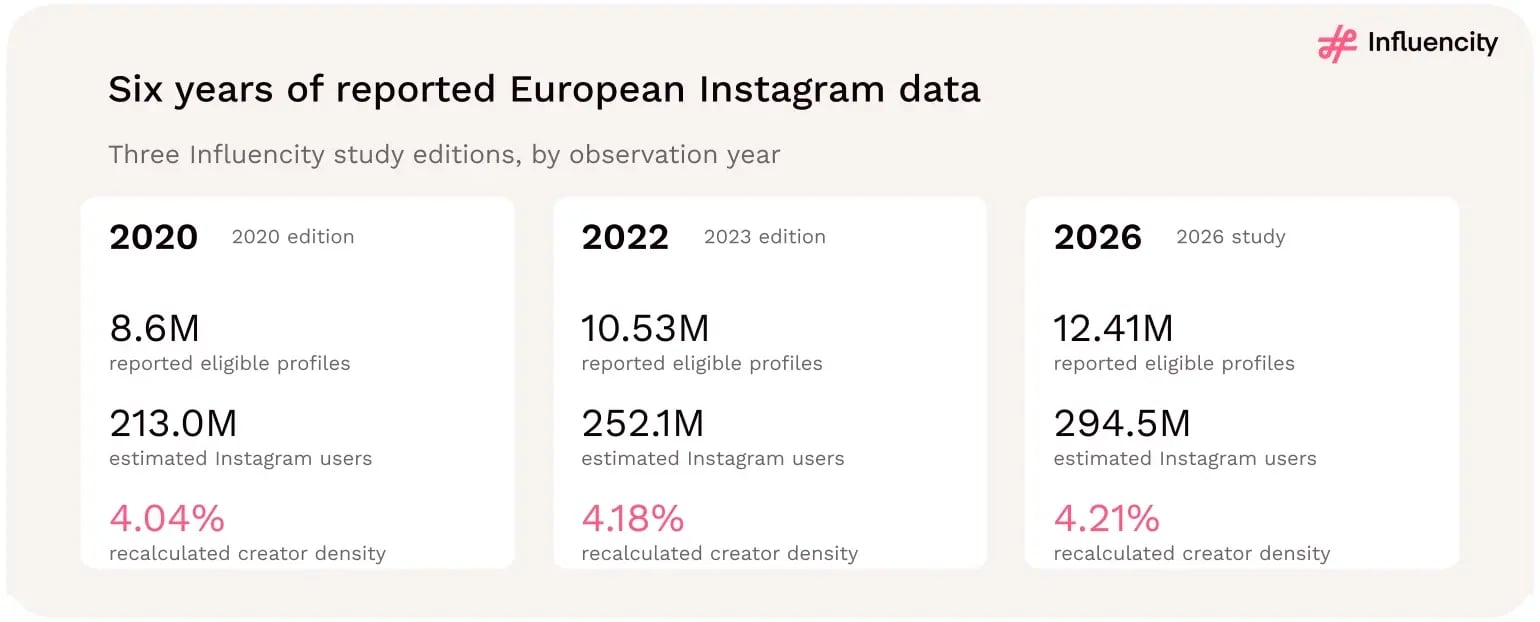
Figure 64 → Influencity's historical European Instagram editions report higher profile counts and estimated audiences while calculated creator density remains close to 4%. Sources: [1–3].
Influencity's European Instagram studies tell a consistent descriptive story. The published creator counts are higher in successive editions. The estimated Instagram audiences are also higher.
Yet the ratio between those two measures remains remarkably close to 4%. The 2026 study reports approximately 12.4 million eligible profiles, compared with 10.5 million in the 2022 observation and about 8.6 million in 2020.
But the calculated creator density moves only from approximately 4.04% to 4.21% across those reference points. This is not evidence that Europe's influencer industry has grown by a precisely measurable percentage.
Nor is it proof that the market has reached maturity or that competition has stabilized. The historical editions do not provide the harmonized methodology needed for those conclusions.
What they do show is that Influencity's reported European Instagram creator pool has become larger alongside its estimated audience, without a comparable increase in the creator-to-audience ratio.
For researchers, the next step is methodological harmonization. For brands and agencies, the lesson is to distinguish historical scale from current market opportunity. A larger recorded creator population does not automatically mean more qualified creators, lower recruitment costs or better campaign outcomes.
The most useful evidence remains the current supply available in the countries, follower tiers and audience segments relevant to a campaign.
Campaign planning takeaway. Use the historical editions to understand how reported European Instagram figures have changed. Avoid treating differences between snapshots as verified growth rates. For campaign planning, prioritize current country-level creator supply, audience relevance and commercial suitability.
Three contrasts define the regional comparison. First, Europe has substantially more eligible profiles in absolute terms. Second, the US has higher creator density and more eligible profiles per resident. Third, Europe's creator supply is more concentrated in its six largest markets, while US state-level creator density varies across a wider range.
These findings describe different dimensions of the industry. They should not be collapsed into a single judgment about which region has the stronger influencer market.
Reading the study. Europe's advantage is absolute scale. The US advantage is relative concentration. Their different geographic structures make market-level analysis essential.
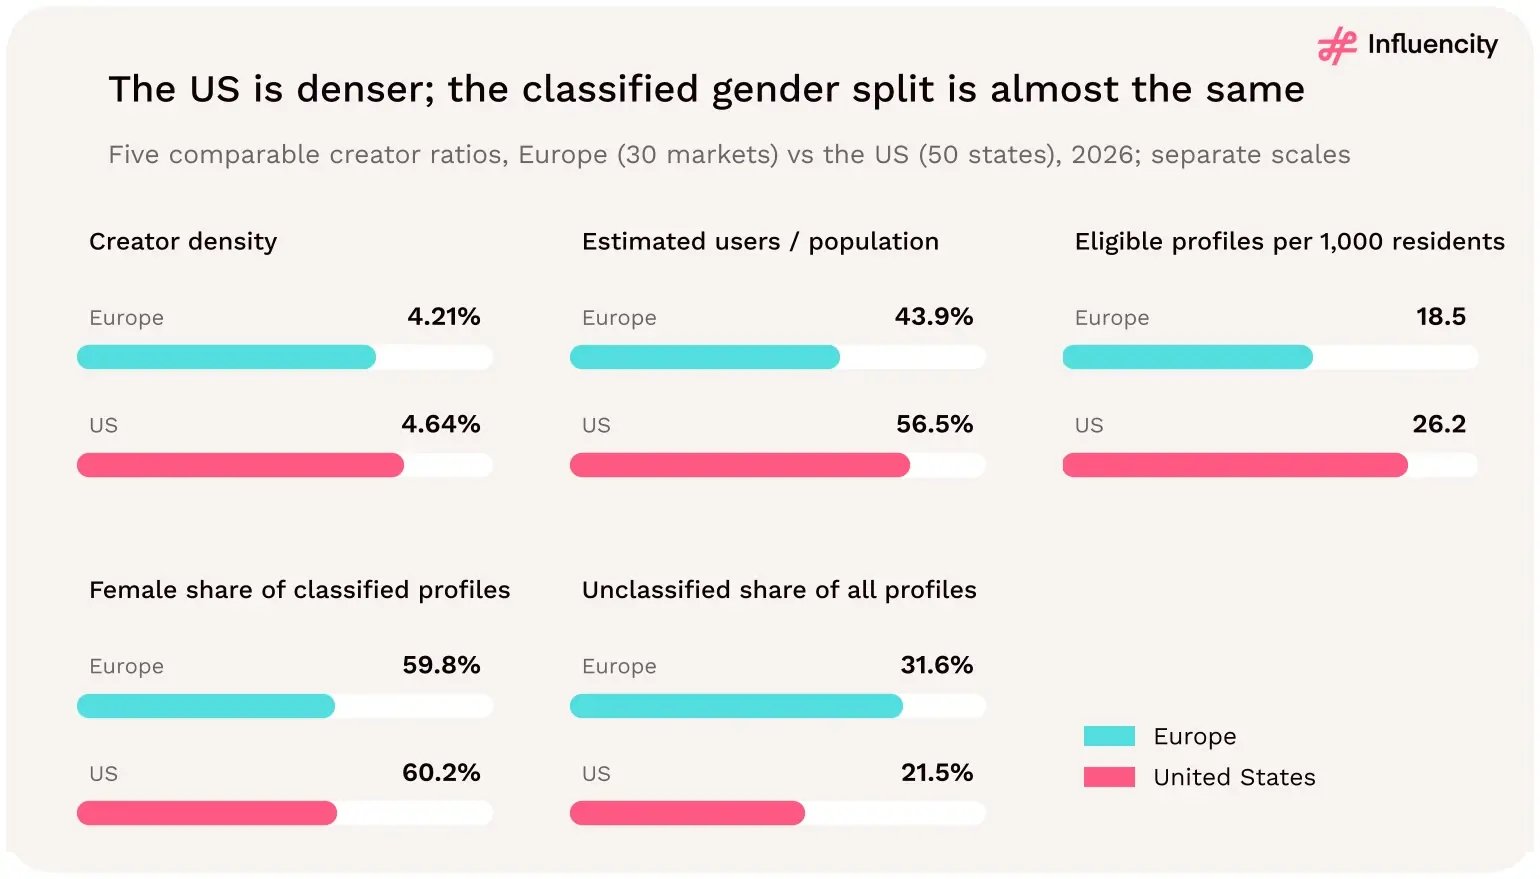
Figure 65 → Europe has more eligible Instagram profiles overall, while the US records higher creator density, estimated audience penetration, and profiles per resident. Gender classification also differs between the datasets. Sources: [1, 5].
The apparent contradiction disappears when population and estimated platform audience are taken into account. Europe's 30 markets contain approximately 670.2 million residents, compared with 341.1 million across the US states. That means the European study population is approximately 1.96 times the US population. But Europe's eligible creator pool is only approximately 1.39 times the US pool.
Europe records approximately 12.41 million eligible profiles. The US records approximately 8.94 million. That is a substantial absolute difference. Yet Europe also has almost twice the population. As a result, its eligible profiles are distributed across a much larger population reference.
This produces:
The US figure is approximately 42% higher.
The estimated Instagram audience represents approximately 43.9% of Europe's population reference. In the US, the corresponding ratio is 56.5%.
That difference matters because profiles per resident reflects both estimated platform audience penetration and creator density. The relationship can be expressed as:
Eligible profiles / population = (eligible profiles / estimated users) × (estimated users / population)
Europe has a lower value on both components. Its estimated Instagram audience represents a smaller proportion of the population, and its eligible creator pool is slightly smaller relative to that audience.
The audience-to-population difference accounts for most of the gap in eligible profiles per resident.
When the comparison uses estimated Instagram users rather than the total population, the regional difference narrows considerably. Europe's creator density is 4.21%. The US creator density is 4.64%. That is a difference of 0.43 percentage points.
In relative terms, the US density is approximately 10% higher. This is a much narrower gap than the difference in eligible profiles per resident.
Reading the study. Europe's larger population produces a larger absolute creator pool, but the US has a higher estimated Instagram audience-to-population ratio. Once creator supply is measured against estimated platform users, the difference between the regions becomes much smaller.
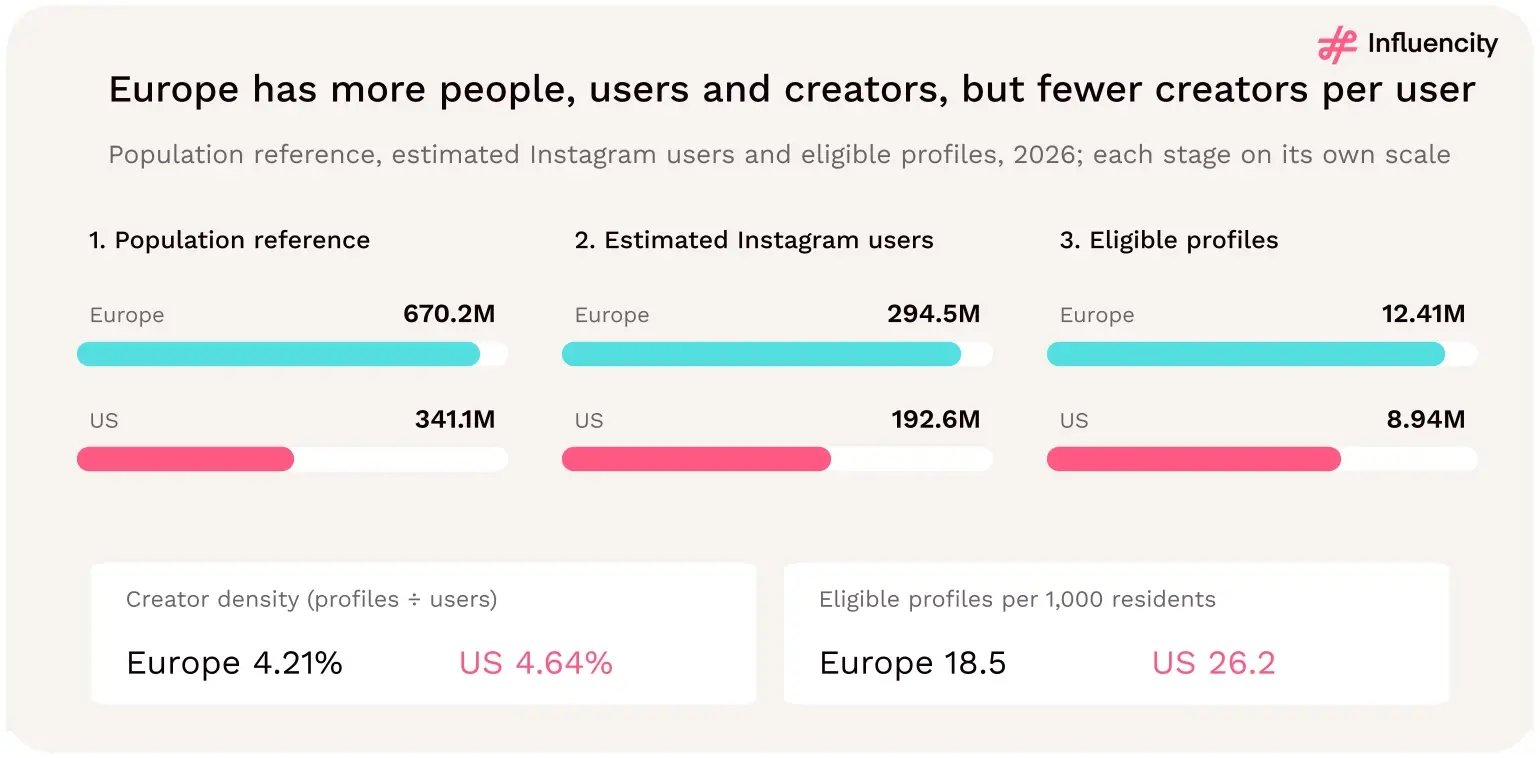
Figure 66 → Europe's larger population supports a larger absolute creator pool, but the US records more eligible Instagram profiles relative to both estimated users and residents. Sources: [1, 5].
Europe's eligible creator population is more concentrated in its largest markets. The six largest European creator markets account for 76.7% of the regional pool. In the US, the six largest states account for 57.9%. That is a difference of 18.8 percentage points.
Russia alone accounts for approximately 23.2% of the eligible profiles in the European study. The United Kingdom, Italy, Spain, Germany and France make up the remainder of the six largest creator markets. Together, these six countries account for more than three-quarters of all eligible profiles across the 30-market study.
California is the largest US market, accounting for approximately 20.2% of eligible profiles. However, the six largest US states collectively account for a smaller share of the national pool than Europe's six largest markets do.
This indicates a less concentrated distribution of total eligible supply across the US geographic units.
Keep in mind that a European country is not equivalent to a US state. The two systems differ in population distribution, geographic boundaries, economic structure and the number of units being compared. Europe's dataset contains 30 national markets. The US dataset contains 50 states.
A top-six concentration comparison therefore describes the distribution within each study, not a perfectly equivalent measure of geographic concentration.
Reading the study. Europe has a more concentrated recorded creator pool across its study markets. That concentration may simplify initial discovery in large countries, but it does not eliminate the need for country-specific recruitment.
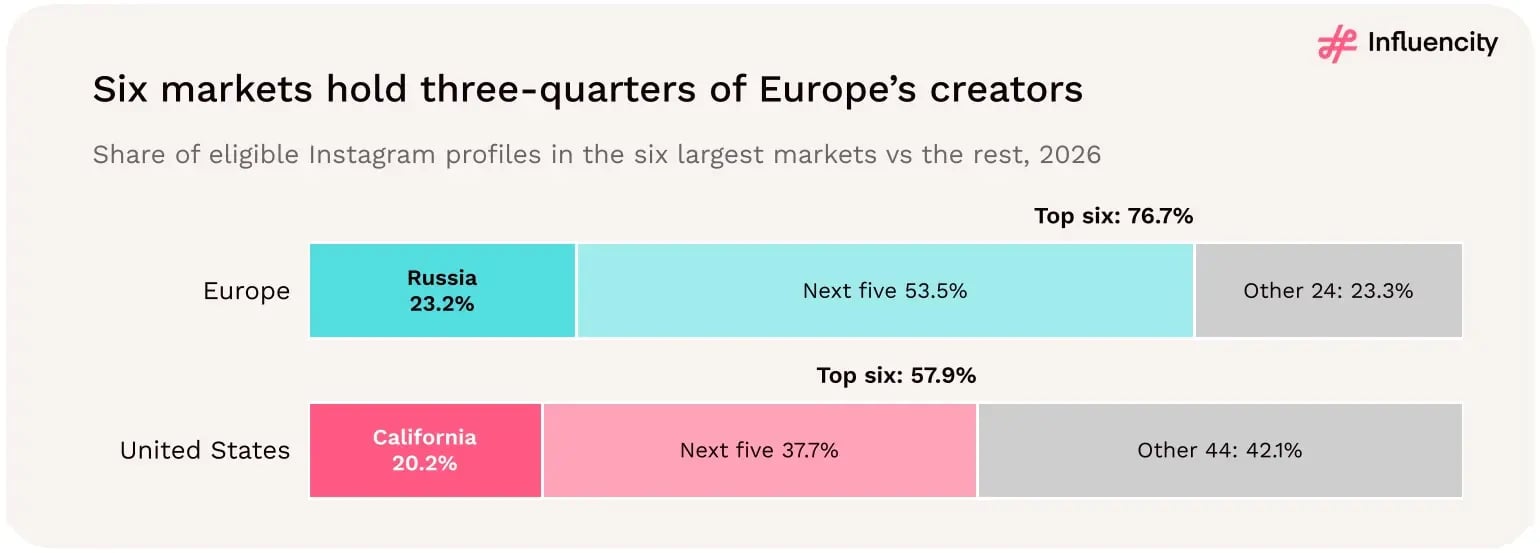
Figure 67 → Europe's six largest creator markets account for a greater share of regional eligible profiles than the six largest US states. Sources: [1, 5].
The range of creator density is much wider across US states. In the United States, density runs from 1.58% in South Dakota to 9.80% in New York. Across the 30 European markets, it runs from 2.69% in Luxembourg to 5.57% in Cyprus.
New York's creator density is approximately 6.2 times South Dakota's. The difference between the highest and lowest US values is 8.22 percentage points.
Cyprus's creator density is approximately 2.1 times Luxembourg's. The difference between the highest and lowest European values is 2.88 percentage points.
Europe's weighted creator-density benchmark is 4.21%. The US benchmark is 4.64%. Only nine markets in each dataset exceed their own regional benchmark:
This does not mean the remaining markets lack meaningful creator supply. It means their creator-density ratios fall below the weighted regional figure. A weighted regional benchmark is not the same as the median geographic unit.
The data establishes a wider range. It does not establish a single cause. Several factors may be relevant, including the concentration of media and creative industries, local creator communities, geographic assignment practices and the construction of estimated platform audiences.
The study does not isolate their effects. The comparison is also influenced by the geographic units themselves. US states and European countries are not equivalent units of analysis.
National US averages may conceal substantial state-level differences. Similarly, European regional averages can obscure differences between individual countries, even though the observed density range is narrower.
For campaigns targeting specific geographies, market-level figures are more useful than a regional average.
Reading the study. The US has higher overall creator density, but it also has much greater variation across states. Europe has a lower weighted benchmark and a narrower observed range across its 30 markets.

Figure 68 → Creator density varies much more widely across US states than across the 30 European markets. Sources: [1, 5].
At the broad regional level, yes. Among profiles classified as female or male, the female share is almost identical:
The difference is less than half a percentage point. However, that similarity conceals an important methodological difference.
In Europe, 31.6% of eligible profiles have no female or male classification. In the US, the corresponding share is 21.5%.
That is a difference of 10.0 percentage points. As a result, the female/male-classified subset covers a smaller proportion of Europe's eligible creator pool. The 59.8% European female share is calculated among profiles classified as female or male. It is not the share of all eligible European profiles classified as female.
Across the full European eligible pool, approximately 40.9% of profiles are female-classified. The distinction is essential because nearly one-third of European profiles are unclassified.
The same denominator principle applies to the US comparison. A similar female share among classified profiles does not mean the two datasets have identical gender coverage.
The classified subsets have similar female/male proportions. But the European dataset has substantially less classification coverage. Brands should not use either regional female share as a proxy for the gender composition of creators' audiences. Audience targeting requires follower-level demographic evidence.
Reading the study. Always report the female share among classified profiles alongside the unclassified share of the full eligible pool. Otherwise, the apparent similarity between regions can conceal important differences in data coverage.
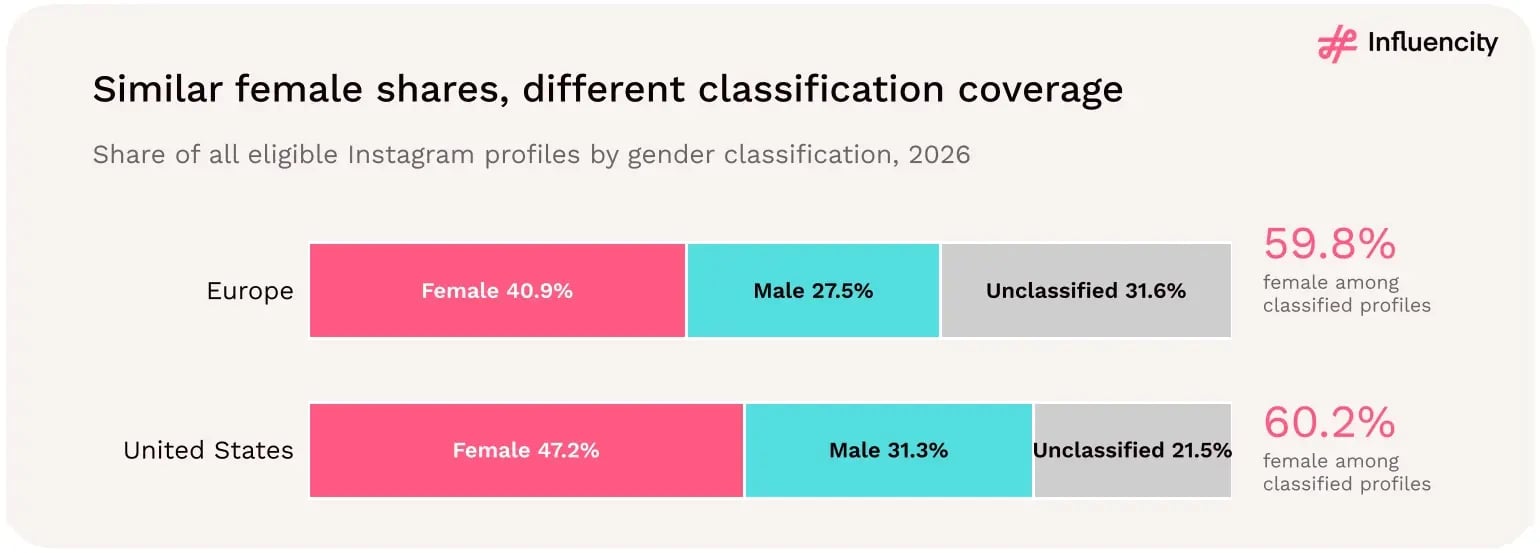
Figure 69 → Europe and the US have similar female shares among classified Instagram creators, but Europe's unclassified share is substantially higher. Sources: [1, 5].
The regional similarity becomes less pronounced at the top of the follower ladder. Among female/male-classified mega-tier entries:
Europe's classified mega tier therefore has a male majority. The US classified mega tier is close to parity. It shows that similar overall gender distributions do not guarantee similar distributions within follower tiers. Across all classified eligible profiles, Europe and the US have nearly identical female shares.
Among classified mega creators, their distributions differ by 5.6 percentage points. This is relevant to understanding the composition of the largest recorded accounts.
It does not establish that male creators are more commercially successful in Europe. It does not establish differences in earnings, campaign demand or performance. Nor does it identify the gender composition of mega creators' audiences. The figures describe classification patterns within a small follower tier.
Europe's mega tier contains 8,219 reported entries, including 1,856 unclassified entries. The female/male percentages are calculated only among the 6,363 classified mega entries. They should not be presented as percentages of all mega accounts. The same denominator discipline should be applied to the US figures.
Reading the study. Europe and the US look almost identical on the overall classified gender split, but their largest creator tiers differ. Aggregate similarity can conceal meaningful differences in follower-tier composition.
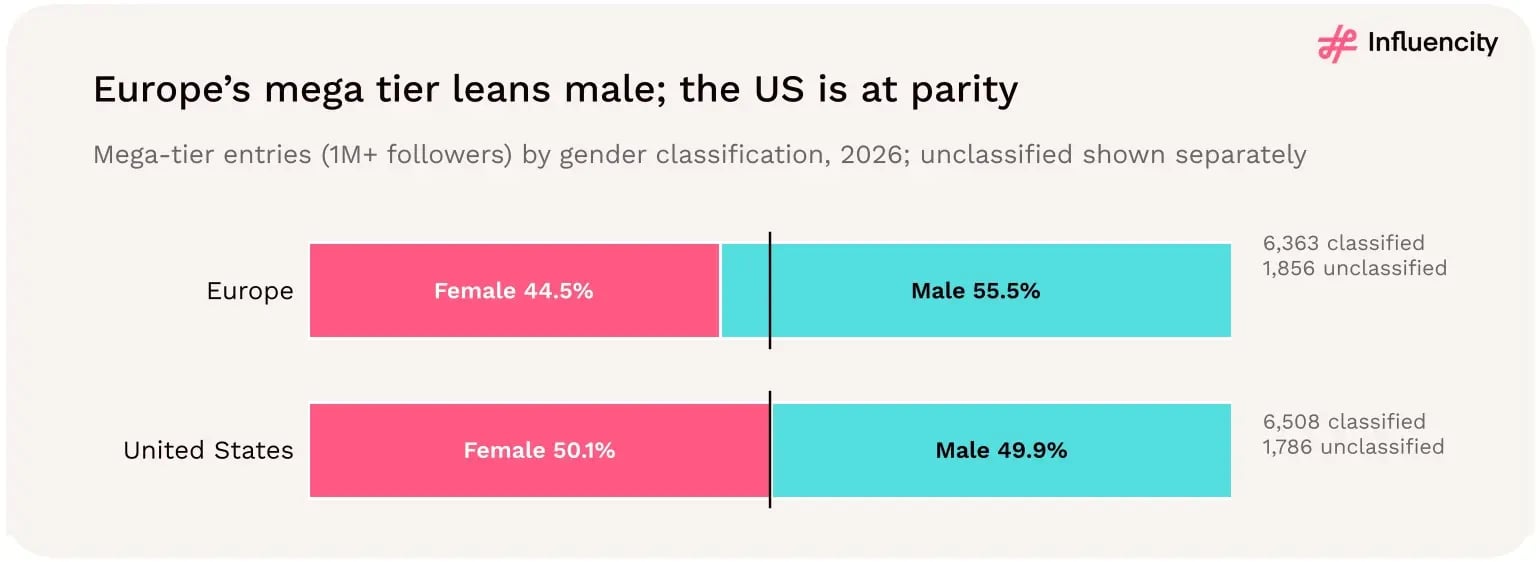
Figure 70 → Europe's classified mega-tier population has a male majority, while the US classified mega tier is close to parity. Sources: [1, 5].
At the broadest level, both creator ecosystems are dominated by smaller profiles.
Europe's nano tier accounts for 87.3% of reported follower-tier entries. The US nano share is approximately 89% of headline eligible profiles, using the study's residual calculation. Both figures indicate that the overwhelming majority of recorded eligible accounts belong to the smallest follower tier.
But the two percentages are not calculated from exactly the same denominator.
Europe's nano share is calculated using the sum of its reported follower-tier entries. That total is 12,391,068, approximately 0.13% below the European headline eligible count.
The US nano share uses the headline eligible-profile total, with nano derived as the residual after accounting for larger tiers. These differences should be disclosed when placing the percentages side by side.
Both regions have broad populations of smaller eligible profiles. Neither is primarily composed of macro or mega creators. This supports the importance of nano and micro discovery in both markets.
But it does not establish that smaller creators perform better or that their commercial availability is comparable.
A campaign recruiting creators above 100,000 followers needs the relevant macro and mega counts. A campaign recruiting smaller local creators needs qualified nano and micro supply.
The broad regional nano share provides context, but the actual recruitment pool depends on country, state, category and audience requirements.
Reading the study. Planning tip: Compare tier counts using consistent definitions and denominators. Avoid assuming that similar nano shares imply identical recruitment conditions.
The figures suggest a similar cross-platform pattern in Europe and the United States. In Europe, the regional TikTok summary implies a creator-density ratio of approximately 2.01 times Instagram's. In the US, the reconciled TikTok and Instagram datasets produce a ratio of approximately 2.04 times.
From the 2022 observation to 2026:
Relative to the 2020 editions:
These are differences between published snapshots. They are not validated creator-industry growth or decline rates.
The earlier editions may differ in eligibility criteria, geographic coverage, account classification and database completeness. The studies do not follow a fixed panel of creators over time.
Therefore, the apparent divergence between Europe and the US cannot be attributed confidently to differences in creator participation, platform adoption or market maturity. The data does not establish why the historical counts moved differently.
The published European and US series show different changes in reported creator counts. That is an important descriptive finding.
But determining whether the underlying creator populations genuinely evolved in different directions requires harmonized longitudinal data.
Reading the study. The historical snapshots diverge, while the current 2026 datasets show broadly comparable Instagram creator-density ratios. Those findings can coexist because historical change and current structure are different questions.
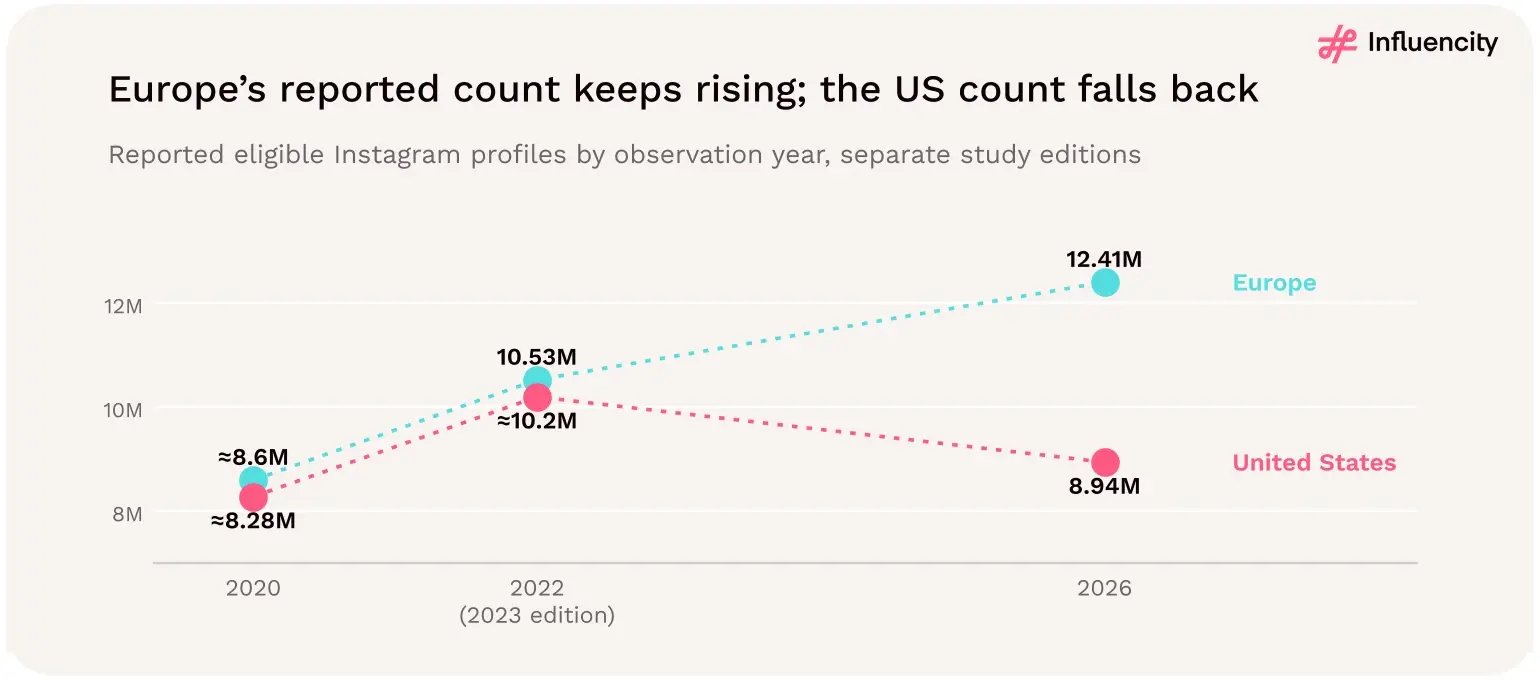
Figure 71 → Published European and US Instagram creator counts differ in their historical patterns, but methodological breaks prevent direct interpretation as verified growth or decline. Sources: [1–3, 5].
The comparison has practical implications for brands operating in both Europe and the United States. But those implications should be applied at the market and creator level rather than through regional averages alone.
Europe's 30 markets contain a larger eligible creator pool, but most of that supply is concentrated in six countries.
The US has a smaller total pool but a wider range of state-level creator densities. Neither regional average tells a brand how many suitable creators are available for a specific brief.
European campaigns may cross multiple national languages, regulatory systems and cultural contexts. A creator's location does not guarantee that their audience is concentrated in the same country. Transatlantic campaigns require audience geography and local market suitability to be checked directly.
Both regions are dominated by nano creators. But the composition of established and mega-tier populations differs. A campaign requiring large creators should use tier-specific counts and audience qualification rather than total eligible supply.
Europe has a substantially higher unclassified share than the US. Comparisons of female and male creator shares should therefore show the classified denominator and the proportion of the total pool that remains unclassified.
The US has higher Instagram creator density. That does not establish that US creators are more engaged, more professional, more affordable or more effective.
Likewise, Europe's larger absolute pool does not establish superior recruitment opportunities.
Historical editions provide context, but their figures are not fully harmonized. Campaign planning should prioritize the current eligible supply, relevant audience data and actual creator availability.
Reading the study. Planning tip: Build separate country- and state-level recruitment plans, then compare the qualified creator supply using consistent campaign criteria. Regional density is a useful starting point, not the final decision metric.
The 30 European markets record 12.41 million eligible profiles, compared with 8.94 million in the US.
The US records 4.64% creator density, compared with 4.21% in Europe.
The US records 26.2 profiles per 1,000 residents, compared with 18.5 in Europe.
The six largest European markets account for 76.7% of eligible profiles, compared with 57.9% across the six largest US states.
The US range is 1.58%–9.80%, compared with 2.69%–5.57% across European markets.
Female shares among classified profiles are 59.8% in Europe and 60.2% in the US, while unclassified shares are 31.6% and 21.5%, respectively.
The current Instagram datasets are relatively aligned. Historical editions are not fully harmonized.
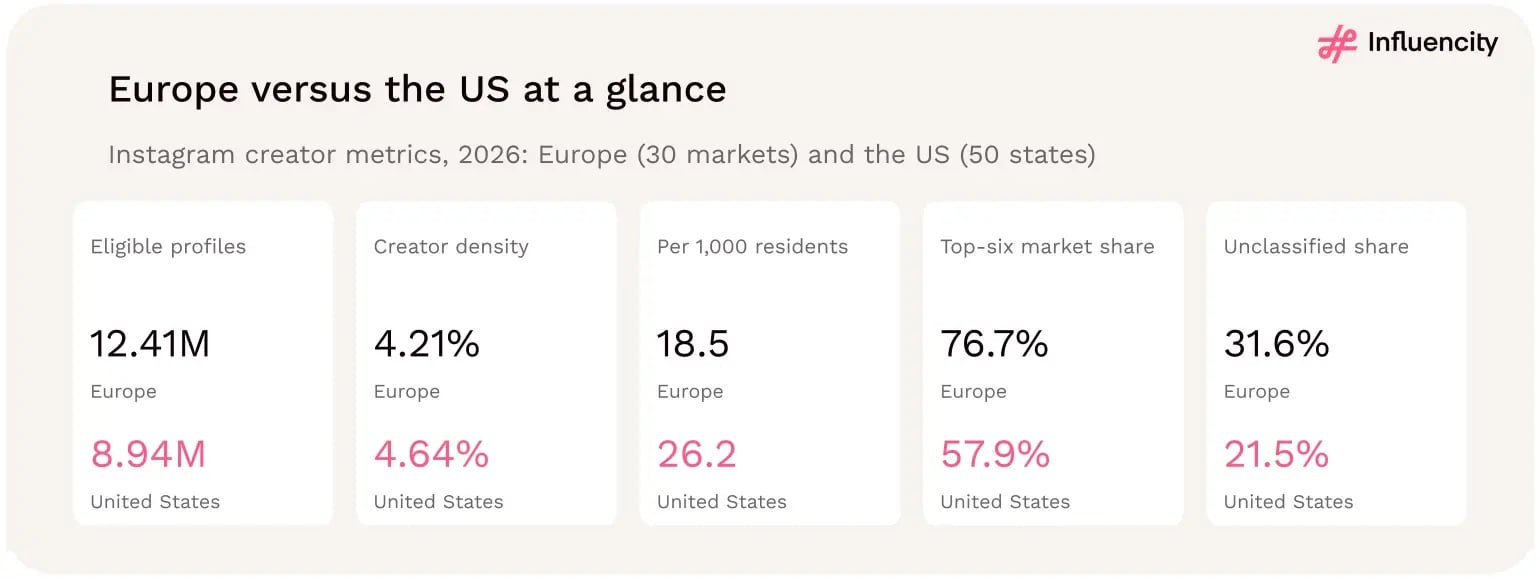
Figure 72 → Europe's Instagram creator pool is larger, while the US has higher relative creator concentration and a wider range of state-level density. Sources: [1, 5].
The 2026 Instagram comparison reveals two substantial creator ecosystems with different geographic structures. Europe records approximately 12.41 million eligible profiles across 30 markets.
The United States records approximately 8.94 million across 50 states. Europe's larger absolute pool reflects its much larger population reference. But the US has more eligible profiles relative to both its estimated Instagram audience and its residents.
The US also has a wider range of state-level creator densities, while Europe's eligible supply is more heavily concentrated in its six largest markets.
The regions are surprisingly similar in their overall female share among classified profiles, yet differ sharply in classification coverage and in the gender distribution of the mega tier. Their historical snapshots also tell different stories, although methodological breaks prevent those differences from being interpreted as validated growth trajectories.
The most important conclusion is that regional creator scale and regional creator density answer different questions.
Europe has more eligible profiles. The US has more eligible profiles relative to its audience and population. Neither fact establishes which region will deliver better influencer marketing results.
For brands, the most useful comparison is not Europe versus the US in the abstract. It is the availability of suitable creators in the specific countries, states, follower tiers and audience segments a campaign needs.
Campaign planning takeaway. Use the regional comparison to understand differences in scale, concentration and classification. Build transatlantic campaigns from market-level discovery, validate creator audiences and availability, and measure commercial outcomes rather than inferring them from creator counts.
Instagram's explicit disclosure rate was 12 percentage points higher than TikTok's and 8 percentage points higher than YouTube's.
The study's reported association does not support a simple assumption that transparent sponsorship necessarily weakens engagement. In this sample, clearly disclosed posts were associated with better long-term engagement.
However, the study does not establish that disclosure itself caused the improvement.
Other characteristics, such as creator selection, content quality, campaign structure, audience fit, or brand credibility, may have contributed.
The study reports a 12% improvement in long-term engagement associated with clear disclosure. The precise engagement definition, measurement window, and statistical controls should be checked in the underlying report before using the figure as a benchmark.
It should not be interpreted as a guaranteed 12% uplift for European campaigns.
Disclosure should be treated as a legal and ethical requirement, not an optional engagement experiment. European brands should make commercial relationships clear and ensure that creators use disclosures appropriate to the relevant jurisdiction, platform, and content format.
The useful research question is not whether brands should disclose. It is how to integrate clear, compliant disclosure into content that remains credible, useful, and engaging.
Reading the study. Planning tip: Include disclosure requirements in the creator brief, verify them before publication, and evaluate engagement without treating compliance as a negotiable creative variable.
Figure 73 → Instagram led several reported sentiment and disclosure measures in Influencity's US and Mexico supplements sample. These are category-specific findings, not European benchmarks. Source: [7].
The supplements study reported that 89% of analyzed Instagram posts avoided disease or medical claims. It also identified potentially non-compliant health claims in 15% of the US sample. [7]
These findings matter because influencer content in health-related categories can create legal and reputational risk when product benefits are described inaccurately or without appropriate authorization.
In the European Union, Regulation (EC) No 1924/2006 establishes rules for nutrition and health claims made about foods. The framework generally requires relevant nutrition and health claims to comply with applicable conditions, including the use of authorized health claims where required.
Claims that food products prevent, treat, or cure human disease are generally prohibited under the applicable food-information and claims framework. The exact rules depend on the product, claim, and jurisdiction.
The UK has its own applicable framework following Brexit, including retained and amended rules concerning nutrition and health claims.
The Advertising Standards Authority (ASA) regulates advertising claims under the relevant advertising codes, including influencer advertising. EU and UK requirements share important principles, but brands should not assume that every legal detail or authorized-claim register is identical.
No. The reported 15% figure comes from the supplements study's US sample. It does not estimate the rate of non-compliant health claims in European influencer marketing.
Its value is as a warning that claims-related risk deserves active management, not as a European prevalence estimate.
Reading the study. In regulated categories, creative freedom should operate within a clearly documented claims framework. Compliance belongs in the campaign design, not merely in the final approval stage.
The supplements study reported a substantial difference in average engagement between follower-size groups. Creators with fewer than 100,000 followers recorded a reported average engagement figure of 57%, compared with 24% for creators above one million followers. [7]
These are striking figures. But they require careful interpretation.
Within the supplements sample, the smaller-creator group recorded higher average engagement according to the study's measure. That suggests follower size is worth testing as a factor in campaign performance. It does not establish that smaller creators always outperform larger ones.
The European Instagram dataset shows that nano and micro entries account for approximately 98.7% of reported follower-tier entries. That establishes the scale of smaller-creator supply.
It does not establish how those creators perform. Combining the European distribution with the supplements study should therefore produce a research hypothesis, not a derived European engagement estimate.
Reading the study. The supplements study provides a reason to test smaller creators. Europe's large nano and micro population provides a substantial discovery universe for doing so. Neither dataset proves that smaller creators perform better across Europe.
Figure 74 → Smaller creators recorded higher reported engagement than mega-scale creators in Influencity's US and Mexico supplements study. The comparison is category-specific. Source: [7].
The supplements study reported that routine-based content earned approximately three times the engagement of hard-sell posts. [7]
This finding points toward a creative question that extends beyond follower size. How a product appears within a creator's content may matter as much as the size of the creator's audience.
In this context, routine-based content presents a product as part of an everyday activity or personal practice. It might show how a creator incorporates a product into a morning routine, meal preparation, or another recurring behavior.
Hard-sell content places greater emphasis on direct promotional language and purchase-oriented calls to action.
Within the study's sample, routine-based content was associated with substantially higher engagement. The study does not establish that the creative format alone caused the difference. Creator characteristics, product type, platform, audience expectations, and other factors may have contributed.
European brands frequently need to adapt campaigns across languages, cultural contexts, and product-use conventions. Routine-based creative can provide a framework for local adaptation.
The product remains recognizable, but the surrounding behavior and presentation can reflect the creator's actual context.
Instead of requiring every creator to deliver the same promotional script, brands can define the approved product facts and campaign objective while allowing creators to develop authentic, locally relevant narratives.
For regulated categories, this flexibility must remain within approved claims and disclosure requirements.
Reading the study. Planning tip: Test routine-led creative against more explicitly promotional content using comparable creators and outcomes. Evaluate both engagement and business results rather than assuming that higher engagement automatically means higher sales.
The supplements study found meaningful differences in messaging between the United States and Mexico. According to the study, US content leaned more heavily on science-based framing, while Mexican content emphasized natural products, family, and traditional-remedy narratives. [7]
The study also reported that one-size-fits-all messaging underperformed. These findings illustrate the importance of local context within the studied category. They do not establish fixed national preferences across all consumers or industries.
The European Instagram study covers 30 markets. Those markets differ in language, cultural conventions, consumer expectations, advertising requirements, and product regulation. A campaign developed for one European country cannot automatically be assumed to work equally well in another.
The relevance of the US–Mexico finding lies in the principle it suggests: local creative context deserves to be tested rather than treated as a cosmetic translation exercise.
Translating a caption preserves the words of a campaign. Localization asks whether the underlying message, examples, product uses, tone, and cultural references are appropriate for the intended audience.
A creator who understands a local audience may be better positioned to identify those distinctions. But the benefit must be evaluated in the relevant market.
Reading the study. The US–Mexico supplements findings make a strong case for investigating local message fit. Europe's diversity makes that investigation especially relevant, but not automatically conclusive.
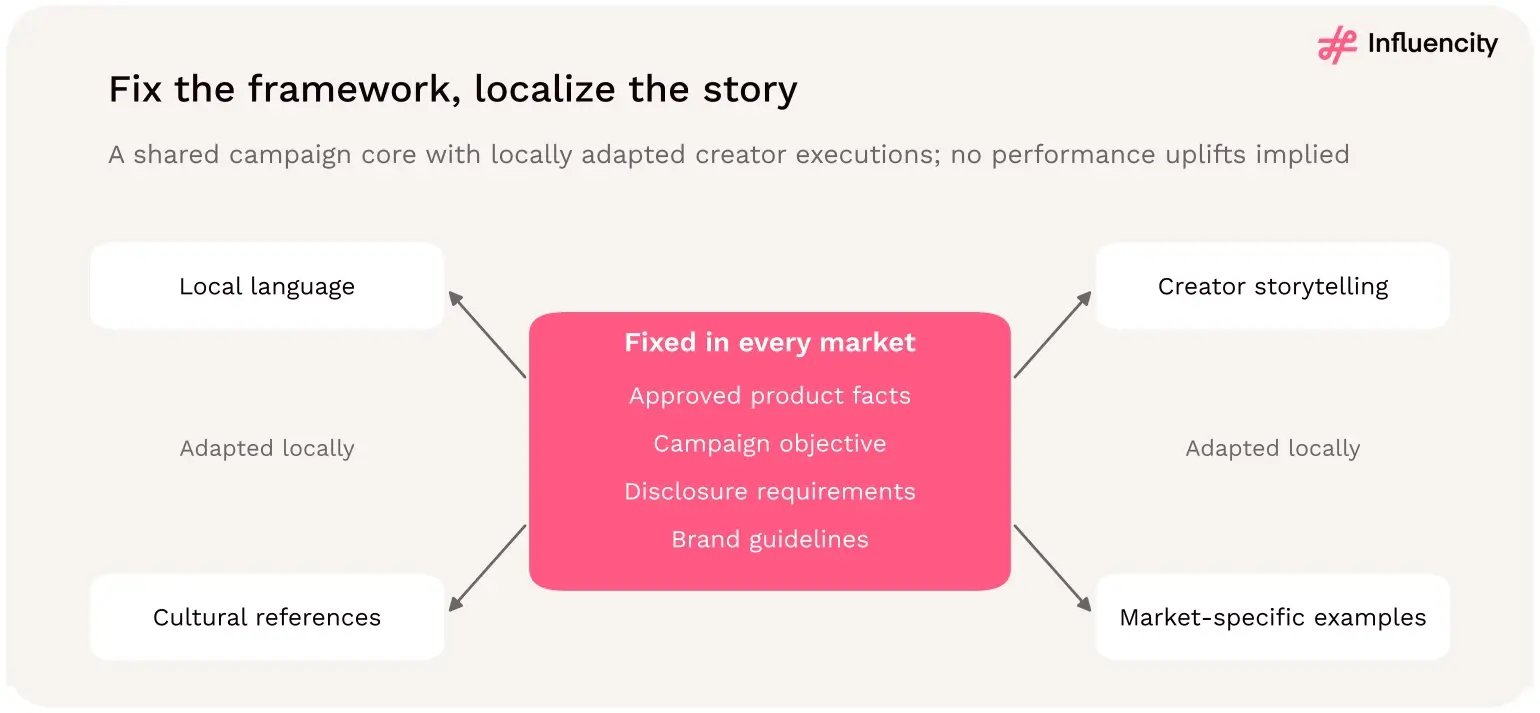
Figure 75 → Category research suggests testing localized creator storytelling while maintaining consistent brand, claims, and disclosure requirements. Source: [7].
Influencity's US food study analyzed 10,568 social mentions, alongside a 20-creator dataset and nine brand case studies. [8] It found that micro-creators accounted for more than half of tagged posts in the analyzed material.
The study also identified the importance of city-level creators for local discovery. Its findings suggested that combining national creators for broader awareness with local creators for visits could be effective in the observed cases.
Within the food study's sample, micro-creators were responsible for a substantial share of tagged content. That is evidence about content participation in the analyzed sample.
It is not evidence that micro-creators account for more than half of all food influencers in the United States. Nor does it establish that they generate more than half of campaign sales or conversions.
Influencity's 2026 niche data adds a European counterpart to the food study. Across Europe's six largest Instagram markets, 2,251,397 creator profiles carry a food tag, the second-largest of the six niches measured, after fashion. Food is the second-largest niche in the UK, Italy, Spain and Germany and the third-largest in France. [12]
Italy has the largest food pool, with 582,680 profiles, narrowly ahead of the UK's 580,915. It also has the most food creators relative to its audience: 19.5 food-tagged profiles per 1,000 estimated Instagram users, compared with 16.4 in the UK and 10.5 across the six markets. [1, 12]
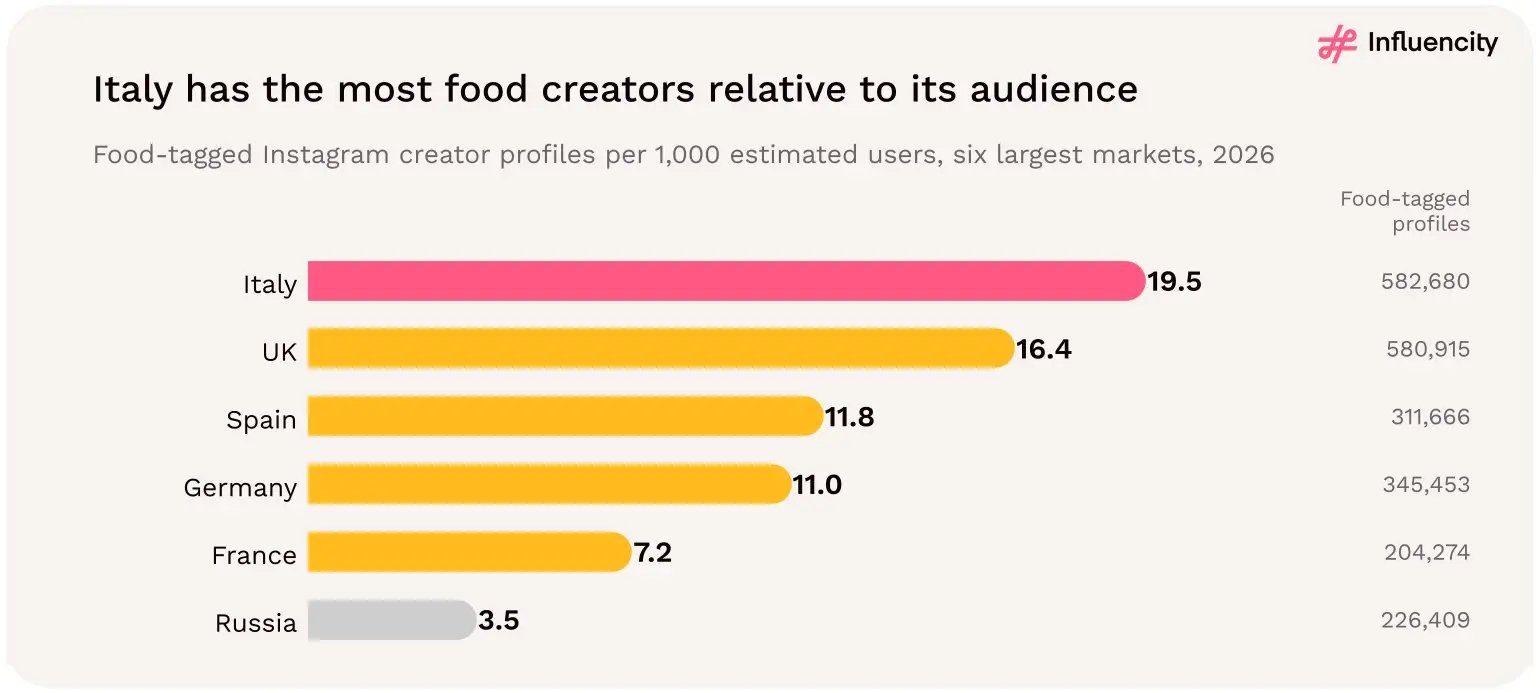
Figure 76 → Food-tagged Instagram creator profiles per 1,000 estimated users in Europe's six largest markets, 2026. Italy has the highest ratio (19.5) and the largest food pool (582,680 profiles), narrowly ahead of the UK. Sources: [1, 12].
Two features connect the niche data to the food study. First, food has the highest unclassified share of any niche in five of the six markets, from 27.3% in Italy to 38.9% in Spain. That is consistent with restaurants, venues and food brands appearing alongside individual creators, although the data does not confirm it. City-level food recruitment will meet these accounts in discovery, so review them individually. Second, 55.9% of classified food profiles are female across the six markets, below the 59.8% baseline, so food rosters are likely to be more gender-balanced than fashion or beauty rosters. [12]
The niche data cannot show where food creators are based within each country, which follower tier they belong to or where their audiences are. It therefore cannot confirm whether micro-creators lead European food content as they did in the US food study's tagged posts. That is the test to run before scaling a national-plus-local structure in Europe.
Reading the study. Planning tip: For a national-plus-local food campaign, size the national layer from the country's food-tagged pool, then filter food creators by city, follower tier and audience location to build the local layer. Italy and the UK offer the largest starting pools; in France and Russia, food takes a smaller share of the niche mix, so allow more time for local discovery.
A food brand launching across several European cities could test a two-level creator structure. National or cross-market creators might support broad awareness. City-level creators could produce locally relevant content around specific retail locations, neighborhoods, or occasions.
The appropriate balance would depend on distribution, audience geography, creator availability, and campaign objectives.
Reading the study. The food study suggests a useful national-plus-local recruitment hypothesis. European brands should test whether that structure improves outcomes in their specific cities and categories.
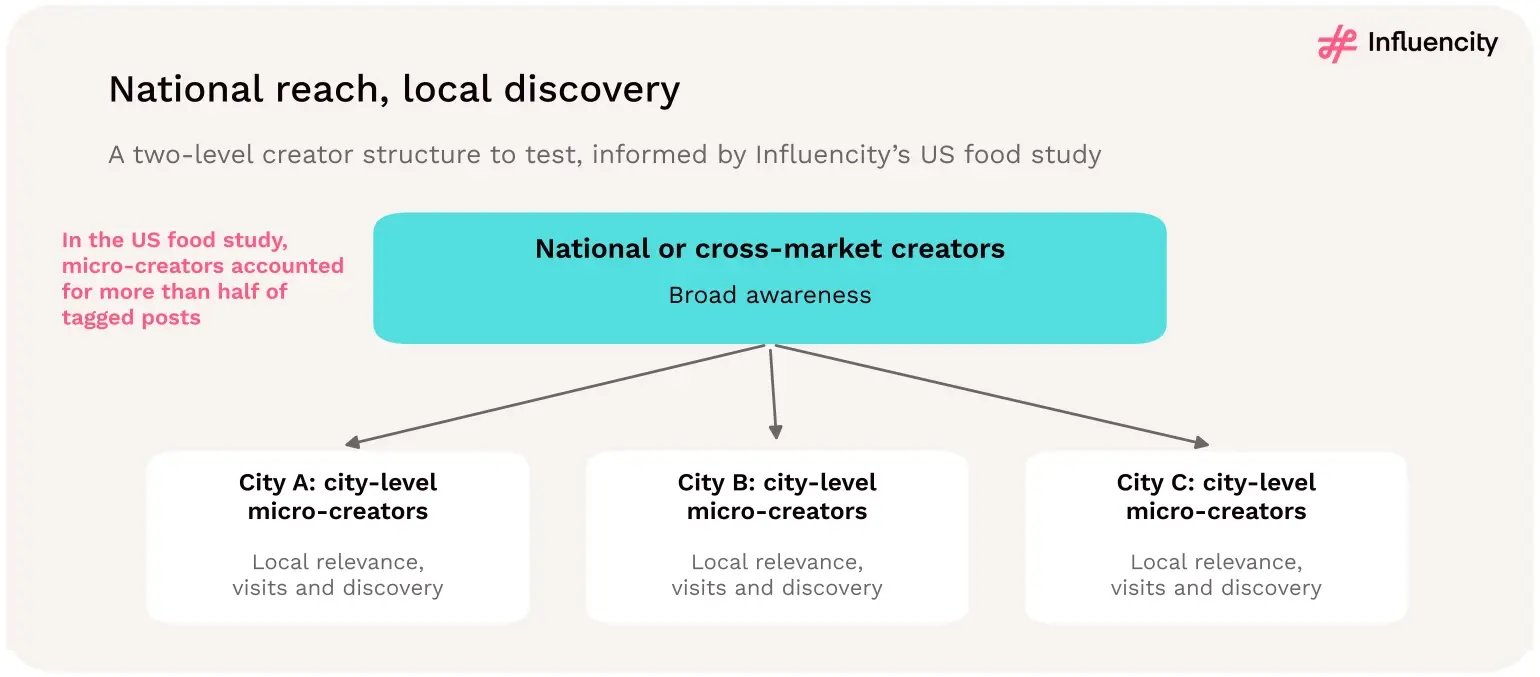
Figure 77 → Influencity's US food study suggests testing a combination of national creators for awareness and city-level creators for local discovery. Source: [8].
The food study reported that people aged 25–34 accounted for 39.11% of analyzed food mentions. [8] This is a useful audience-related finding within the study's social-listening sample. But it requires a precise denominator.
Treat the findings in this study as a reason to investigate age composition in the intended audience. A European food campaign should use current audience data for the relevant country, city, platform, and creator. The US social-listening result should not substitute for local demographic evidence.
Reading the study. Planning tip: Define whether an age statistic describes creators, commenters, mention authors, followers, or customers before using it for targeting.
The studies provide several hypotheses worth testing. They should not be treated as ready-made European benchmarks.
Not every finding is equally relevant to every campaign. A supplements brand may prioritize claims compliance, trust signals, and routine-based creative. A restaurant group may prioritize local audience concentration and city-level creator discovery. A consumer brand entering several European markets may prioritize localization and consistent measurement across countries. The right hypotheses follow the business objective.
Reading the study. Use category evidence to decide what to test, not to decide the result in advance.
Several limitations should remain visible in the report.
The supplements study covers the US and Mexico. The food study covers five US states. Neither provides a representative European sample.
Supplements and food have different purchase contexts, content conventions, regulatory considerations, and audience behaviors. A finding in one category cannot automatically be transferred to another.
The supplements study analyzes sponsored posts and associated measures. The food study uses social mentions, a creator dataset, and brand case studies. Their samples and units of analysis should not be merged.
Sentiment, disclosure, claims compliance, engagement, tagged-post participation, and audience age describe different phenomena. A higher score on one measure does not imply stronger performance on another.
The studies do not specify every denominator, weighting procedure, engagement definition or statistical control in a comparable form. Where those details affect interpretation, the original reports should be consulted before presenting a finding as a benchmark.
Reading the study. The category studies are valuable as bounded evidence. Their usefulness depends on preserving those boundaries.
Its 12.41 million eligible profiles do not provide engagement, sentiment, disclosure, conversion, or ROI benchmarks.
Instagram recorded 68% positive sentiment, 78% explicit disclosure, and a trust-index score of 69 in the study's US and Mexico sample.
The supplements study reported 12% better long-term engagement among clearly disclosed posts, although causality is not established.
The supplements sample reported higher engagement for smaller creators and for routine-based content.
The US–Mexico comparison and the US food cases suggest testing locally relevant messages and creators rather than assuming a single execution will work everywhere.
The category studies generate hypotheses. They do not establish European campaign performance.

Figure 78 → Influencity's category studies provide hypotheses for European influencer marketing tests, not transferable performance benchmarks. Sources: [7, 8].
Influencity's European Instagram study provides a detailed picture of creator supply across 30 markets. It identifies where eligible profiles are concentrated, how follower tiers are distributed, and how market structures differ.
But it does not measure what happens when brands work with those creators. The supplements and food studies begin to address that second question.
In their respective US and Mexico samples, they identify meaningful differences in sentiment, disclosure, engagement, creative format, and local creator participation.
Those findings are useful precisely because they point beyond follower counts. They suggest that campaign effectiveness may depend on how creators communicate, how clearly commercial relationships are disclosed, how carefully product claims are handled, and how well content fits its audience and location.
Yet the evidence has boundaries. The studies concern particular categories, samples, and geographies.
Their figures cannot be imported into the European dataset or used to calculate European engagement, trust, compliance, or conversion rates.
The strongest approach is to connect the studies through questions, not through unsupported numerical conclusions.
Europe's large nano and micro population makes smaller-creator recruitment a substantial opportunity for investigation. Its six largest markets alone hold 2.25 million food-tagged creator profiles. [12] Its national and linguistic diversity makes localization an important variable to test.
And its varied regulatory environments make compliant claims and transparent disclosure essential campaign requirements.
The next step is not to assume that findings from the US and Mexico will repeat in Europe. It is to test the relevant hypotheses with European creators, audiences, and campaign outcomes.
Campaign planning takeaway. Use the European dataset to identify potential creator supply. Use the category studies to develop evidence-informed hypotheses. Then validate those hypotheses through compliant, market-specific campaigns measured against clear commercial objectives.
Fashion is the largest of the six creator niches measured in each of Europe's six largest Instagram markets: Russia, the UK, Italy, Spain, Germany and France. Across the six countries, Influencity's database records 2,976,962 fashion-tagged Instagram creator profiles, ahead of food (2,251,397) and travel (2,084,451). Health & wellness (1,645,854), tech & gaming (1,623,521) and beauty (1,445,503) follow.
The six markets hold 9,514,706 eligible Instagram creator profiles, or 76.7% of the 12.41 million recorded across the 30 European countries in this study. They are the countries where most brands will run discovery first, so they are where niche choices matter most.
Niche counts measure tagged profiles, not unique creators. A creator can carry more than one niche tag (fashion and beauty, or food and travel, for example), so the six niche counts overlap and must not be added together to estimate how many niche creators a country has.
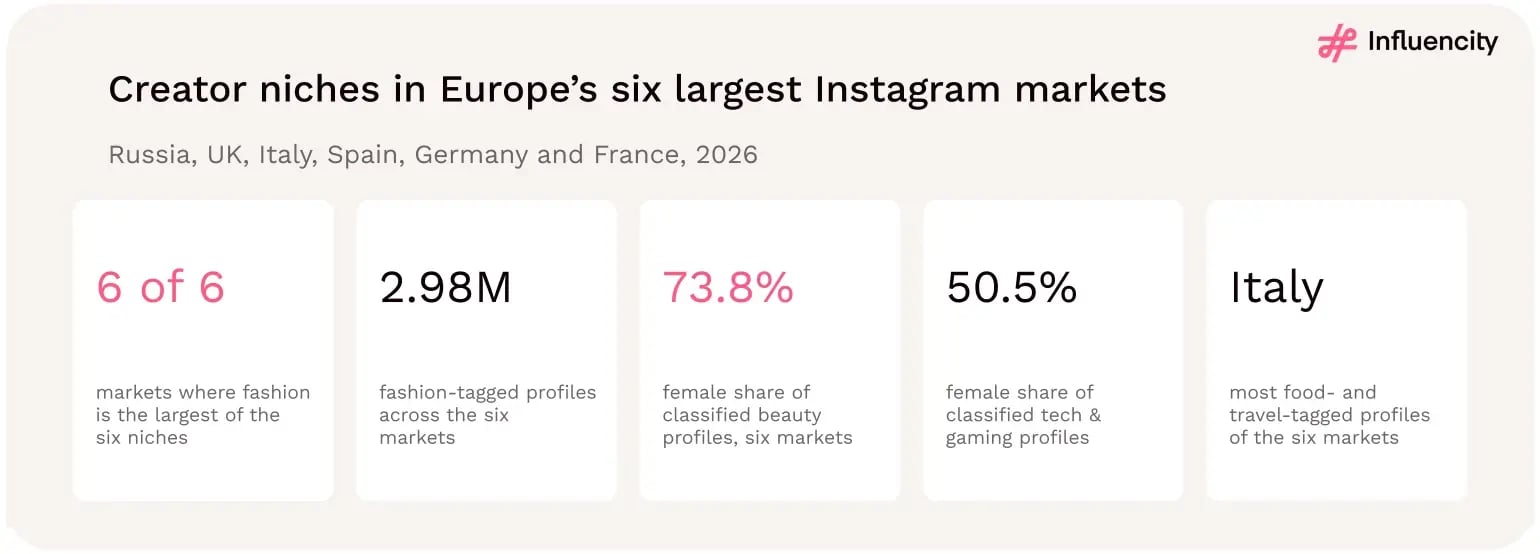
Figure 79 → Creator niches in Europe's six largest Instagram markets at a glance: fashion is the largest niche in all six countries, beauty is the most female-skewed niche and tech & gaming is the closest to gender parity. Niche counts overlap because one profile can carry several niche tags. Source: [12].
Reading the study. Niche is where Europe's large creator markets diverge. Every country's largest niche is fashion, but the second-largest niche, the gender mix inside each niche and the depth of niche tagging all vary by market. A single pan-European niche brief is unlikely to fit every market equally well.
The niche figures come from a 2026 query of Influencity's creator database for six content niches: food, beauty, fashion, travel, tech & gaming and health & wellness (including yoga). Each figure is the number of Instagram creator profiles located in the country that carry the niche tag, split by Influencity's creator gender classification: male, female or unclassified. Eligible profile and audience figures come from the same 2026 dataset used throughout this study.
Dividing the sum of the six niche counts by eligible profiles gives a simple coverage indicator: the average number of these six niche tags per eligible profile. It ranges from 1.76 in Germany to 1.20 in Spain, and falls to 0.61 in Russia.
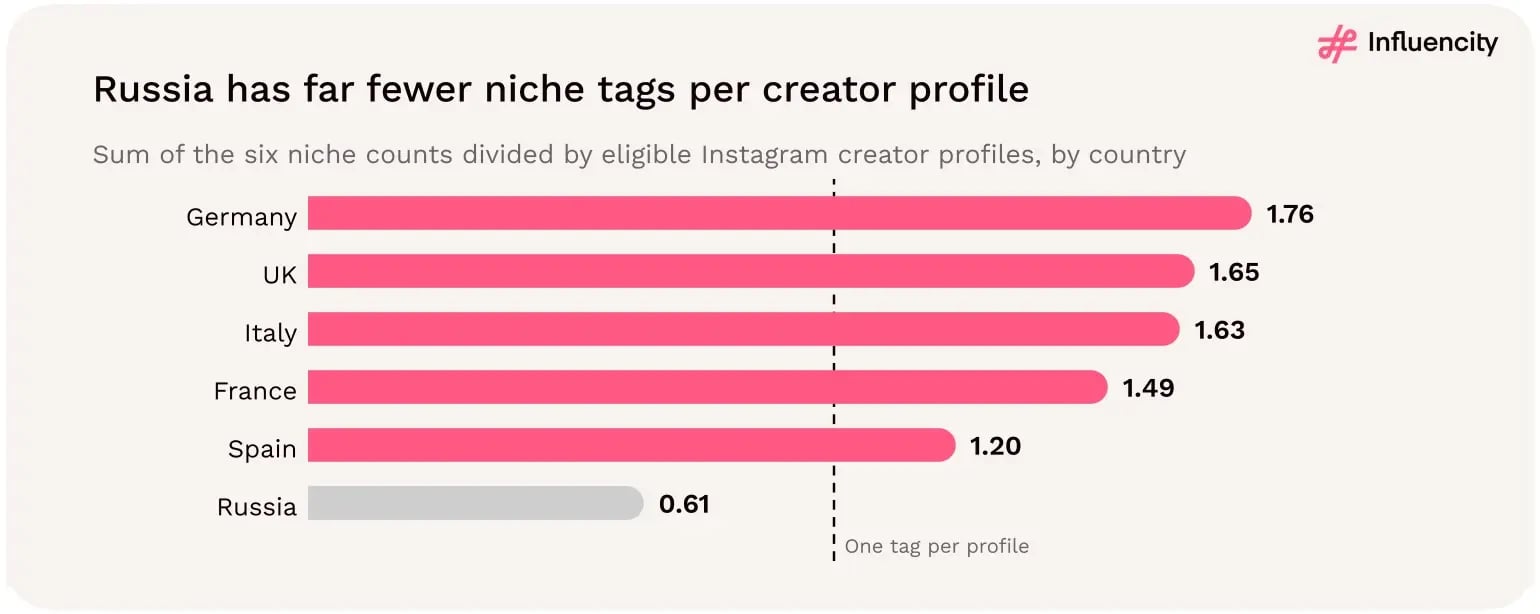
Figure 80 → Average number of the six niche tags per eligible Instagram creator profile, by country, 2026. Germany has the highest value (1.76) and Russia the lowest (0.61). A higher value raises every niche share in that country, so it is a coverage indicator rather than a measure of creator activity. Sources: [1, 12].
A higher value means profiles in that market are more often tagged with one or more of the six niches, which lifts every niche share in that country. For that reason, this section compares markets in three ways: absolute counts, share of eligible profiles and each niche's share of the country's own niche mix.
Fashion is the largest Instagram creator niche in the six markets, with 2,976,962 tagged profiles, 32.2% more than food. Food (2,251,397) and travel (2,084,451) form a second tier. Health & wellness (1,645,854) and tech & gaming (1,623,521) are almost the same size, and beauty (1,445,503) is the smallest of the six.
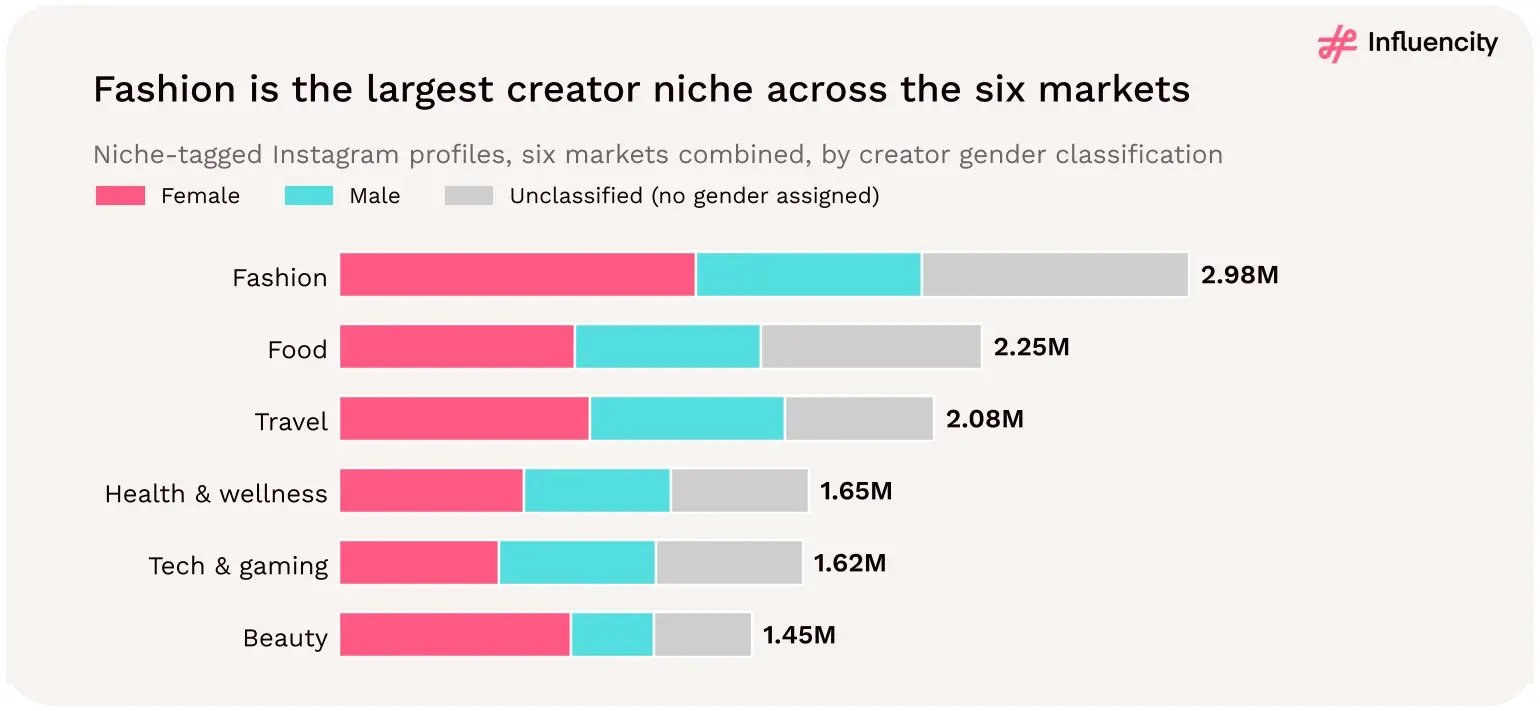
Figure 81 → Niche-tagged Instagram creator profiles across Russia, the UK, Italy, Spain, Germany and France combined, by creator gender classification, 2026. Fashion leads with 2.98 million tagged profiles; beauty is the smallest niche but the most female-skewed. Niche counts overlap. Source: [12].
Reading the study. Beauty is the smallest niche by tagged profiles in the UK, Italy, Spain and Germany, yet it has the most distinctive gender profile of the six. A smaller pool is not a weaker niche; it means discovery filters return fewer profiles, so beauty shortlists need to be built and vetted earlier in the planning cycle.
Fashion ranks first in all six countries, but the order below it changes. Food is second in the UK, Italy, Spain and Germany; travel is second in France and Russia. Beauty ranks last in the UK, Italy, Spain and Germany but third in Russia, while tech & gaming ranks last in France.
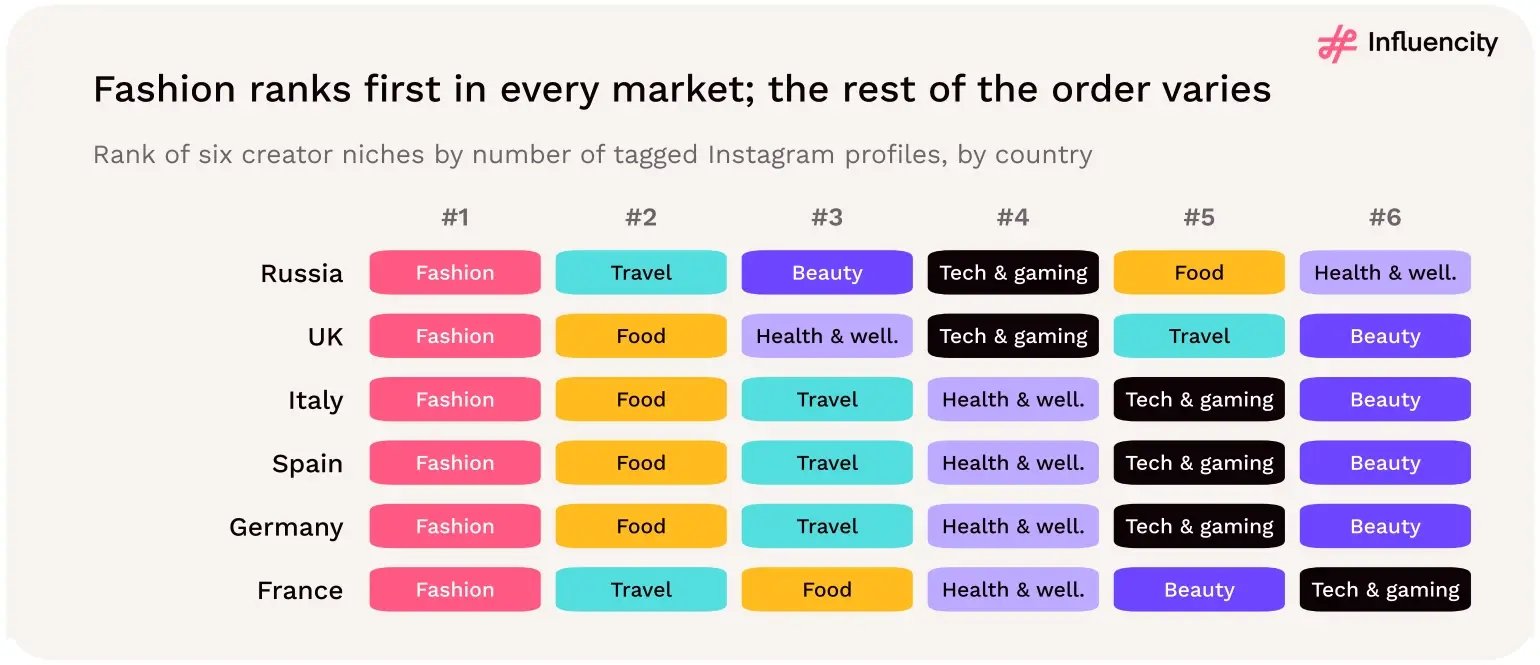
Figure 82 → Rank of six creator niches by number of tagged Instagram profiles in Russia, the UK, Italy, Spain, Germany and France, 2026. Fashion ranks first everywhere; food is second in four markets and travel in two. Source: [12].
The UK has the highest fashion reach, with 45.4% of its eligible profiles tagged for fashion. Germany records the highest shares for food (35.5%), travel (30.2%), health & wellness (27.1%) and tech & gaming (24.3%), and France has the highest beauty share (20.7%). Germany also has the most niche tags per profile, which lifts all of its shares, so these comparisons should be read alongside the coverage indicator above.
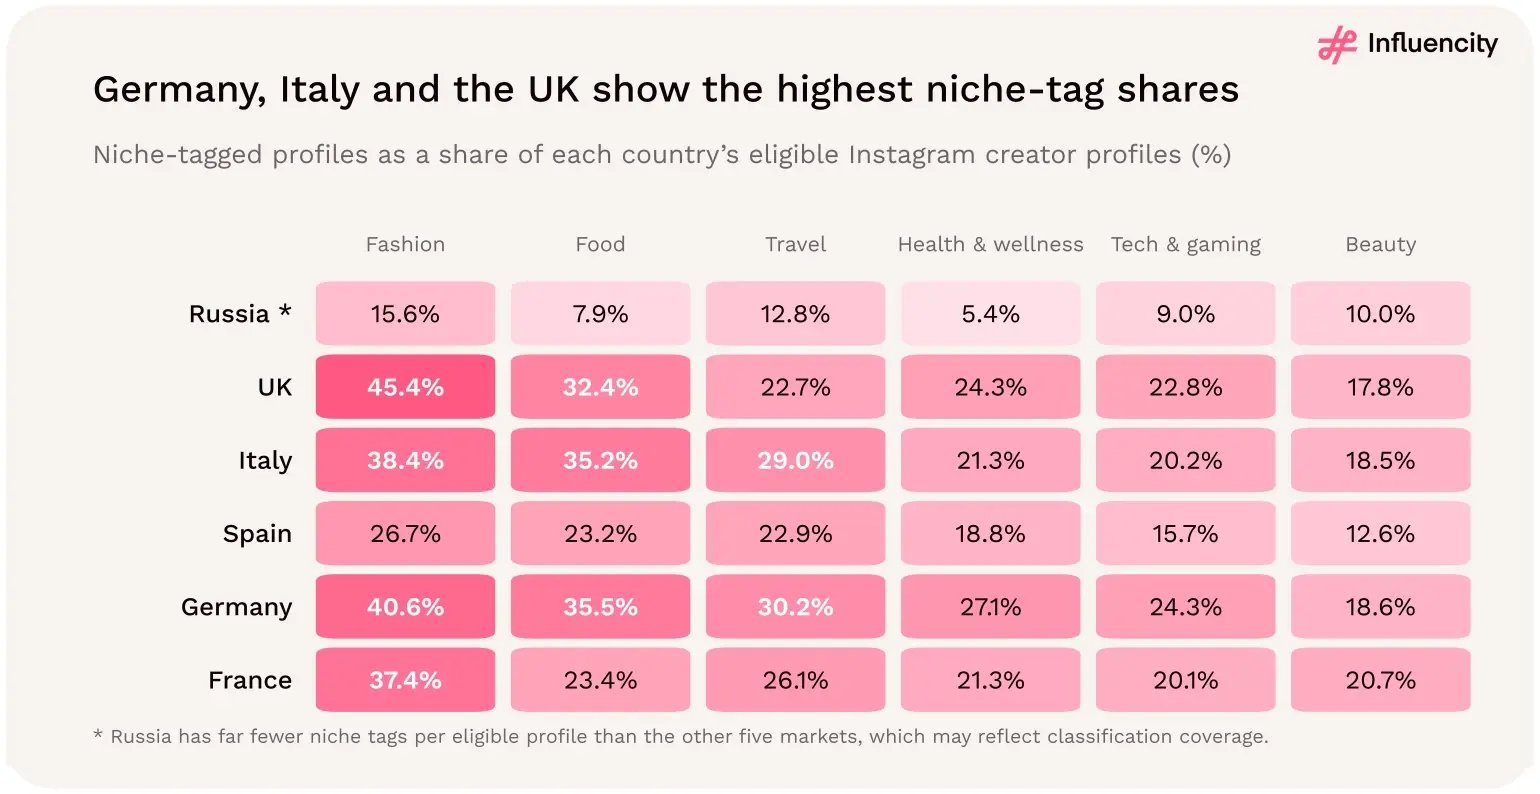
Figure 83 → Niche-tagged Instagram profiles as a share of each country's eligible creator profiles, 2026. The UK's fashion share (45.4%) is the highest in the six markets. Russia's shares are lower across all niches, which may reflect classification coverage. Shares overlap across niches. Sources: [1, 12].
The niche-mix index removes the effect of tagging depth. It compares a niche's share of the country's six niche tags with that niche's share across all six markets. A value above 1.00× means the niche takes a larger share of the country's niche mix than it does across the six markets combined.
More niche creators per 1,000 users means more creators addressing the same audience. That can make discovery easier, but it does not show whether audiences are more engaged or whether creators are more effective. Treat it as a supply measure, not a performance signal.
Beauty is the most female-skewed niche in every one of the six markets, and tech & gaming is the least. Across the six markets, 73.8% of classified beauty profiles are female, compared with 61.4% for fashion, 56.3% for travel, 55.9% for food, 55.8% for health & wellness and 50.5% for tech & gaming. The six-market baseline for all eligible profiles is 59.8%.
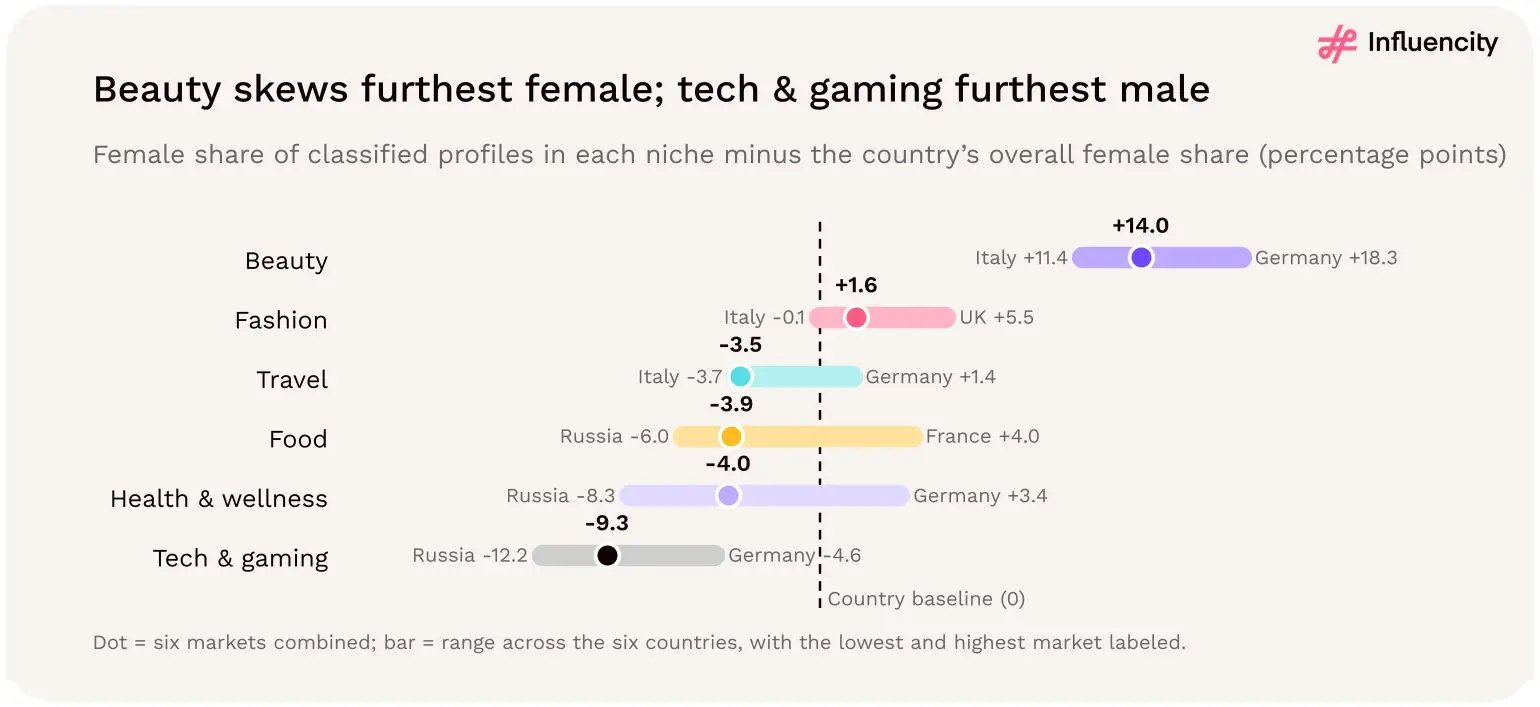
Figure 84 → Female share of classified Instagram creator profiles in each niche minus the country's overall female share, in percentage points, 2026. Beauty sits 14.0 points above the six-market baseline and tech & gaming 9.3 points below it. Bars show the range across the six countries. Sources: [1, 12].
In every market, beauty sits above the country's baseline and tech & gaming sits below it. Russia has the most female-skewed beauty niche (87.7%) and Italy the least (64.7%). Tech & gaming falls below parity in Italy (44.5%), Spain (46.0%) and Germany (48.9%), and France is effectively at parity (49.8%). In the UK (54.7%) and Russia (59.1%), tech & gaming remains female-majority but well below each country's baseline.
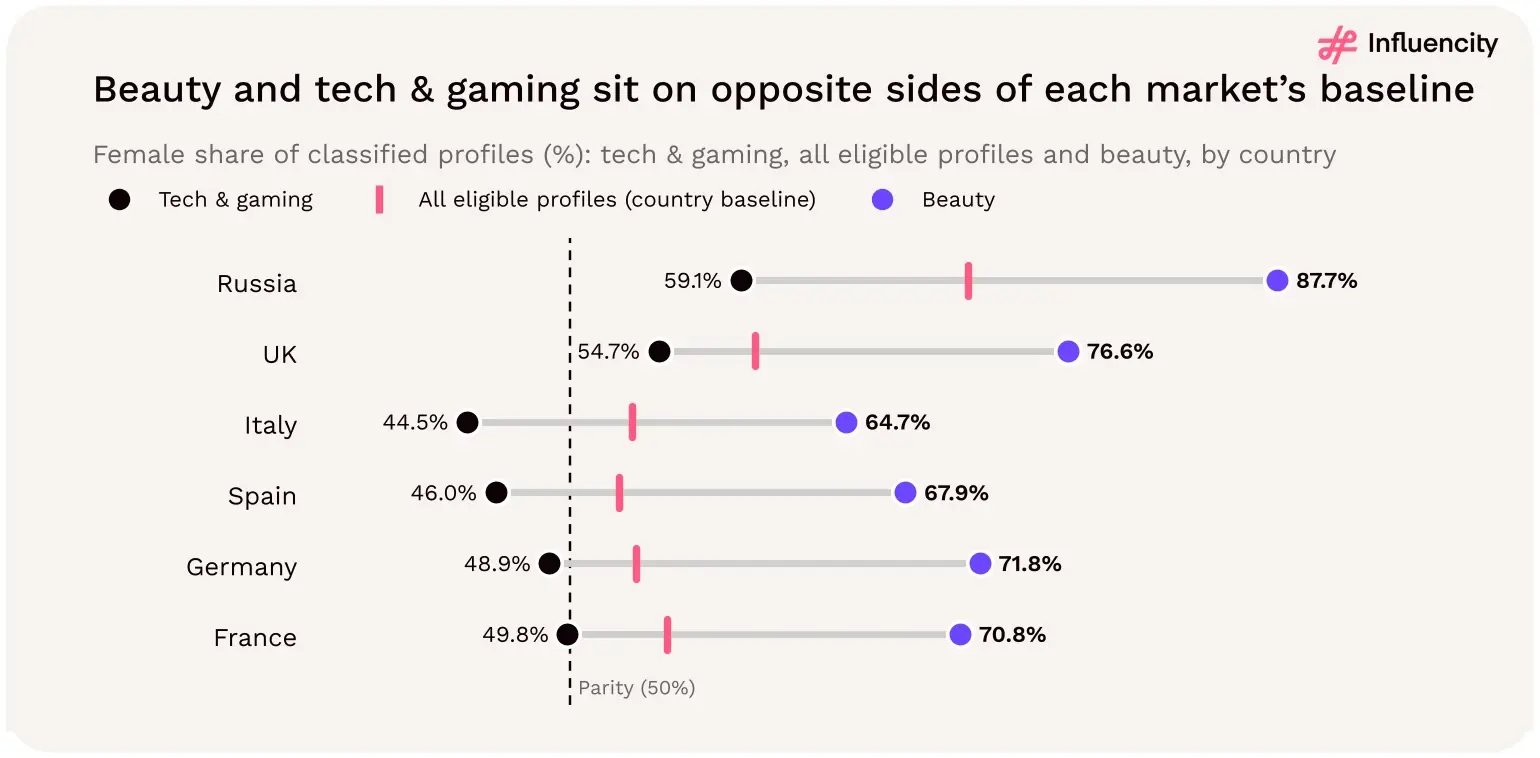
Figure 85 → Female share of classified Instagram creator profiles for tech & gaming, all eligible profiles and beauty, by country, 2026. In every market, beauty is above the country baseline and tech & gaming is below it; tech & gaming is under 50% in Italy, Spain, Germany and, narrowly, France. Sources: [1, 12].
Italy has the most gender-balanced niche mix. Female-classified profiles are a minority in Italy's travel (49.6%), health & wellness (49.8%) and tech & gaming (44.5%) niches, and food is close to parity (50.2%).
Food has the highest unclassified share of any niche in five of the six markets: Spain (38.9%), France (38.4%), the UK (38.3%), Germany (33.8%) and Italy (27.3%). In Russia, the highest unclassified share is in tech & gaming (38.3%).
Reading the study. One possible explanation for food's high unclassified share is that the niche includes more accounts that are not tied to a single identifiable person, such as restaurants, venues, food brands and recipe pages. This is a hypothesis to test during discovery, not a finding from the data. Review unclassified food profiles individually before excluding them from a shortlist.
Reading the study. Gender classification describes the creator profile, not the audience. A female-skewed beauty pool or a male-leaning tech & gaming pool says nothing on its own about who follows those creators. Check audience demographics separately before using creator gender as a targeting proxy.
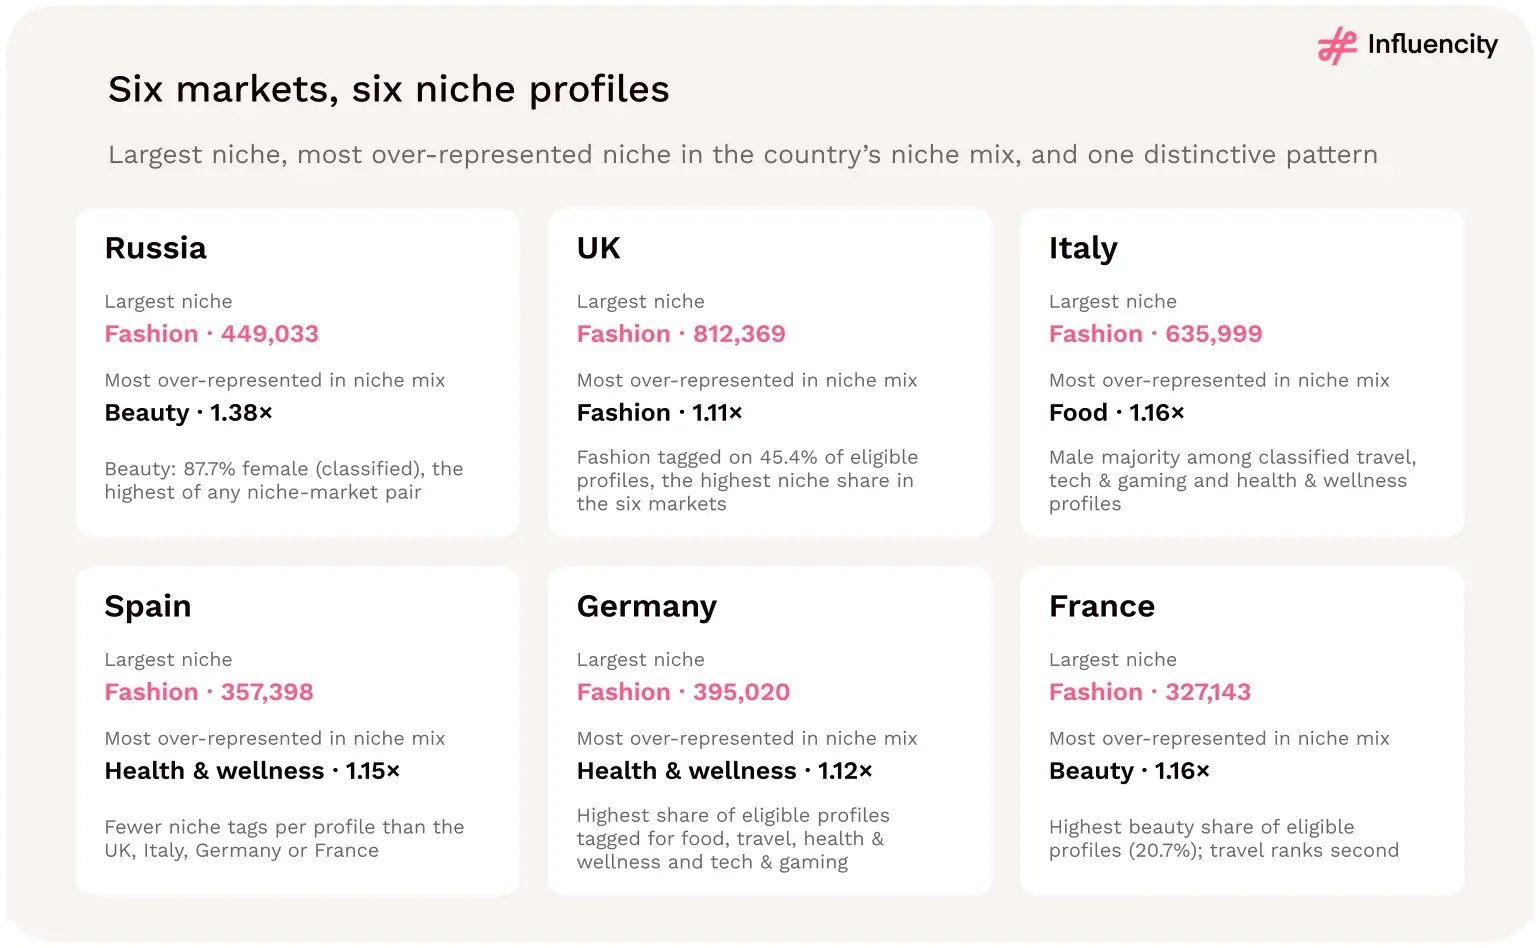
Figure 86 → Niche profile of each of Europe's six largest Instagram markets, 2026: the largest niche, the niche most over-represented in the country's niche mix and one distinctive pattern. The niche-mix index compares a niche's share of the country's six niche tags with its share across all six markets. Source: [12].
Start with the commercial objective and the audience the brand needs to reach. Define country, language and niche requirements, then build an eligible discovery universe. Set shortlist quotas from each market's niche mix rather than from the six-market average, and allow more vetting time in smaller niches such as beauty and tech & gaming. Screen content relevance, recent activity and audience quality before checking commercial availability. Keep the reasons for inclusion and exclusion consistent across countries.
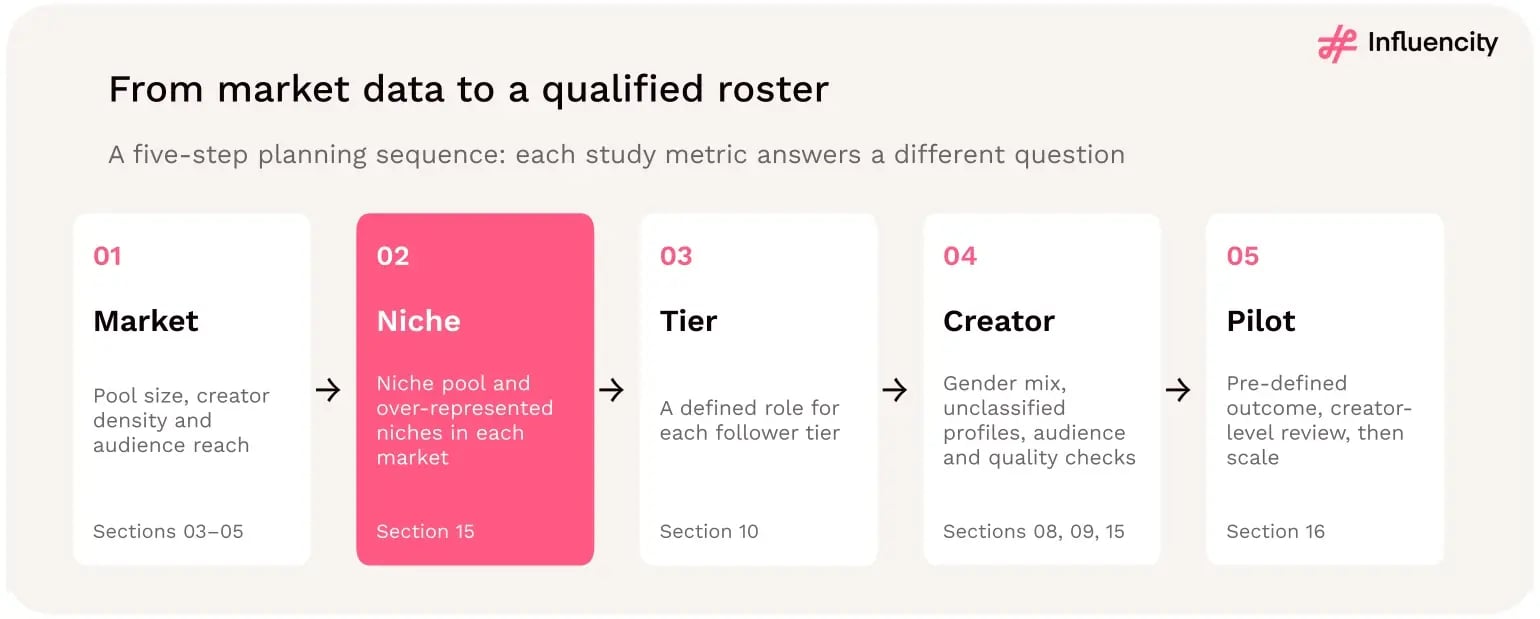
Figure 87 → A five-step planning sequence for European Instagram influencer campaigns: market, niche, tier, creator and pilot. Each step uses a different metric from the study; the sequence describes how to use the data, not measured campaign results. Sources: [1, 12].
Run a pilot with a pre-defined evaluation window. Review results at creator level, not only as campaign totals, and distinguish unpaid delivery, paid amplification and content reuse. Expand the profiles, niches and creative approaches that meet the objective rather than automatically expanding the largest follower tier or the largest niche.
The niche data in section 15 shows that Europe's six largest markets share a leading niche but differ below it. Use the table as a starting point for discovery briefs, not as a ranking of market attractiveness.
The study uses two proprietary Influencity data sources. The main source is the 2026 Instagram analysis dataset (corrected version 3, October 2026). It contains the regional totals and the 30 country records. Creator counts, gender categories and follower-tier counts are recorded as aggregate profile records. [1]
The creator-niche analysis in section 15 uses a separate 2026 query of Influencity's creator database. It counts Instagram creator profiles tagged with six content niches in the six markets with the most eligible profiles, split by creator gender classification. [12] Neither source is a survey of individuals or a random sample of professional creators.
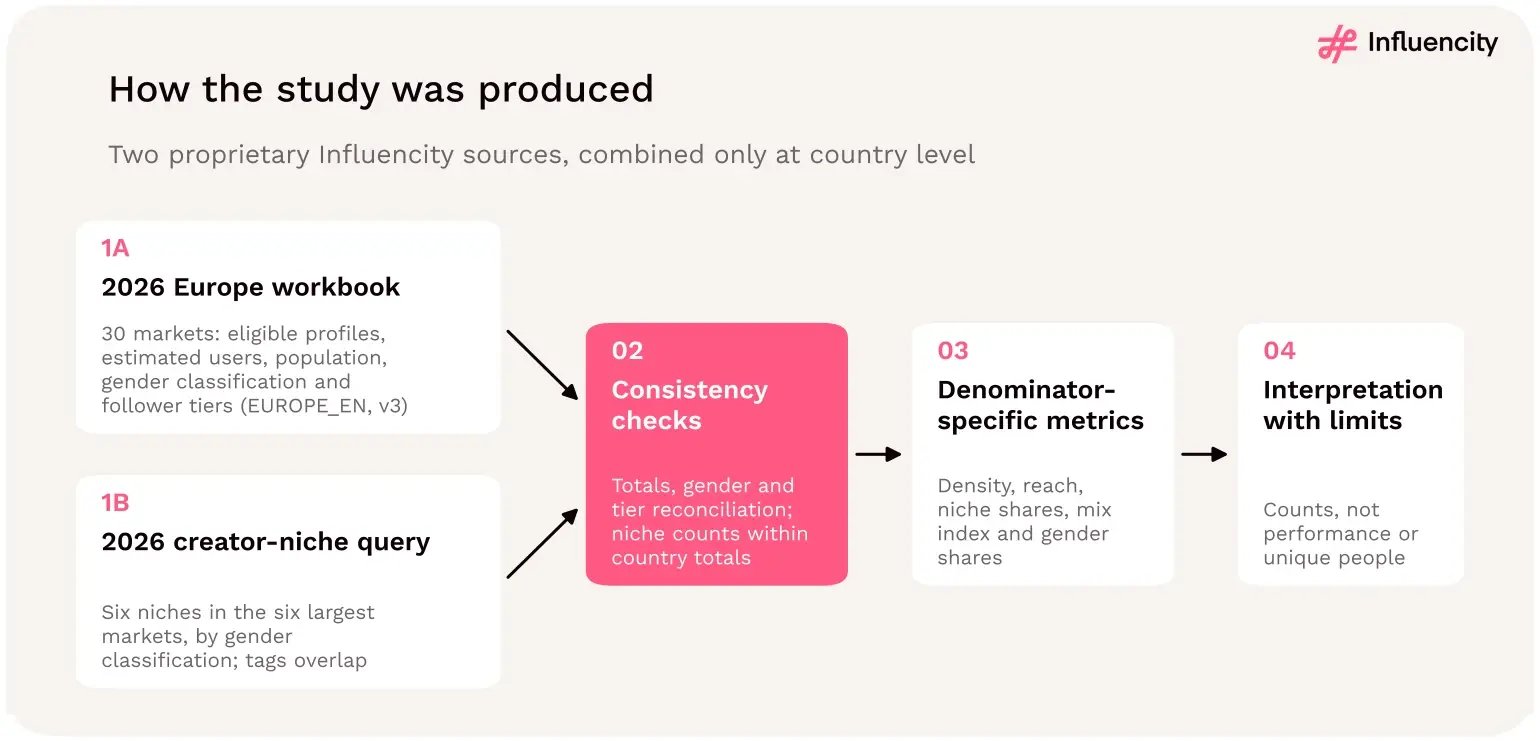
Figure 88 → How source records become the study's country-level and niche-level metrics: two proprietary Influencity sources, consistency checks, denominator-specific metrics and interpretation with limitations. Sources: [1, 12].
Influencity's creator-data fields underpin the recorded eligible-profile counts, their gender and follower-tier classifications and the niche tags used in section 15. Platform-user estimates are Influencity's assignment of Instagram accounts to each market, using the same location signals as creator profiles; they count accounts, not unique residents or verified monthly active users. Population figures are external reference values used only as a denominator. Section 13 uses the companion US study [5] and section 14 two separate category studies [7, 8]; none of those sources is part of the European dataset.

How many Instagram influencers are there in Europe in 2026?
Influencity's 2026 dataset records 12,407,130 influencer-eligible Instagram profiles across 30 European markets, approximately 12.4 million. The figure counts eligible profiles, not unique people, full-time creators or confirmed commercial partners. [1]
How many Instagram users are included in this study?
The dataset contains an estimated 294,504,100 Instagram users across the 30 covered markets. This is the study's audience-estimate field, not an independently verified monthly-active-user figure. [1]
What is the European Instagram creator-to-user ratio?
Eligible profiles divided by estimated Instagram users produces a weighted regional ratio of 4.21%, or about 4.2 eligible profiles per 100 estimated users. It is different from eligible profiles divided by population, which is approximately 1.85%. [1]
Which European country has the most Instagram influencers?
Russia has the largest recorded creator pool, with 2,880,629 eligible profiles. The United Kingdom is second with 1,790,398, followed by Italy with 1,656,396 and Spain with 1,340,770. [1]
Which European country has the highest Instagram creator density?
Cyprus ranks first at 5.57%, narrowly ahead of Italy at 5.54%. Cyprus has the higher ratio, but Italy has a much larger absolute creator pool. [1]
Does Europe have more Instagram influencers than the US?
Yes, in absolute terms: 12.41M eligible profiles across 30 European markets against 8.94M across the 50 US states, 38.7% more. Relative to estimated users the US is higher, at 4.64% against 4.21%, and the US has 26.2 profiles per 1,000 residents against 18.5. [1, 5]
Are most European Instagram influencers women?
Female-classified profiles represent 59.8% of male/female-classified eligible profiles, close to the US figure of 60.2%. Female-classified profiles account for 40.9% of all eligible profiles because another 31.6% have no gender classification. [1, 5]
What percentage of Instagram profiles in Europe are nano-influencers?
Nano entries account for 87.3% of tier entries. This uses the four tier totals (12,391,068), which fall 0.13% short of the eligible-profile count. [1]
How many micro Instagram influencers are there in Europe?
The study records 1,407,525 micro-tier entries, accounting for approximately 11.4% of reported follower-tier entries. [1]
How many macro Instagram influencers are there in Europe?
The study records 154,179 macro-tier entries, representing approximately 1.24% of the follower-tier distribution. [1]
How many mega Instagram influencers are there in Europe?
Across the 30 markets, the study records 8,219 mega-tier entries, representing approximately 0.066% of reported follower-tier entries. [1]
What percentage of European Instagram creators have more than 10,000 followers?
Approximately 12.7% of reported follower-tier entries fall within the micro, macro and mega tiers, corresponding to 1,569,923 entries. The dataset's threshold conventions should be checked before interpreting exact boundary values. [1]
Which European country has the most mega Instagram creators?
The United Kingdom has the largest recorded mega-tier count, with 2,064 entries, representing approximately 25.1% of the regional total. [1]
Are most Instagram influencers in Europe nano or micro influencers?
Yes. Nano and micro entries together account for approximately 98.7% of the reported follower-tier distribution. [1]
Does having more mega creators make a country better for influencer marketing?
Not necessarily. Mega-tier counts measure recorded supply at a follower threshold. Campaign suitability also depends on audience geography, content relevance, creator availability, fees and performance.
Why do the follower-tier totals differ from the headline creator count?
The four tiers total 12,391,068 entries, which is 16,062 fewer than the headline count of 12,407,130 profiles. The source does not establish the cause of the difference, so it should be disclosed rather than explained speculatively. [1]
Do micro-influencers perform better than large creators?
This study does not measure performance. In Influencity's 2025 US and Mexico supplements study, creators under 100k followers averaged a reported 57% engagement rate against 24% above 1M. Test whether that holds in your European markets. [7]
Does TikTok have a higher creator density than Instagram in Europe?
The regional TikTok summary implies about 8.5%, versus 4.21% for Instagram, about 2.01 times. The US datasets show a similar 2.04×. Country coverage, eligibility and dates must be aligned before treating the European figure as like-for-like. [1, 4, 5, 6]
Does this study cover every European country?
No. It covers the 30 countries listed in Appendix A, including Russia, the United Kingdom and Switzerland. Europe in this report is the defined study footprint, not the entire continent or an EU-only grouping. [1]
How concentrated is the European Instagram influencer market?
Three markets (Russia, the UK and Italy) hold 51.0% of the 12.41M eligible Instagram profiles across 30 European markets, and six hold 76.7%. [1]
Which European country has the most established Instagram creators?
Russia has the most profiles with 10,000+ followers (323,869), followed by the UK (235,182). As a share of each market’s pool, France leads at 17.0%. [1]
Which part of Europe has the highest Instagram creator density?
Southern Europe. Italy, Spain, Portugal, Greece, Cyprus and Malta have a combined density of 5.27 eligible profiles per 100 estimated users, against 4.21% across the 30 markets. Every Central and Eastern European market is below the benchmark. [1]
How many Instagram users are there per influencer in Europe?
About 23.7 estimated users per eligible profile across the 30 markets. That ranges from 18.0 in Cyprus to 37.2 in Luxembourg. [1]
Which large European country has the highest Instagram creator density?
Italy has the highest creator density among the six largest markets, at 5.54%. Across all 30 countries, Cyprus ranks first at 5.57%, narrowly ahead of Italy. [1]
Does Italy have more Instagram influencers than Germany?
Yes. Italy has 1,656,396 eligible profiles, compared with Germany's 972,862—approximately 1.70 times as many. However, most of Italy's relative density advantage comes from nano profiles, and the difference narrows considerably among creators with 10,000+ followers. [1]
Which European country has the highest proportion of established Instagram influencers?
France has the highest share of eligible profiles with 10,000 or more followers, at 17.0%. Germany follows among the ten largest markets at 15.6%. These percentages describe follower-tier composition, not verified professional experience. [1]
Which country has the most established Instagram creators relative to users?
The United Kingdom leads the 30-market study with 6.62 profiles above 10,000 followers per 1,000 estimated Instagram users. Spain follows at 6.53. [1]
Is Spain a strong market for Instagram influencer discovery?
Spain combines 1.34 million eligible creator profiles, 55.2% estimated audience penetration and 5.08% creator density. It also has one of the highest concentrations of established creators per estimated user. These figures support substantial discovery potential, but campaign suitability depends on creator-level evidence. [1]
Does higher creator density mean better influencer marketing performance?
No. Creator density measures eligible profiles relative to estimated Instagram users. It does not measure engagement, creator fees, audience authenticity, conversions or return on investment.
Can brands use Russia's recorded Instagram influencers for paid campaigns?
The dataset cannot establish that. Instagram access and advertising activity in Russia are subject to significant restrictions, and any proposed activation requires current, jurisdiction-specific legal and commercial review. Recorded profiles should not be treated as confirmed campaign-ready inventory. [9–11]
How many Instagram influencer profiles are recorded in Europe without Russia?
Excluding Russia, the remaining 29 markets contain 9,526,501 eligible Instagram creator profiles, compared with 12,407,130 across all 30 markets. [1]
Does excluding Russia change Europe's influencer density?
Only slightly. The aggregate creator density changes from 4.21% across all 30 markets to 4.13% across the 29 markets excluding Russia. [1]
Why does excluding Russia change Europe's reported female creator share?
Russia has a large eligible creator pool (2,880,629 profiles) and a classified female share of 71.2%, well above the regional average. Excluding it reduces the female share among male/female-classified profiles from 59.8% to 56.6%. [1]
How many Instagram influencers are recorded in Cyprus and Malta?
The study records 42,317 eligible profiles in Cyprus and 14,450 in Malta. These are eligible Instagram profiles, not verified counts of unique professional influencers. [1]
Which has more Instagram influencers: Portugal, Greece or the Netherlands?
The Netherlands has the largest recorded eligible pool, with 336,304 profiles. Portugal follows with 302,624, then Greece with 239,580. Greece, however, has the highest creator density of the three. [1]
Which European country has the highest estimated Instagram audience penetration?
Portugal leads the 30-market dataset with an estimated Instagram audience-to-population ratio of 61.1%. This is an estimated account-audience measure, not verified unique-person penetration. [1]
Are smaller European markets suitable for influencer marketing?
They can be, depending on the campaign's audience, creator requirements and commercial objectives. National creator counts and density provide discovery context, but suitability requires evidence about individual creators, audience geography, availability and costs.
Are there more female or male Instagram creators in Europe?
There are more female-classified than male-classified profiles in the study's classified subset: 5,080,611 female-classified profiles versus 3,410,336 male-classified profiles. Another 3,916,183 profiles are unclassified. [1]
Is the Instagram influencer gender distribution similar in Europe and the US?
The classified-only distributions are similar: 59.8% female in Europe and 60.2% in the US. However, Europe has a higher unclassified share, at 31.6% compared with 21.5% in the US. [1, 5]
Which European countries have the highest female-classified Instagram creator shares?
Among the country examples highlighted in the study, Russia records 71.2%, Lithuania 70.2%, Poland 69.8%, and Romania 69.1% female shares within their classified subsets. [1]
Which European countries are closest to gender parity among Instagram creators?
Switzerland and Greece are near parity within their female/male-classified subsets, with female shares of 50.04% and 50.11%, respectively. Switzerland has just 78 more female-classified profiles than male-classified profiles; Greece has 380 more. [1]
Why are so many Instagram creator profiles unclassified?
The dataset records 31.6% of eligible European profiles without a gender classification. The classification counts do not establish the reasons individual profiles remain unclassified, so the category should not be assigned an assumed demographic composition.
Does an Instagram creator's gender determine their audience demographics?
No. Creator gender classification and follower demographics are different variables. Brands should use audience-level data to evaluate whether a creator reaches their intended consumers.
Can gender classification be used to predict influencer campaign performance?
No. The study does not establish a relationship between creator gender classification and engagement, conversion rates, pricing, purchasing power, or return on investment.
Are most European Instagram mega influencers male?
Among European Instagram mega-tier entries classified as female or male, 55.5% are male-classified and 44.5% are female-classified. A further 1,856 mega-tier entries have no gender classification. [1]
Why are there more male-classified creators at the mega tier?
The study does not establish the cause. It records a male majority among classified mega-tier entries but does not measure the mechanisms that produced that distribution.
Which large European countries have male-majority Instagram mega tiers?
France, Spain, Italy, Germany, and the United Kingdom have male majorities among classified mega-tier entries. Their male shares range from 57.0% in the UK to 63.8% in France. [1]
Does Russia have more female than male Instagram mega creators?
Yes, among classified mega-tier entries. Russia records 738 female-classified entries and 499 male-classified entries, producing a female share of approximately 59.7%. [1]
How many European countries have male-majority mega tiers?
Nineteen of the 30 markets have more male-classified than female-classified mega-tier entries. Nine have more female-classified entries, and two are tied. [1]
Is the US Instagram mega tier male-majority?
No. The US Instagram classified mega tier is effectively balanced, with a 50.1% female share and a 49.9% male share. [5]
Is the US TikTok mega tier male-majority?
Yes. In the US TikTok comparison dataset, male-classified entries represent 52.4% of the classified mega tier. [6]
Can these figures predict campaign performance or market growth?
No single count or ratio predicts returns. The data supports discovery planning and descriptive comparisons, not claims about fees, sales, incremental return or the causes of changes between years. Scenarios in Appendix E are conditional calculations, not predictions.
Does TikTok have more influencers than Instagram in Europe?
The regional figures report approximately 21.4 million eligible TikTok profiles, compared with 12.41 million eligible Instagram profiles. However, the datasets have not been validated as fully comparable, and eligible profiles are not necessarily unique professional influencers. [1, 4]
Does Instagram have more users than TikTok in Europe?
The estimates indicate approximately 294.5 million Instagram users and 252.3 million TikTok users. These are estimated platform audiences, not verified deduplicated counts of unique residents. [1, 4]
Why does TikTok have higher calculated creator density?
The TikTok summary reports more eligible creator profiles and fewer estimated users than the Instagram dataset. Both contribute to the higher calculated ratio.
Does higher creator density mean TikTok is better for influencer marketing?
No. Creator density does not measure audience quality, engagement, creator availability, campaign costs, conversions or ROI.
Are there 33.8 million Instagram and TikTok influencers combined in Europe?
The two reported eligible profile counts sum to approximately 33.8 million platform-specific records, but they cannot be interpreted as 33.8 million distinct creators because the same individuals or entities may operate accounts on both platforms.
Is the TikTok-to-Instagram density ratio similar in the US?
Yes. The reconciled US comparison reports a ratio of approximately 2.04, close to the provisional European ratio of 2.01. This similarity does not establish that the European datasets are methodologically equivalent. [6]
Does Instagram perform better than TikTok for influencer campaigns?
The European creator-density comparison does not answer that question. A separate US and Mexico supplements study found higher positive sentiment and explicit disclosure on Instagram, but those findings are category-specific and cannot be generalized to European campaign performance. [7]
Which platform should European brands prioritize?
Brands should prioritize the platform that offers the strongest combination of relevant audiences, suitable creators, creative fit and commercial feasibility for the campaign. Regional creator density alone is not sufficient.
What data would make the comparison more reliable?
A matched European TikTok dataset covering the same countries, observation period, eligibility definitions and audience-estimation methods as the Instagram study would support a stronger comparison.
How many Instagram influencers were reported in Europe in 2020?
Influencity's 2020 European study reported approximately 8.6 million influencers and 213 million Instagram users. The creator count was rounded. [2]
How many European Instagram influencers were reported in 2022?
The study published in 2023, using 2022 observations, reported 10,526,558 influencers and approximately 252.1 million Instagram users. [3]
How many European Instagram creator profiles are reported in 2026?
Influencity's 2026 study reports 12,407,130 eligible Instagram profiles across 30 European markets and approximately 294.5 million estimated Instagram users. [1]
Has the number of Instagram influencers in Europe increased since 2020?
The reported count is higher in successive study editions. The 2026 total is approximately 44.3% above the rounded 2020 figure. However, methodological differences prevent this from being interpreted as a verified 44.3% increase in the underlying creator population.
How much higher is the 2026 creator count than the 2022 count?
The 2026 study reports 1,880,572 more eligible profiles, a difference of approximately 17.9% between the published counts. [1, 3]
Has European Instagram influencer density increased since 2020?
The recalculated density is approximately 4.04% in 2020, 4.18% in 2022 and 4.21% in 2026. The differences are small, but the historical figures are not fully harmonized. [1–3]
Does stable creator density mean the influencer industry has stopped growing?
No. Creator density is a ratio of eligible profiles to estimated users. It does not directly measure creator earnings, brand spending, professional participation, content production or industry growth.
Why can't the historical studies be compared directly?
They were produced as separate snapshots with definitions and data conditions that have not been fully harmonized. The 2023 edition specified public profiles belonging to people over 18 with more than 1,000 followers, while the 2020 edition used five follower bands. [2, 3]
Can the historical figures show how many creators entered or left Instagram?
No. The editions do not track the same accounts over time, so they cannot establish creator entry, exit, retention or movement between follower tiers.
Does the European historical pattern match the United States?
Not exactly. Section 13 examines differences in the reported US series. However, a validated comparison of regional growth would require harmonized historical methods.
Is Instagram creator density higher in Europe or the US?
Creator density is higher in the United States, at 4.64%, compared with 4.21% in Europe. [1, 5]
Why does Europe have more creators but lower density?
Europe's study population is approximately 1.96 times the US population, while its eligible creator pool is only about 1.39 times as large. Europe also has a lower estimated Instagram audience-to-population ratio.
How many Instagram creators are there per 1,000 residents in Europe and the US?
Europe records approximately 18.5 eligible profiles per 1,000 residents, compared with 26.2 in the United States. [1, 5]
Which region has more geographically concentrated creator supply?
Europe. Its six largest creator markets account for 76.7% of the eligible pool, compared with 57.9% across the six largest US states. However, the geographic units differ.
Does creator density vary more across US states or European countries?
It varies more across US states. The US range is 1.58%–9.80%, while the European range is 2.69%–5.57%. [1, 5]
Has Europe's Instagram influencer market grown faster than the US market?
The published historical counts differ, with Europe's 2026 count higher than its 2022 observation and the US count lower. However, the historical datasets are not fully harmonized, so the study does not establish comparable industry growth rates.
Which region is better for influencer marketing?
The data does not establish a universally better region. Europe has greater absolute eligible supply, while the US has higher relative creator concentration. Campaign performance depends on qualified creators, relevant audiences, costs and objectives.
Does the European Instagram study measure influencer engagement?
No. The 2026 European dataset records eligible creator profiles and related structural measures. It does not provide engagement-rate benchmarks or campaign performance outcomes. [1]
Which platform had the highest positive sentiment in Influencity's supplements study?
Instagram recorded 68% positive sentiment, compared with 58% on TikTok and 51% on YouTube in the US and Mexico supplements sample. [7]
Did Instagram have better advertising disclosure in the supplements study?
Instagram had the highest reported explicit disclosure rate in the sample, at 78%, compared with 66% on TikTok and 70% on YouTube. [7]
Does sponsorship disclosure reduce influencer engagement?
The supplements study reported 12% better long-term engagement among clearly disclosed posts. However, the study does not establish that disclosure caused the difference or that the result applies across Europe. [7]
Does routine-based influencer content outperform hard-sell content?
In the supplements study, routine-based content recorded approximately three times the engagement of hard-sell posts. European brands should test whether the pattern holds in their category and market. [7]
What are the risks of health claims in European influencer advertising?
Nutrition and health claims are regulated, and unauthorized or prohibited claims can create compliance risk. Brands should provide approved wording and review creator content under the rules applicable to the product and market.
Why are local influencers important for food marketing?
The US food study found that city-level micro-creators played a role in local discovery and suggested combining broader awareness creators with local creators for visits. European campaigns should validate local audience reach and commercial outcomes. [8]
What percentage of food mentions came from people aged 25–34?
The food study reported 39.11% of analyzed mentions associated with the 25–34 age group. This does not represent the age distribution of European food consumers or Instagram users. [8]
Can US and Mexico influencer marketing findings be applied directly to Europe?
No. They can inform hypotheses, but European performance requires evidence from the relevant countries, categories, creators, and audiences.
What are the most popular Instagram influencer niches in Europe?
Fashion is the largest Instagram creator niche in Europe's six largest markets, with 2,976,962 fashion-tagged profiles across Russia, the UK, Italy, Spain, Germany and France in 2026. Food (2,251,397) and travel (2,084,451) follow, according to Influencity's database. Profiles can carry several niche tags, so the counts overlap. [12]
Which European country has the most fashion influencers on Instagram?
The UK has the most fashion-tagged Instagram creator profiles of Europe's six largest markets: 812,369 in 2026, or 45.4% of its eligible creator profiles. Italy is second with 635,999. [12]
Which European country has the most food influencers on Instagram?
Italy records the most food-tagged Instagram creator profiles of Europe's six largest markets, with 582,680 in 2026, narrowly ahead of the UK (580,915). Italy also has the most food-tagged profiles relative to its audience: 19.5 per 1,000 estimated Instagram users. [1, 12]
Are beauty influencers in Europe mostly women?
Yes. Across Europe's six largest Instagram markets, 73.8% of classified beauty creator profiles are female, 14.0 percentage points above the 59.8% baseline for all classified profiles in those markets. The share ranges from 64.7% in Italy to 87.7% in Russia. [12]
Are tech and gaming influencers in Europe mostly men?
Not across the six largest markets combined: 50.5% of classified tech & gaming profiles are female. Male-classified profiles are the majority in Italy (55.5%), Spain (54.0%), Germany (51.1%) and, narrowly, France (50.2%); the UK and Russia remain female-majority. [12]
Can Instagram influencer niche counts be added together?
No. One creator profile can carry several niche tags, so adding the niche counts double-counts creators. In five of Europe's six largest markets, the six niche counts sum to more than the country's eligible creator profiles.
Why are Russia's Instagram niche figures lower than other countries'?
Russia averages 0.61 niche tags per eligible creator profile, compared with 1.20 to 1.76 in the UK, Italy, Spain, Germany and France. This may reflect how consistently niche tags are assigned in that market rather than less niche content, so Russia's niche shares are not directly comparable. [12]
How were the Instagram creator niche figures in this study produced?
The niche figures come from a 2026 query of Influencity's creator database. It counts Instagram creator profiles tagged with six niches (food, beauty, fashion, travel, tech & gaming and health & wellness) in Russia, the UK, Italy, Spain, Germany and France, split by creator gender classification. One profile can carry several niche tags, so the counts overlap.
Should brands choose an influencer market based on niche counts alone?
No. Niche counts show how many creator profiles carry a niche tag, not how those creators perform. Influencity's 2026 Europe study recommends using niche data to set discovery targets in each market, then validating shortlists with audience location, content quality and a pilot with a pre-defined outcome.
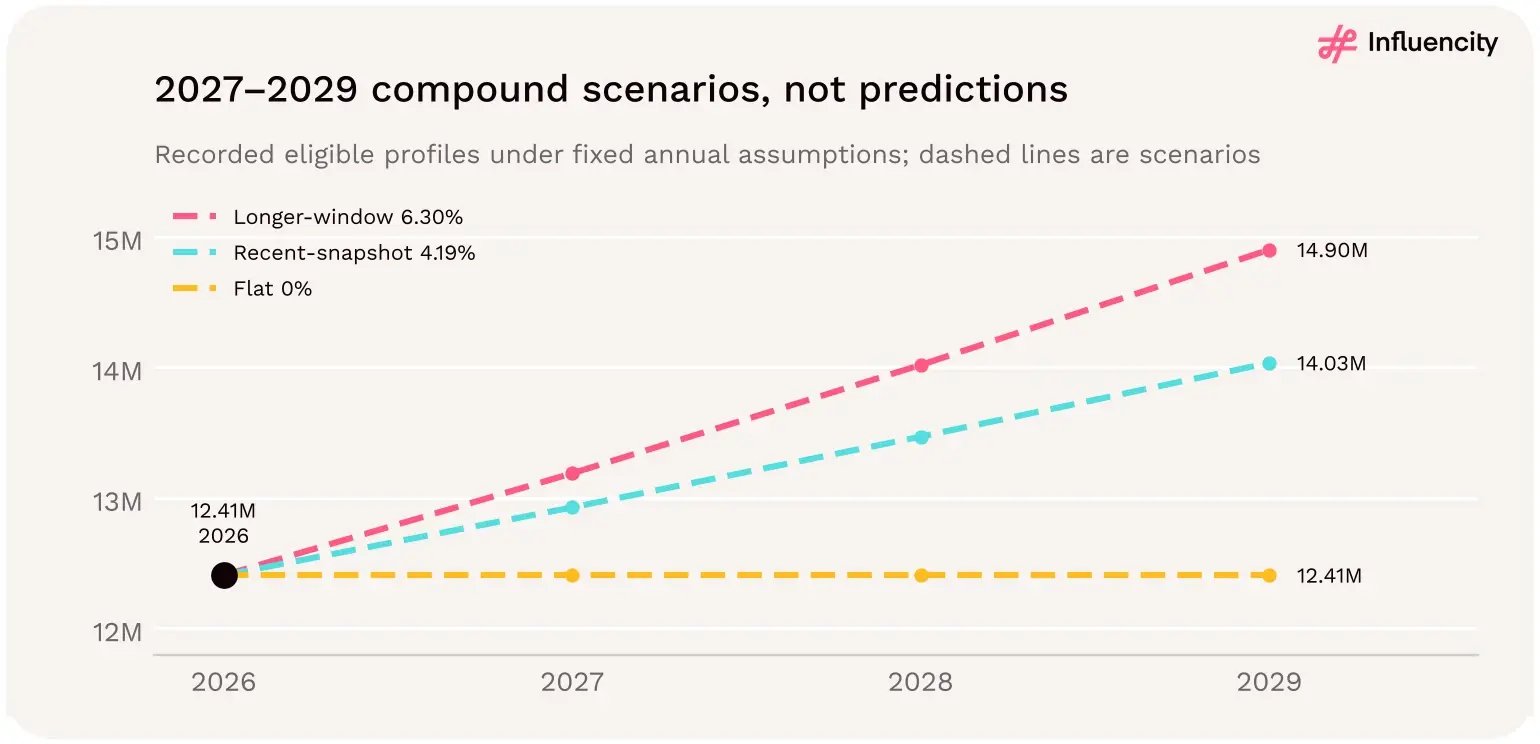
Figure 89 → Mechanical compound-rate scenarios for the study's recorded eligible-profile count. Sources and calculations: [1–3].
Constant rates assume stable country scope and eligibility; they do not model platform changes, saturation, removals or database-coverage changes. Note that applying the same method to the US series would produce a negative recent rate (−3.23% a year), a reminder of how sensitive these mechanical rates are to non-harmonized snapshots. [5]