Creator supply, audience estimates, density, gender patterns, creator niches and country-level opportunities across 30 European markets, with a US comparison.
21.40M
influencer-eligible profiles
252.3M
estimated TikTok users
8.48%
creator density
30
European markets
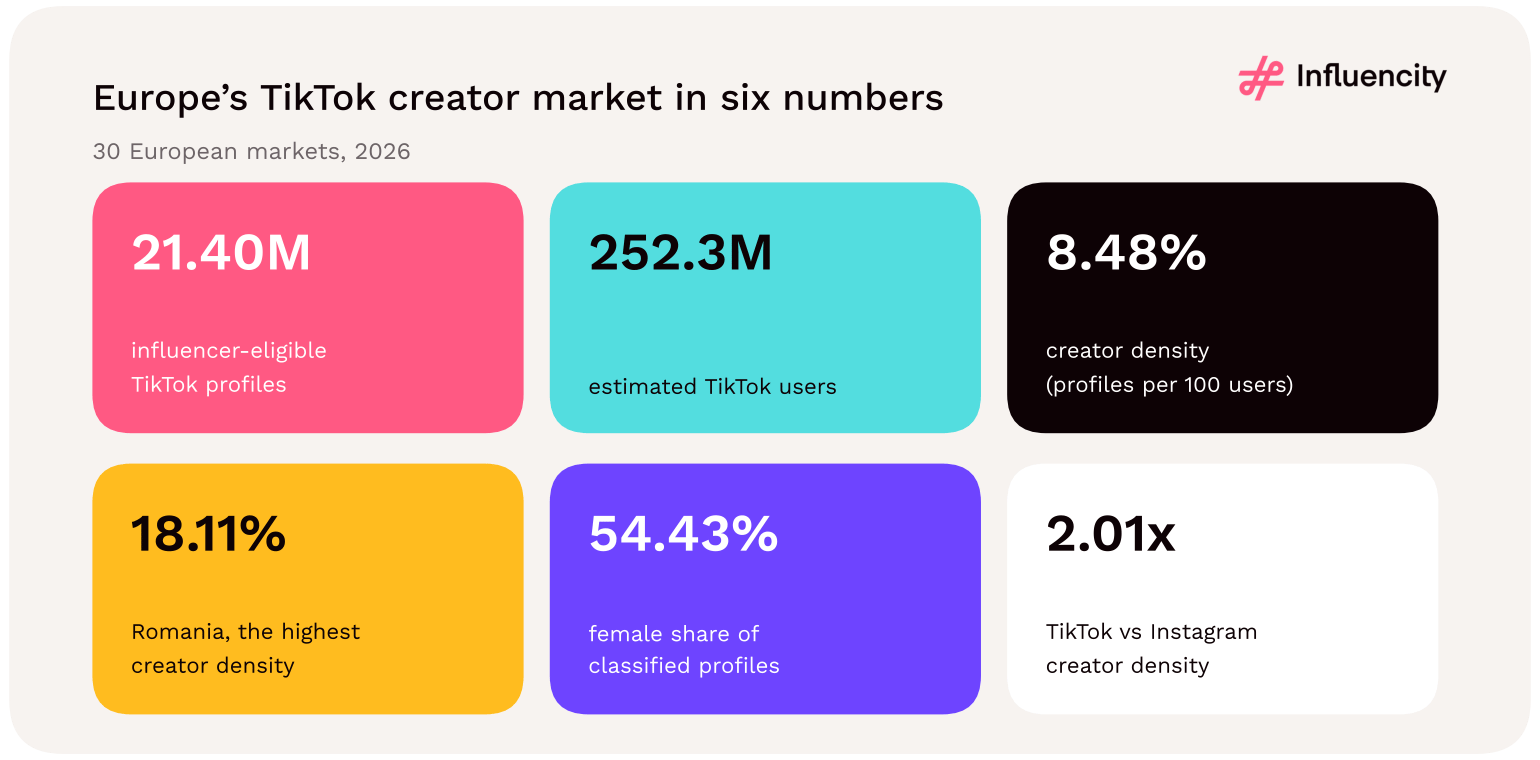
Influencity's 2026 dataset, observed in October–November 2026, records 21,397,089 influencer-eligible TikTok profiles and 252,341,000 estimated TikTok users across 30 European markets. That equals 8.48 eligible profiles per 100 estimated users, compared with 4.21 for Instagram in the same footprint and 9.46 for TikTok in the US. Russia has the largest recorded creator pool; Romania has the highest creator density, at 18.11%. [1, 2, 4]
The European TikTok opportunity is not evenly distributed. Large audiences, large creator pools and high creator density describe different market conditions. France and the United Kingdom offer similar recorded scale, Romania stands out for density, and some of the strongest audience-to-population ratios occur in much smaller markets.
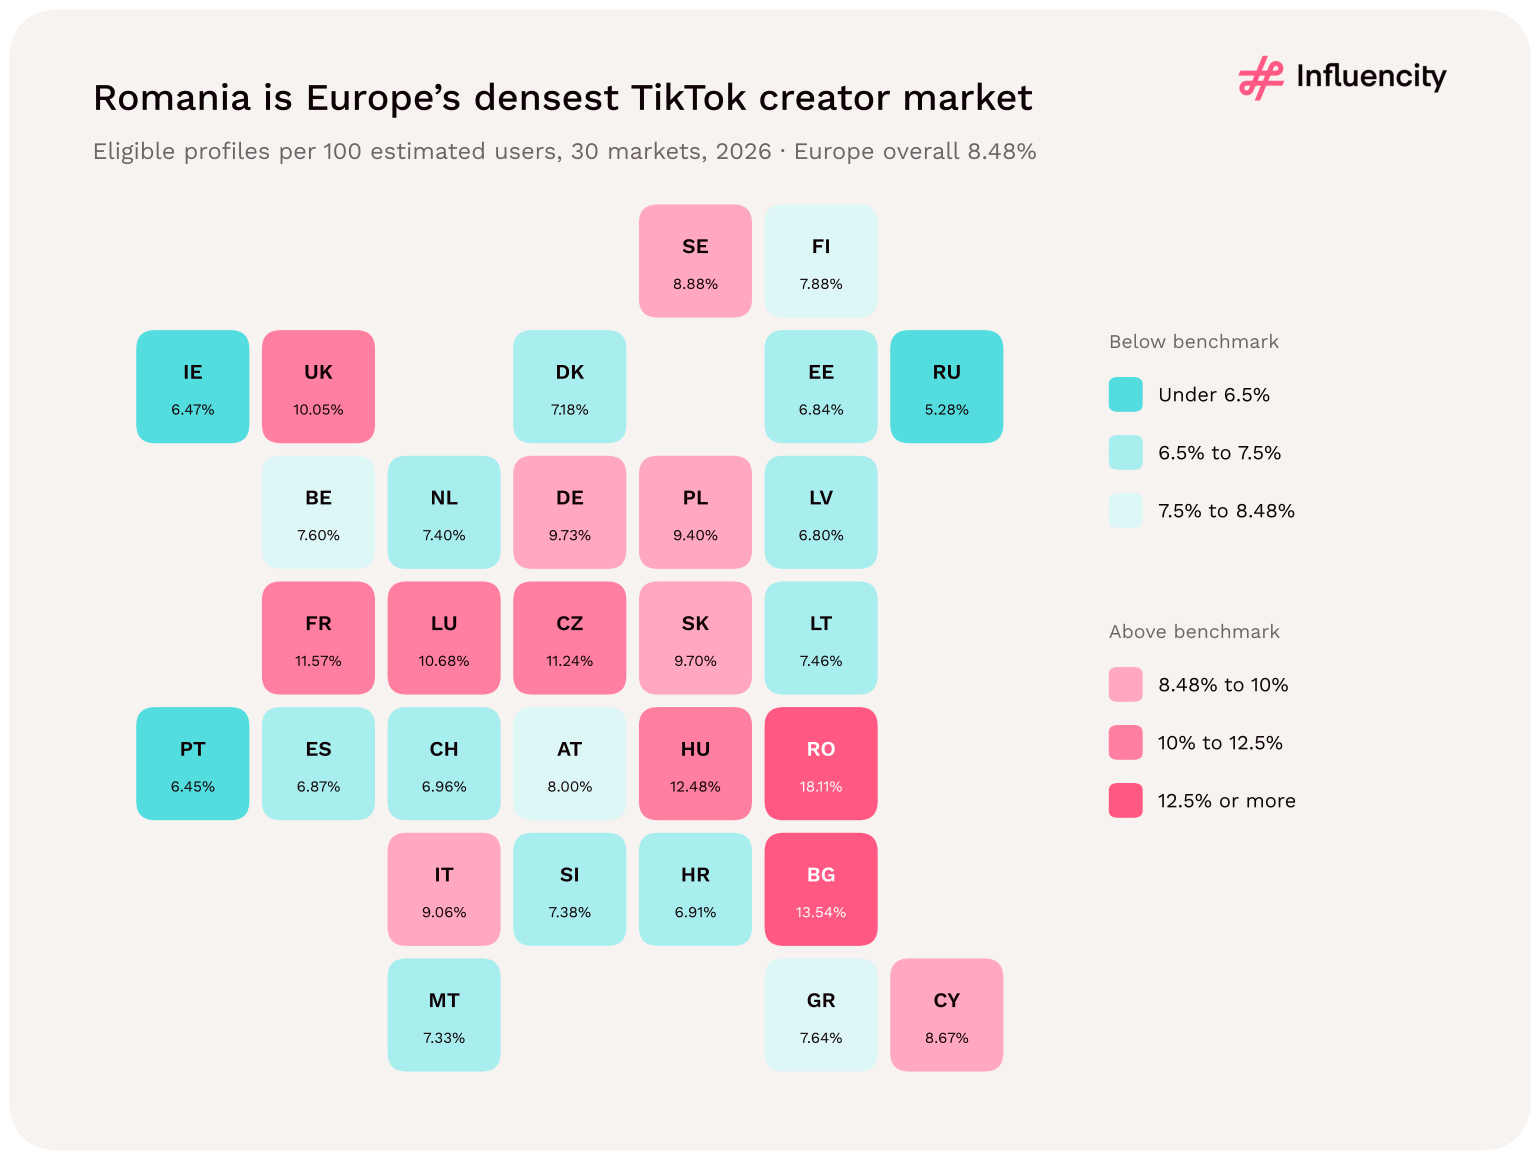
Figure 01 → TikTok creator density across the 30-market study footprint, 2026. Profiles are not unique people; markets outside the footprint are not shown, not zero. Source: [1].
Reading the study
Europe means the 30 markets listed in Appendix A, not the entire continent or the European Union alone. User estimates are not verified monthly-active-user counts. The follower-tier analysis covers 29 markets: Austria's macro-tier figure exceeds its total profile count, so Austria is excluded from all tier figures. The niche analysis (section 13) covers seven markets: Russia, France, the United Kingdom, Germany, Italy, Romania and Spain.
Section 15 compares Europe with Influencity's 2026 US TikTok study, and section 16 adds engagement, sentiment and disclosure evidence from two Influencity category studies.
Contents
A 21.40M-profile discovery universe. Influencity's 2026 dataset, observed in October–November 2026, records 21,397,089 influencer-eligible TikTok profiles across 30 European markets, not 21.40M verified professional influencers. Recruitment still requires checks on audience relevance, activity, content quality and availability. [1]
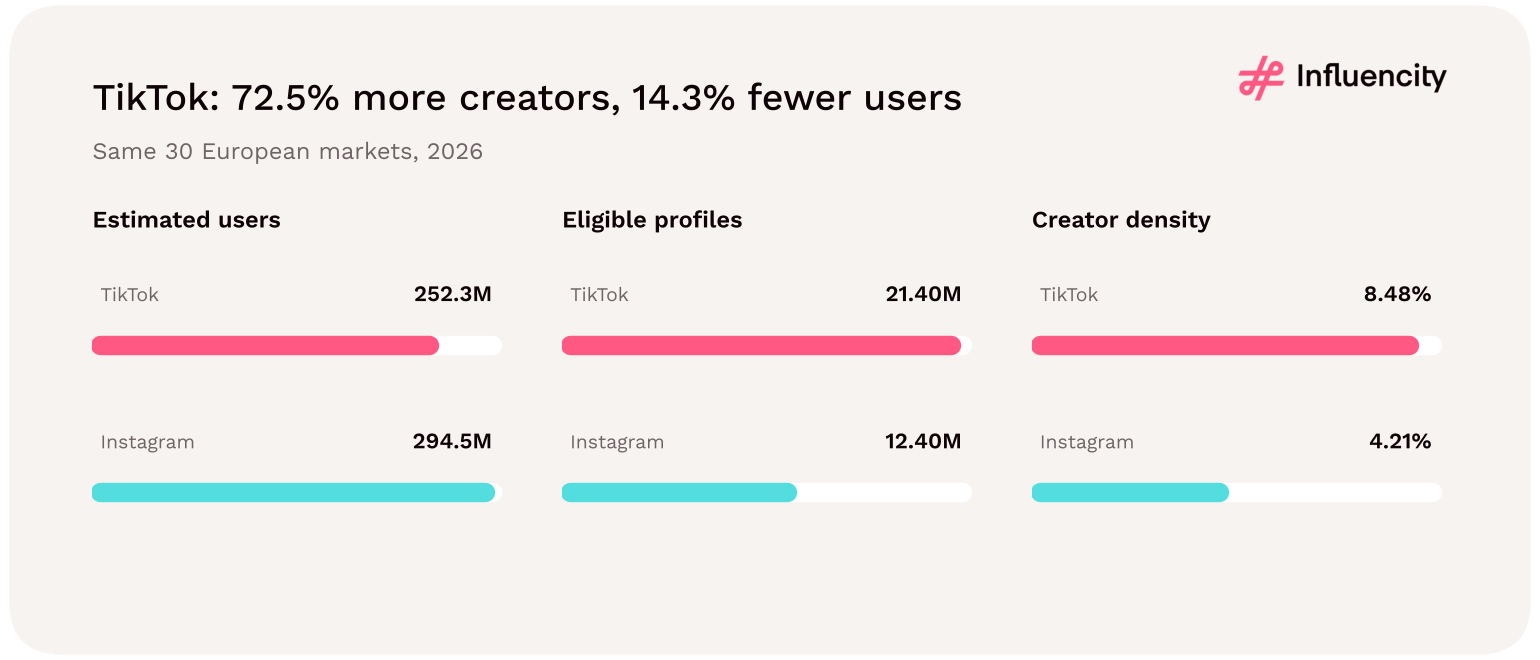
TikTok is about twice as creator-dense as Instagram. Across the same 30 markets, TikTok has 72.5% more eligible profiles and 14.3% fewer estimated users. Its 8.48% density is 2.01 times Instagram's 4.21%, almost the same ratio as in the US (2.04x). [1, 2, 4, 5]
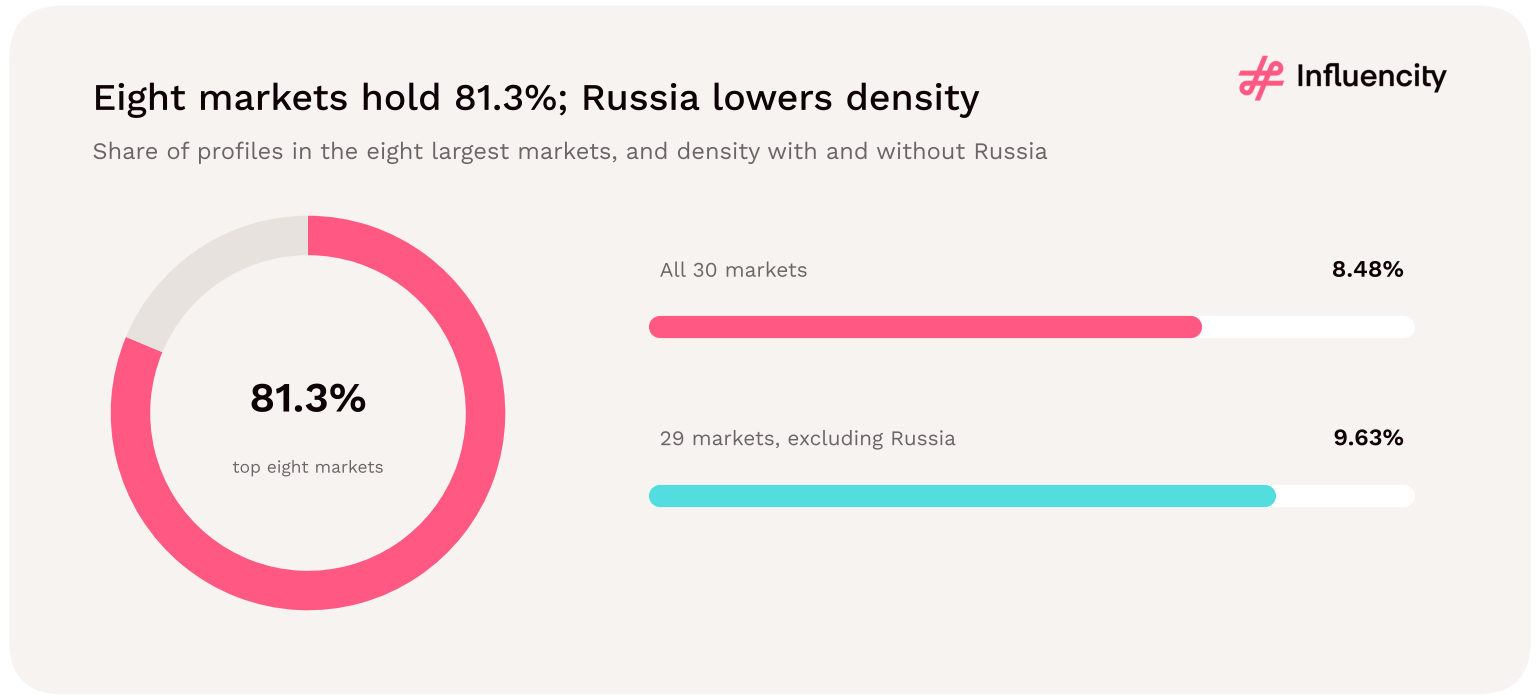
Eight countries hold 81.3% of recorded creator supply. Russia, France, the UK, Germany, Italy, Romania, Spain and Poland together contain 17,404,408 profiles. France exceeds the UK by only 14,018 profiles. [1]
Romania leads on density and on creators per resident. Its 1,577,542 profiles equal 18.11% of estimated TikTok users, 2.14 times the regional benchmark, and 83.9 per 1,000 residents against 31.9 regionally. [1]
Central and Eastern Europe is the density belt. The 11 CEE markets hold 19.5% of profiles against 13.7% of estimated users, a combined 12.06% density. Without Romania the group is still at 10.02%, above the 8.48% benchmark. [1]
Audience penetration and creator density do not rank markets alike. Ireland has the highest estimated users-to-population ratio, 48.35%, but a below-average 6.47% creator density. Across the 30 markets the two measures are not meaningfully related. [1]
Large creators cluster in a few markets. Russia, the UK, France, Spain and Germany hold 81.2% of the 13,296 mega entries (1M+ followers) in the 29-market tier view. The UK has the most per million estimated users (92, against 53 across the 29 markets). [1]
Europe's TikTok influencers are far less female-skewed than the US pool. Female-classified profiles are 54.43% of male- or female-classified profiles (42.10% of all profiles) against 63.1% in the US, and six European markets have male majorities. On Instagram the two regions are almost identical (59.8% in Europe, 60.3% in the US). [1, 4, 6]
Nine in ten tier entries are nano. In the 29-market view excluding Austria, 90.0% of follower-tier entries have under 10k followers and 0.06% have 1M+. Austria is excluded because its macro-tier figure exceeds its profile count. [1]
Europe has a bigger pool than the US but lower density. Europe records 47.9% more eligible profiles and 64.9% more estimated users than the US, but 8.48% density against 9.46%, and 31.9 profiles per 1,000 residents against 42.2. [1, 4]
Every market has a signature niche. Among the seven largest markets, wellness over-indexes most in the UK (25.0% of niche tags, 2.2 times the average), tech & gaming in Russia (33.1%) and travel in Spain (19.5%). Tech & gaming is the only niche with a male majority (44.9% female among classified creators). [1]
Sources: [1, 2, 4–7].
Each line below is self-contained and can be quoted on its own. Keep the scope note beside the figure when reusing it.
| Statistic (TikTok, 30 European markets, October–November 2026) | Value | Scope note |
|---|---|---|
| Influencer-eligible TikTok profiles | 21,397,089 | Profiles, not unique people |
| Estimated TikTok users | 252,341,000 | Audience estimate, not MAU |
| Creator density | 8.48% | ≈1 eligible profile per 11.8 users |
| Largest creator pool | Russia: 3,523,007 | 16.5% of the regional pool |
| Highest creator density | Romania: 18.11% | 2.14x the regional benchmark |
| Most creators per resident | Romania: 83.9 per 1,000 | Region: 31.9 per 1,000 |
| TikTok vs Instagram density | 8.48% vs 4.21% | 2.01x, same 30 markets |
| Female share of classified profiles | 54.43% | 22.65% of all profiles unclassified |
| Markets with a male classified majority | 6 of 30 | Austria, Germany, Luxembourg, Malta, Slovenia, Switzerland |
| Nano share of tier entries | 90.0% | 29 markets excl. Austria |
| Mega entries (1M+ followers) | 13,296 | 81.2% in five markets; 29 markets excl. Austria |
| Top eight markets’ share of profiles | 81.3% | Russia, France, UK, Germany, Italy, Romania, Spain, Poland |
Sources: [1, 2, 4].

Figure 02 → Headline statistics from the 2026 TikTok Europe study, 30 markets. Source: [1, 2].
Across the covered markets, Influencity records 252.3M estimated TikTok users and 21.40M influencer-eligible profiles. The 2026 population reference is 670.2M. These are three different measurement units, not interchangeable descriptions of campaign reach. [1]
| Metric | 2026 value | What it measures |
|---|---|---|
| Population reference | 670,224,257 | Sum of the 30 country 2026 population references |
| Estimated TikTok users | 252,341,000 | The platform-audience estimate field |
| Influencer-eligible profiles | 21,397,089 | Recorded eligible accounts, not unique people |
| Creator density | 8.48% | Eligible profiles / estimated users |
| Users / population | 37.65% | Contextual audience-penetration ratio |
| Profiles / population | 3.19% | A different ratio from creator density |
| Female share, classified | 54.43% | Female / (female + male) |
| No-gender share, all profiles | 22.65% | No-gender records / total profiles |
How many potential profiles can be screened? Start with the eligible profile count. How dense is that supply relative to the platform audience? Use creator density; the weighted regional ratio is 8.48%, not the simple average of country percentages. How large is the estimated audience relative to population? Use users divided by the population reference; this is context, not a verified adoption survey.
At the regional ratio there is one eligible profile for every 11.8 estimated TikTok users, and 31.9 eligible profiles for every 1,000 residents. The spread between markets is wide: Romania has one eligible profile per 5.5 estimated users; Russia has one per 18.9. [1]
A market with 1,000,000 estimated TikTok users would record about 84,800 eligible profiles at the regional ratio, about 181,100 at Romania's ratio and about 52,800 at Russia's. The arithmetic shows why the same audience size can produce very different discovery pools. It does not show how many of those profiles would suit a given brief.
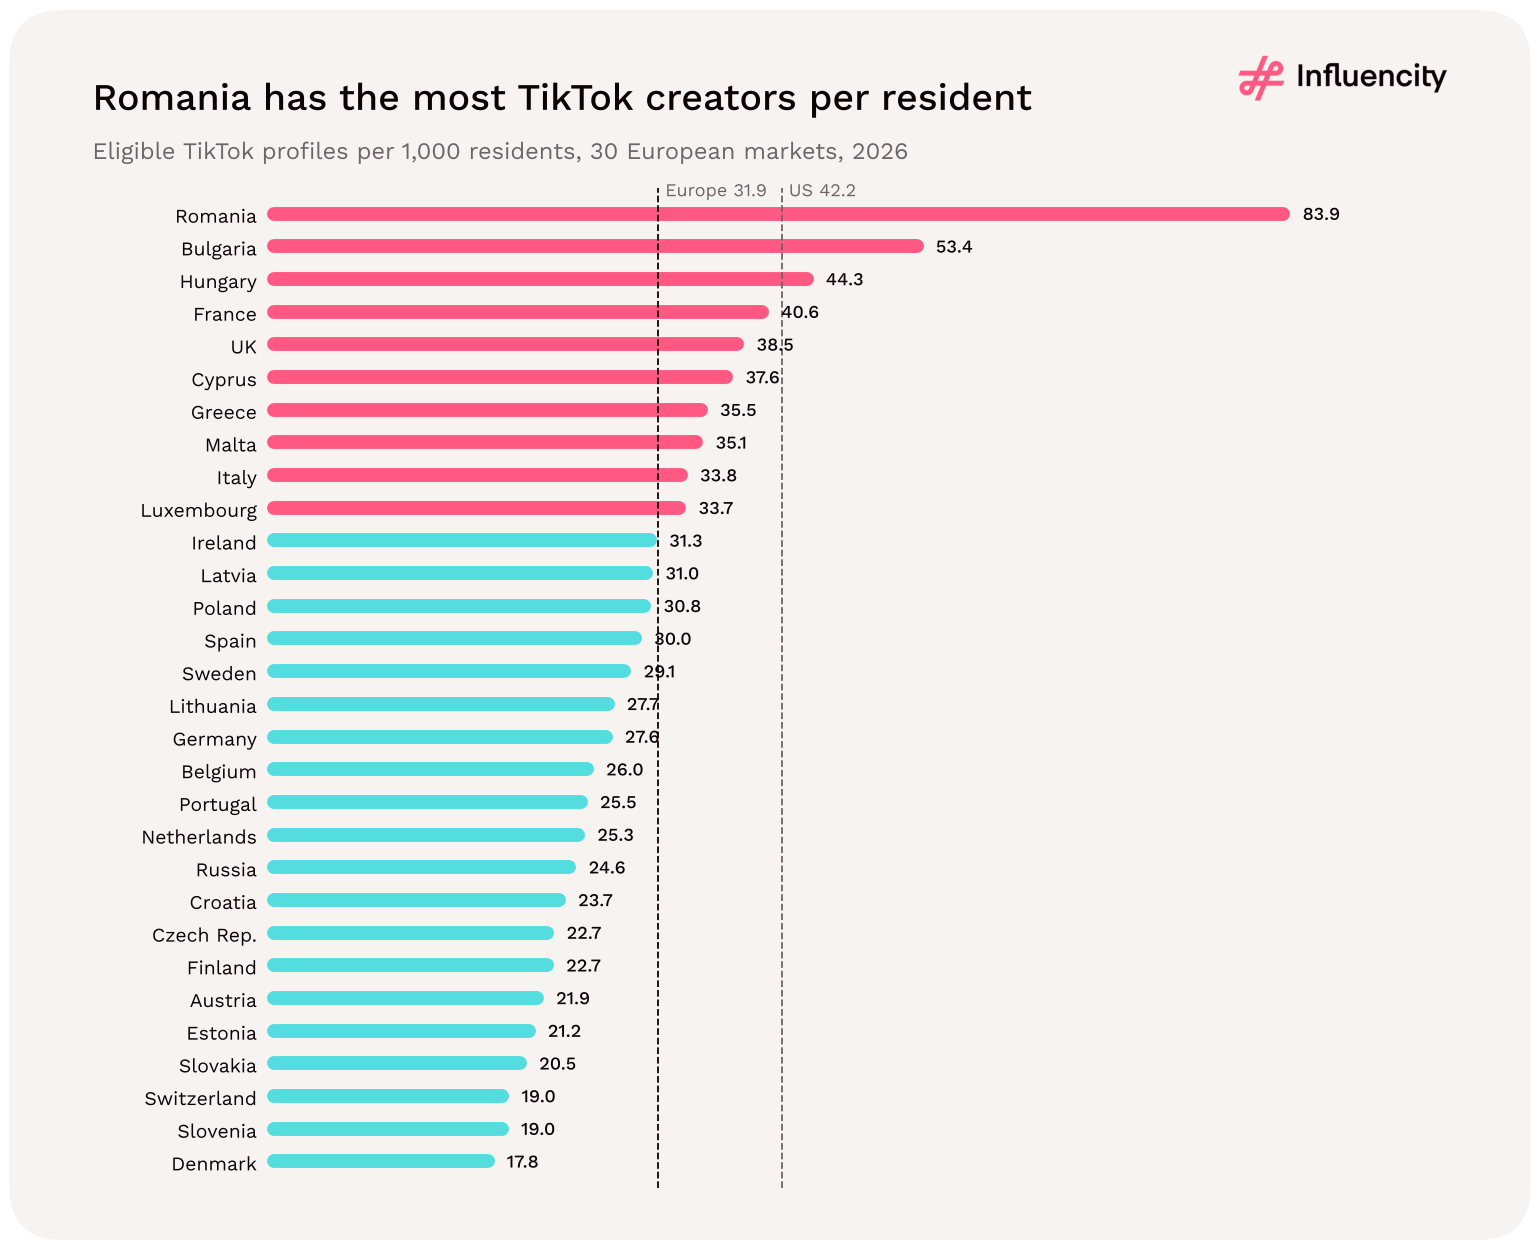
Profiles per 1,000 residents combine audience penetration and creator density. Romania leads at 83.9, followed by Bulgaria (53.4), Hungary (44.3), France (40.6) and the UK (38.5). Denmark has the fewest (17.8), with Slovenia and Switzerland close behind (both 19.0). The median market records 28.4. [1]
| Country | Profiles per 1,000 residents | Users / population | Creator density |
|---|---|---|---|
| Romania | 83.9 | 46.33% | 18.11% |
| Bulgaria | 53.4 | 39.44% | 13.54% |
| Hungary | 44.3 | 35.47% | 12.48% |
| France | 40.6 | 35.06% | 11.57% |
| United Kingdom | 38.5 | 38.32% | 10.05% |
| Region (30 markets) | 31.9 | 37.65% | 8.48% |
| Estonia | 21.2 | 30.95% | 6.84% |
| Slovakia | 20.5 | 21.10% | 9.70% |
| Switzerland | 19.0 | 27.31% | 6.96% |
| Slovenia | 19.0 | 25.68% | 7.38% |
| Denmark | 17.8 | 24.74% | 7.18% |
Source: [1]. Profiles per 1,000 residents = eligible profiles ÷ population × 1,000.

Figure 03 → TikTok creator supply relative to residents, 30 markets. Not the share of residents who are creators. Source: [1].
In Europe, differences in profiles per resident come from both levers, how many residents use TikTok and how many influencers there are per user. Splitting the variation across the 30 markets, audience penetration and creator density contribute in similar measures (they partly offset each other). A high per-resident figure can therefore come from a big audience, a dense creator base, or both, as in Romania. [1]
Key takeaways
Europe has one eligible TikTok profile for every 11.8 estimated users and 31.9 per 1,000 residents (Influencity, 2026, 30 markets).
Romania records 83.9 eligible TikTok profiles per 1,000 residents, the highest in the study; Denmark records 17.8, the lowest.
Use profile counts to size discovery, density to compare supply with the audience, and per-resident figures to gauge how visible creators are locally.
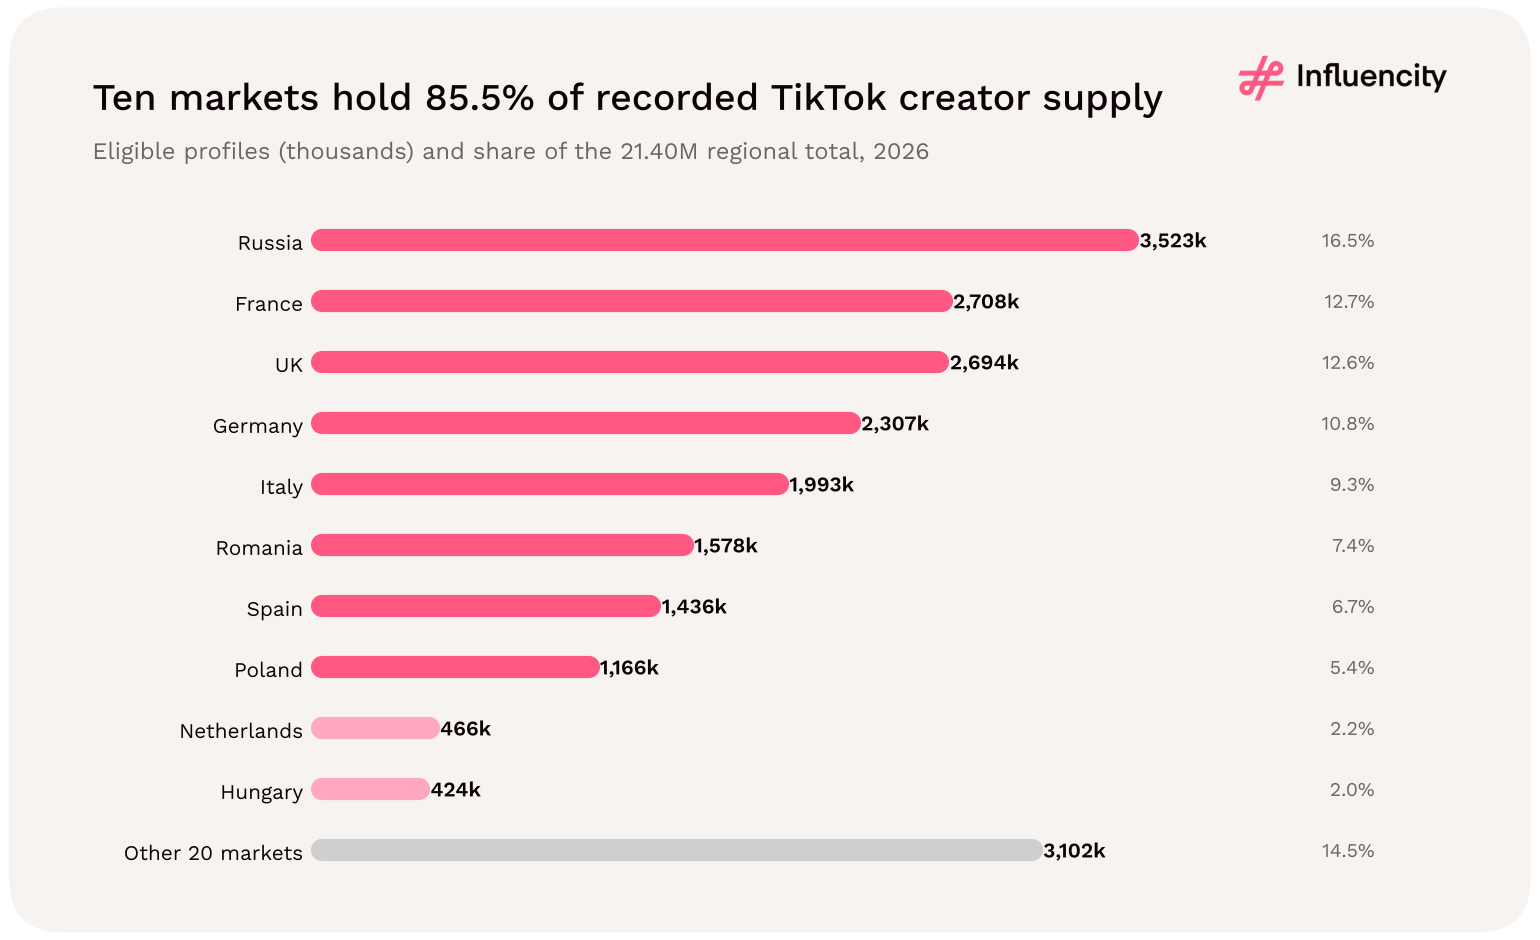
Russia ranks first with 3,523,007 eligible profiles. France and the United Kingdom follow with 2,708,112 and 2,694,094 respectively. Eight countries each exceed one million recorded profiles. These rankings describe supply, not creator quality or campaign performance. [1]
| Rank | Country | Eligible profiles | Share of total | Density |
|---|---|---|---|---|
| 1 | Russia | 3,523,007 | 16.5% | 5.28% |
| 2 | France | 2,708,112 | 12.7% | 11.57% |
| 3 | United Kingdom | 2,694,094 | 12.6% | 10.05% |
| 4 | Germany | 2,306,700 | 10.8% | 9.73% |
| 5 | Italy | 1,993,272 | 9.3% | 9.06% |
| 6 | Romania | 1,577,542 | 7.4% | 18.11% |
| 7 | Spain | 1,436,110 | 6.7% | 6.87% |
| 8 | Poland | 1,165,571 | 5.4% | 9.40% |
| 9 | Netherlands | 466,499 | 2.2% | 7.40% |
| 10 | Hungary | 424,432 | 2.0% | 12.48% |

Figure 04 → The ten largest country creator pools contain 18,295,339 profiles, or 85.5% of the study total; the other 20 markets hold 3,101,750. Source: [1].
France has only 14,018 more profiles than the UK, roughly 0.5% of the UK count. The data provide no uncertainty intervals, so the exact ordering should not be turned into a claim that one market offers meaningfully better recruitment conditions. [1]
Each snapshot answers "How many TikTok influencers are there in [country]?" with the 2026 count and the context needed to use it.
Russia. Russia records 3,523,007 eligible TikTok profiles, 16.5% of the regional pool and the most of any covered market. Its 5.28% density is the lowest of the 30 (18.9 estimated users per profile), and 31.63% of its profiles are unclassified by gender, also the highest. It holds 3,010 mega entries, 22.6% of the 29-market tier total. [1, 2]
France. France records 2,708,112 profiles (12.7%) at 11.57% density, the highest among the five largest pools. It has 40.6 profiles per 1,000 residents and the region's highest density of creators with 10k+ followers (1.35 per 100 estimated users). TikTok's lead over Instagram is larger in France (+1.83M profiles) than anywhere else. [1, 2]
United Kingdom. The UK records 2,694,094 profiles (12.6%) at 10.05% density, against the largest estimated audience outside Russia (26.8M users). It has the highest female share of classified profiles (60.89%), the highest share of tier entries with 10k+ followers (11.81%) and the most mega entries per million estimated users (92). [1, 2]
Germany. Germany records 2,306,700 profiles (10.8%) at 9.73% density, despite a low estimated users-to-population ratio (28.33%). It is the largest of the six male-majority markets: 49.44% of classified profiles are female. Its 1,511 mega entries rank fifth. [1, 2]
Italy. Italy records 1,993,272 profiles (9.3%) at 9.06% density and 33.8 profiles per 1,000 residents. It also has the third-largest Instagram pool in the footprint (1,656,396), so TikTok's lead is only 1.20x: Italy is a genuine two-platform market. [1, 2]
Romania. Romania records 1,577,542 profiles (7.4%) against only 3.45% of estimated users. Its 18.11% density (5.5 users per profile) and 83.9 profiles per 1,000 residents both lead the region. Only 6.58% of its tier entries have 10k+ followers, yet relative to its audience it still has as many 10k+ creators per user as the UK, behind only France. [1, 2]
Spain. Spain records 1,436,110 profiles (6.7%) at 6.87% density, below the benchmark, with a high estimated users-to-population ratio (43.68%). Its pool leans larger: 11.75% of tier entries have 10k+ followers and it holds 1,715 mega entries. Instagram's pool is almost as large (1.07x), and 59.71% of classified TikTok profiles are female. [1, 2]
Poland. Poland records 1,165,571 profiles (5.4%) at 9.40% density. TikTok has 3.16 times as many eligible profiles as Instagram, the fourth-largest platform multiple. It has a high unclassified share (27.77%) and a female-leaning classified pool (58.92%). [1, 2]
| Country | Profiles | Density | Users per profile | Female, classified | 10k+ share | Mega |
|---|---|---|---|---|---|---|
| Russia | 3,523,007 | 5.28% | 18.9 | 51.4% | 11.6% | 3,010 |
| France | 2,708,112 | 11.57% | 8.6 | 52.9% | 11.6% | 2,096 |
| United Kingdom | 2,694,094 | 10.05% | 9.9 | 60.9% | 11.8% | 2,467 |
| Germany | 2,306,700 | 9.73% | 10.3 | 49.4% | 10.8% | 1,511 |
| Italy | 1,993,272 | 9.06% | 11.0 | 53.5% | 9.0% | 1,002 |
| Romania | 1,577,542 | 18.11% | 5.5 | 51.9% | 6.6% | 178 |
| Spain | 1,436,110 | 6.87% | 14.6 | 59.7% | 11.7% | 1,715 |
| Poland | 1,165,571 | 9.40% | 10.6 | 58.9% | 7.9% | 343 |
Sources: [1, 2]. 10k+ share = (micro + macro + mega) ÷ all tier entries for that country.
Five markets record fewer than 55,000 eligible profiles: Malta (19,283), Luxembourg (23,171), Estonia (28,184), Slovenia (40,089) and Cyprus (51,993). Together they hold 0.76% of the regional pool. Once a brief is filtered by language, category and audience location, local rosters there may run to dozens rather than thousands of candidates. [1]
Size the shortlist, not the market
Before committing a budget to a country, run the brief’s real filters (language, category, follower location, recent activity) and record how many profiles survive. That surviving count, not the national total, is the recruitment capacity.
In small markets, consider creators based in neighbouring markets whose audiences demonstrably include the target country, for example Belgian or French creators for Luxembourg.
So, Russia (3.52M), France (2.71M) and the UK (2.69M) are Europe’s three largest TikTok creator pools in 2026, and France has the highest density of the five largest pools (11.57%); Spain and Russia are the only million-plus markets below the 8.48% benchmark. Malta, Luxembourg, Estonia, Slovenia and Cyprus each record fewer than 55,000 eligible profiles.
The top five countries contain 61.8% of recorded profiles, and the top eight contain 81.3%. The remaining 22 markets still contribute almost 4.0M profiles. Concentration helps size a discovery plan; it does not justify ignoring relevant smaller-language or specialist markets. [1]
| Country group | Eligible profiles | Share of profiles | Share of users |
|---|---|---|---|
| Top 3 by profile count | 8,925,213 | 41.7% | 46.3% |
| Top 5 by profile count | 13,225,185 | 61.8% | 64.4% |
| Top 8 by profile count | 17,404,408 | 81.3% | 81.1% |
| Top 10 by profile count | 18,295,339 | 85.5% | 84.9% |
Russia represents 16.5% of profiles but 26.4% of estimated users. Its 5.28% creator density is the lowest in the study, which pulls down the weighted regional ratio. A clearly labelled sensitivity calculation excluding Russia increases TikTok density from 8.48% to 9.63%, slightly above the US figure of 9.46%. [1, 4]
| Coverage | TikTok profiles | TikTok users | Density |
|---|---|---|---|
| All 30 markets | 21,397,089 | 252,341,000 | 8.48% |
| 29 markets, excluding Russia | 17,874,082 | 185,641,000 | 9.63% |

Figure 05 → Country composition changes the weighted benchmark; the 29-country calculation is a sensitivity view, not a replacement footprint. Source: [1].
Two standard measures confirm the picture. The Herfindahl–Hirschman Index (HHI) is 947 for eligible profiles, 1,191 for estimated users and 1,020 for population. Expressed as an effective number of equal-sized markets, creator supply behaves like 10.6 markets, users like 8.4 and population like 9.8. [1]
This is the reverse of the pattern in Influencity's 2026 US Instagram study, where creator supply is more concentrated than the audience (HHI 812 for eligible profiles against 478 for estimated users across US states). In European TikTok, Russia's large audience and comparatively thin creator base pull user concentration above profile concentration. For planners, supply is less of a bottleneck outside the biggest markets than audience size would suggest. [1, 5]
| Measure | Eligible profiles | Estimated users | Population |
|---|---|---|---|
| HHI (0–10,000) | 947 | 1,191 | 1,020 |
| Effective number of markets | 10.6 | 8.4 | 9.8 |
| Top five markets’ share | 61.8% | 64.4% | — |
Source: [1]. HHI = sum of squared percentage shares across 30 markets; effective number = 10,000 ÷ HHI. Top-five share uses markets ranked by profiles.
The five largest markets in each tier hold 61.6% of nano entries, 68.9% of micro entries, 75.6% of macro entries and 81.2% of mega entries (29 markets, excluding Austria). Smaller creators are spread across the map; the largest accounts are clustered in a handful of large Western and Southern markets and Russia. [1]
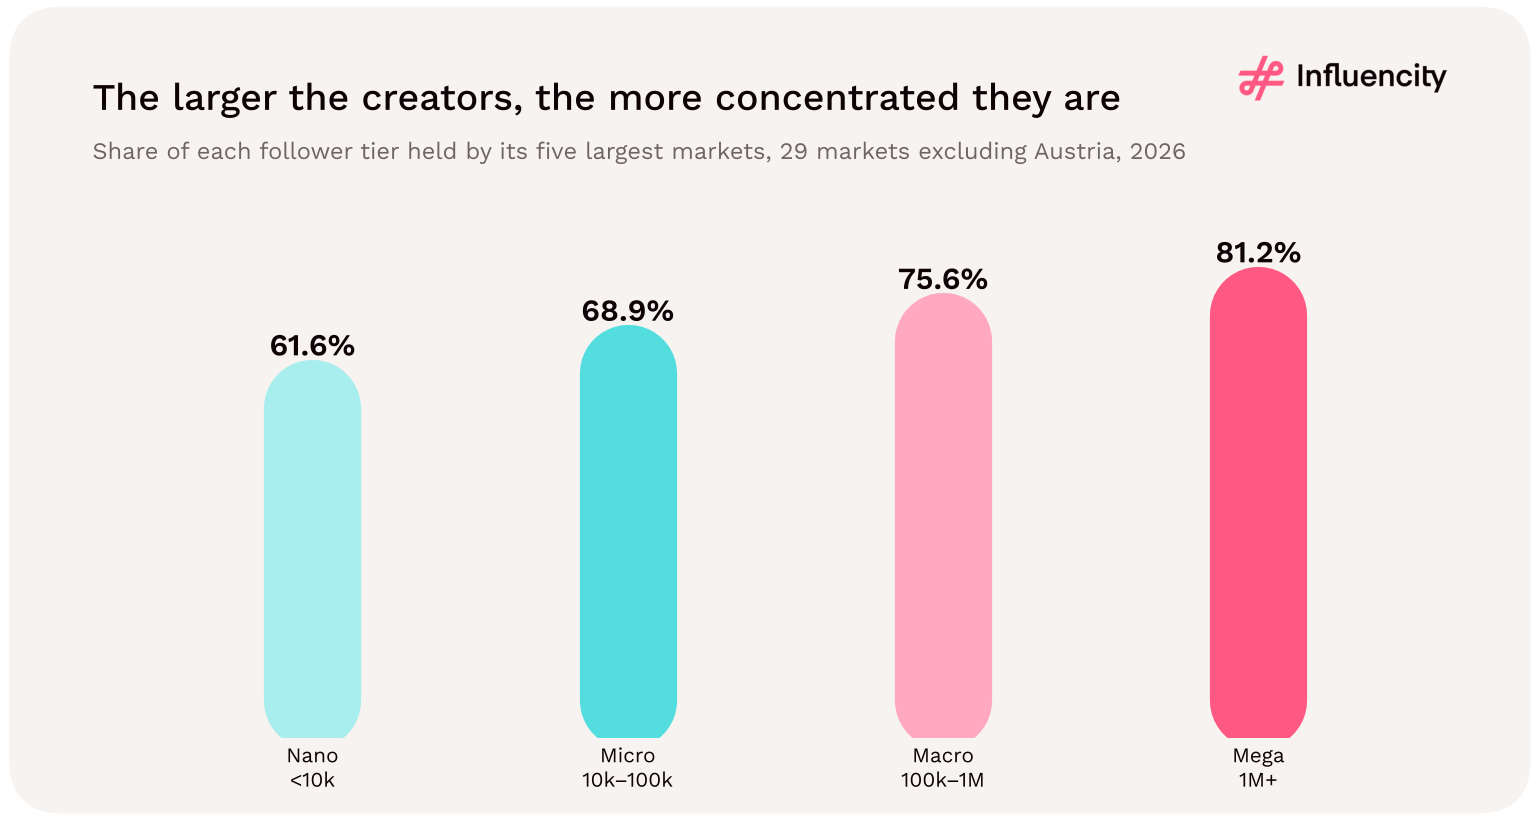
Figure 06 → Share of each tier held by the five largest markets in that tier, 29 markets excluding Austria. Source: [1].
What this means for recruitment
For nano and micro rosters, expect usable supply in most markets; for macro and mega partners, start in the UK, France and Spain, where mega creators are most available relative to the audience. Russia records the most mega entries, but read section 07 before including it.
Do not let the biggest markets set the whole plan: the 22 markets outside the top eight still record about 4.0M profiles.
Thus, the top eight markets hold 81.3% of Europe’s eligible TikTok profiles in 2026, yet creator supply is less concentrated than the audience (10.6 vs 8.4 effective markets). Concentration rises with follower size: the five largest markets hold 61.6% of nano entries but 81.2% of mega entries. Excluding Russia raises European TikTok creator density from 8.48% to 9.63%.
Romania leads with 18.11 eligible profiles per 100 estimated users, followed by Bulgaria at 13.54% and Hungary at 12.48%. Thirteen countries exceed the 8.48% weighted regional benchmark. Luxembourg is in the top six for density despite being a much smaller absolute market. [1]
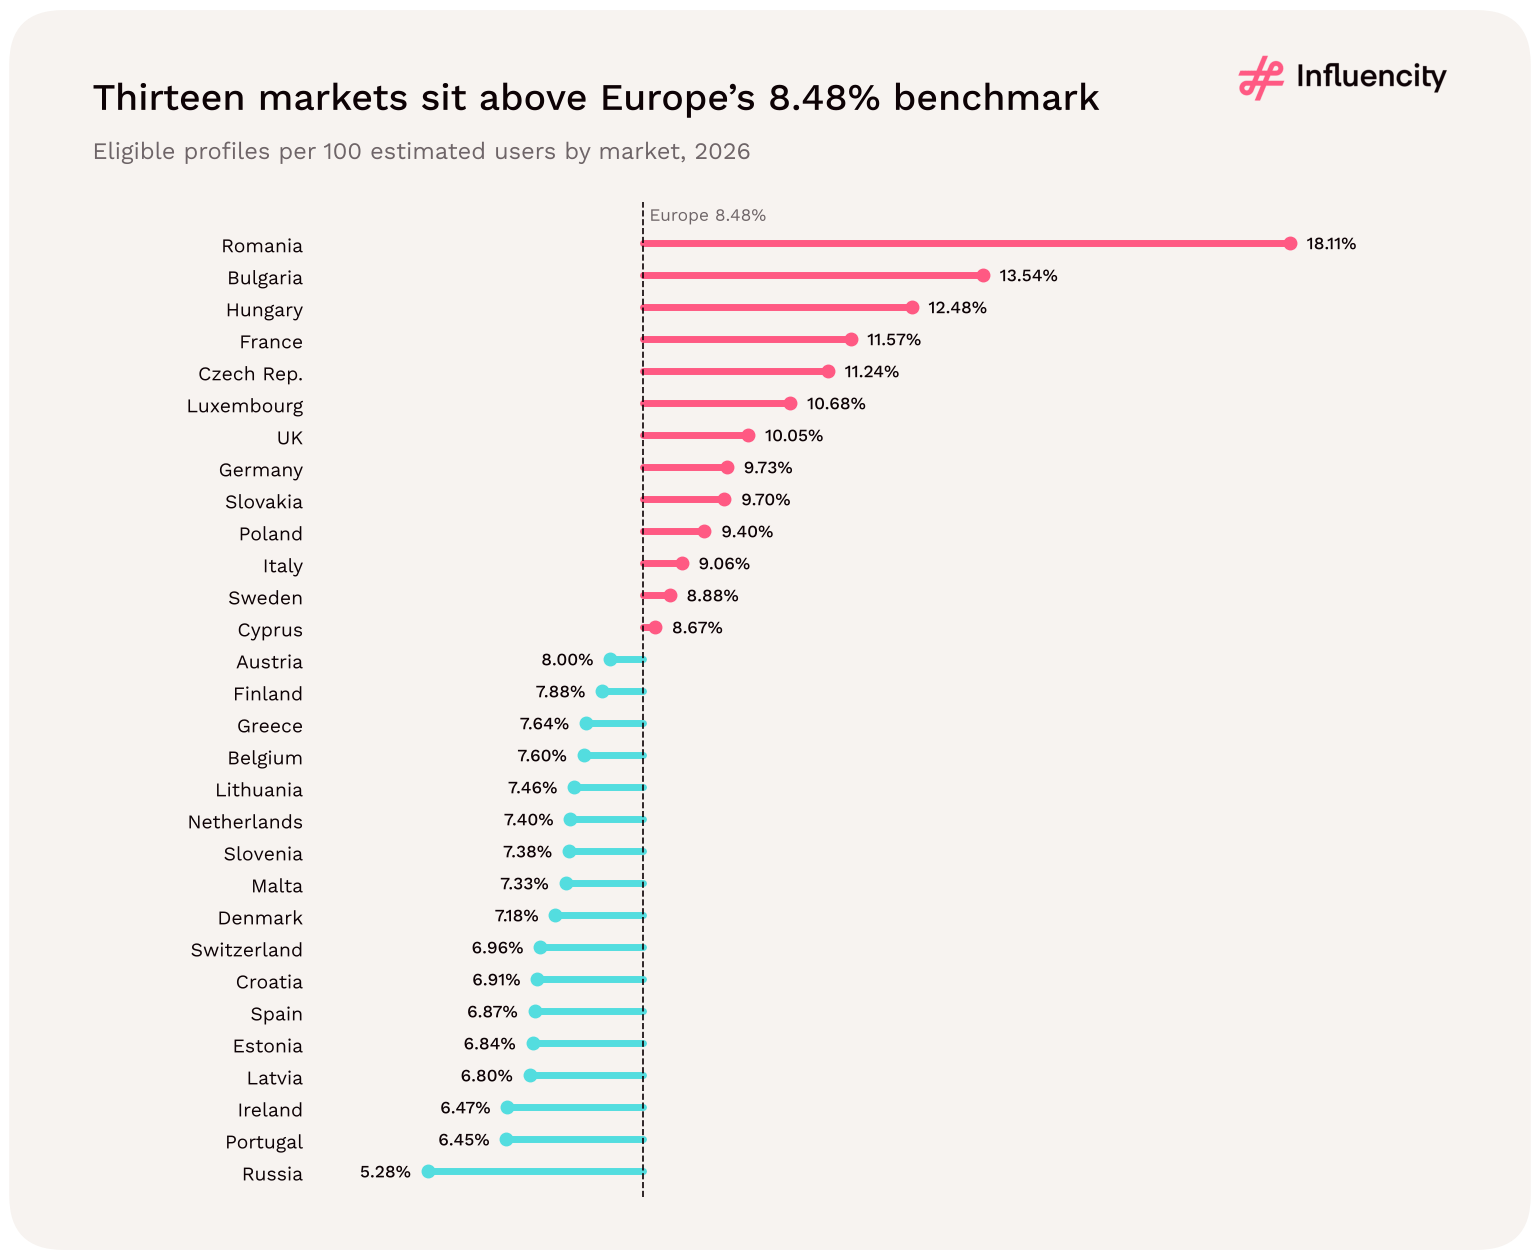
Figure 07 → Creator-to-user ratios for all 30 markets against the weighted benchmark. A ratio outlier is not a test of statistical significance. Source: [1].
Romania accounts for 7.37% of profiles against 3.45% of estimated users, a 2.14-fold over-representation relative to the regional average. Luxembourg also over-indexes, but its 23,171 profiles are only 0.11% of regional supply. The two markets should not receive the same scale assumptions. European country densities span 3.4-fold, from Russia's 5.28% to Romania's 18.11%. [1]
Thirteen markets exceed the weighted 8.48% benchmark. The median market density is 7.76% and the simple average of the 30 country percentages is 8.79%. The weighted regional figure sits between the two because Russia, the largest audience, has the lowest density. For a typical single-country brief, the median is the more realistic reference. [1]
| Country | Density | Index vs region | Users per profile | Share of profiles |
|---|---|---|---|---|
| Romania | 18.11% | 2.14x | 5.5 | 7.4% |
| Bulgaria | 13.54% | 1.60x | 7.4 | 1.7% |
| Hungary | 12.48% | 1.47x | 8.0 | 2.0% |
| France | 11.57% | 1.36x | 8.6 | 12.7% |
| Czech Republic | 11.24% | 1.33x | 8.9 | 1.1% |
| Luxembourg | 10.68% | 1.26x | 9.4 | 0.1% |
| United Kingdom | 10.05% | 1.19x | 9.9 | 12.6% |
| Germany | 9.73% | 1.15x | 10.3 | 10.8% |
| Slovakia | 9.70% | 1.14x | 10.3 | 0.5% |
| Poland | 9.40% | 1.11x | 10.6 | 5.4% |
| Italy | 9.06% | 1.07x | 11.0 | 9.3% |
| Sweden | 8.88% | 1.05x | 11.3 | 1.5% |
| Cyprus | 8.67% | 1.02x | 11.5 | 0.2% |
| Region (30 markets) | 8.48% | 1.00x | 11.8 | 100.0% |
Source: [1]. Index = country density ÷ 8.48%.
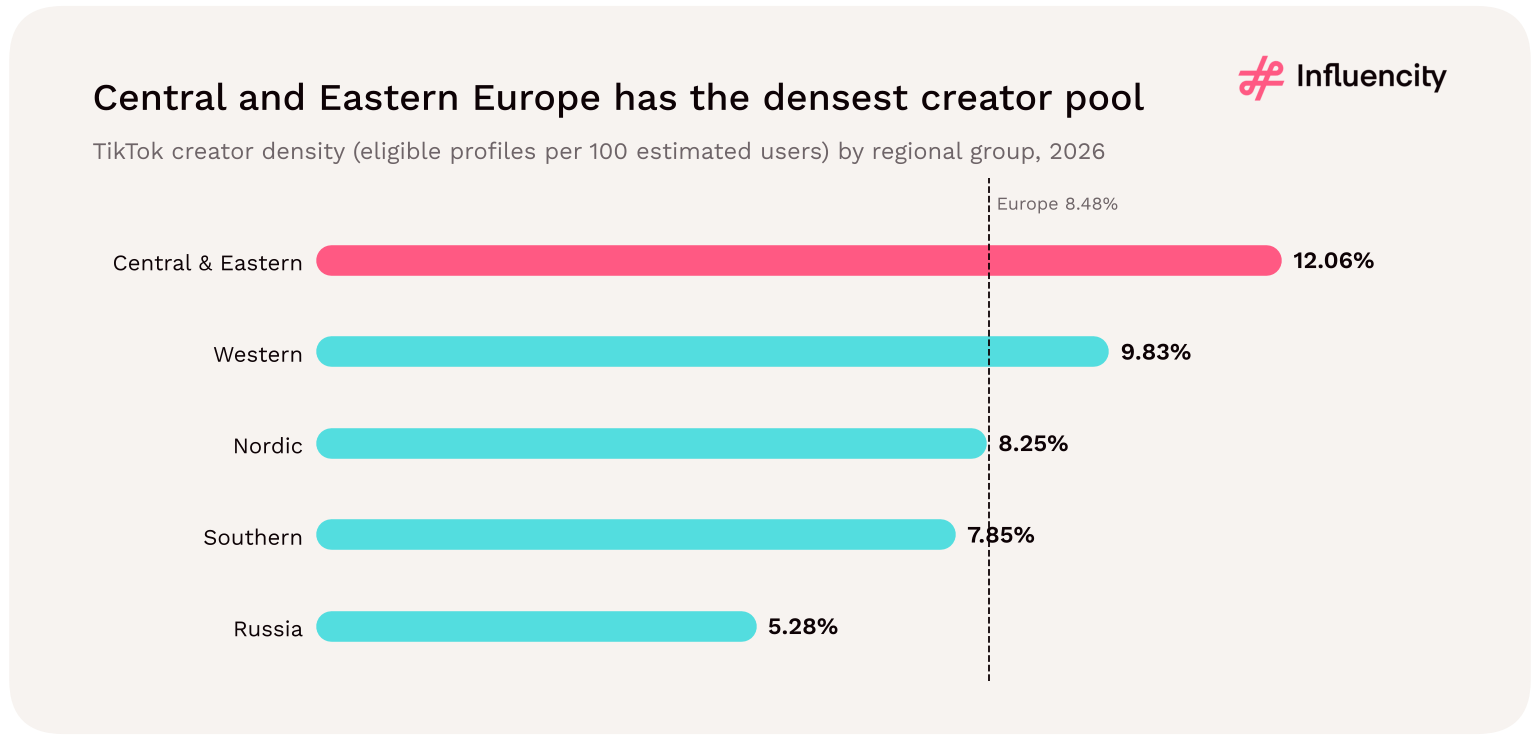
Grouping markets by region shows a clear pattern. The 11 Central and Eastern European (CEE) markets have a combined density of 12.06%, against 9.83% in Western Europe, 8.25% in the Nordics, 7.85% in Southern Europe and 5.28% in Russia. Removing Romania lowers CEE density to 10.02%, still the highest of the groups, so the pattern is regional rather than a single-country effect. [1]
| Region | Markets | Share of profiles | Share of users | Density | Per 1,000 residents |
|---|---|---|---|---|---|
| Central & Eastern | 11 | 19.5% | 13.7% | 12.06% | 41.4 |
| Western | 9 | 42.3% | 36.5% | 9.83% | 32.9 |
| Nordic | 3 | 2.6% | 2.6% | 8.25% | 24.4 |
| Southern | 6 | 19.2% | 20.8% | 7.85% | 31.9 |
| Russia | 1 | 16.5% | 26.4% | 5.28% | 24.6 |
| All 30 markets | 30 | 100.0% | 100.0% | 8.48% | 31.9 |
Source: [1]. Regional groupings are defined in section 21. They are analytical groupings, not official classifications.

Figure 08 → Creator density by regional group. Groupings are analytical, defined in section 21. Source: [1].
Partly, but not only. Splitting tier entries by size (29 markets, excluding Austria) shows that Romania's lead comes mainly from nano profiles (16.9 per 100 estimated users), yet it also records 1.19 creators with 10k+ followers per 100 users, level with the UK (1.19) and behind only France (1.35). Bulgaria and Hungary are dense almost entirely in nano entries (12.8 and 11.7 per 100 users) with below-average 10k+ density. [1]
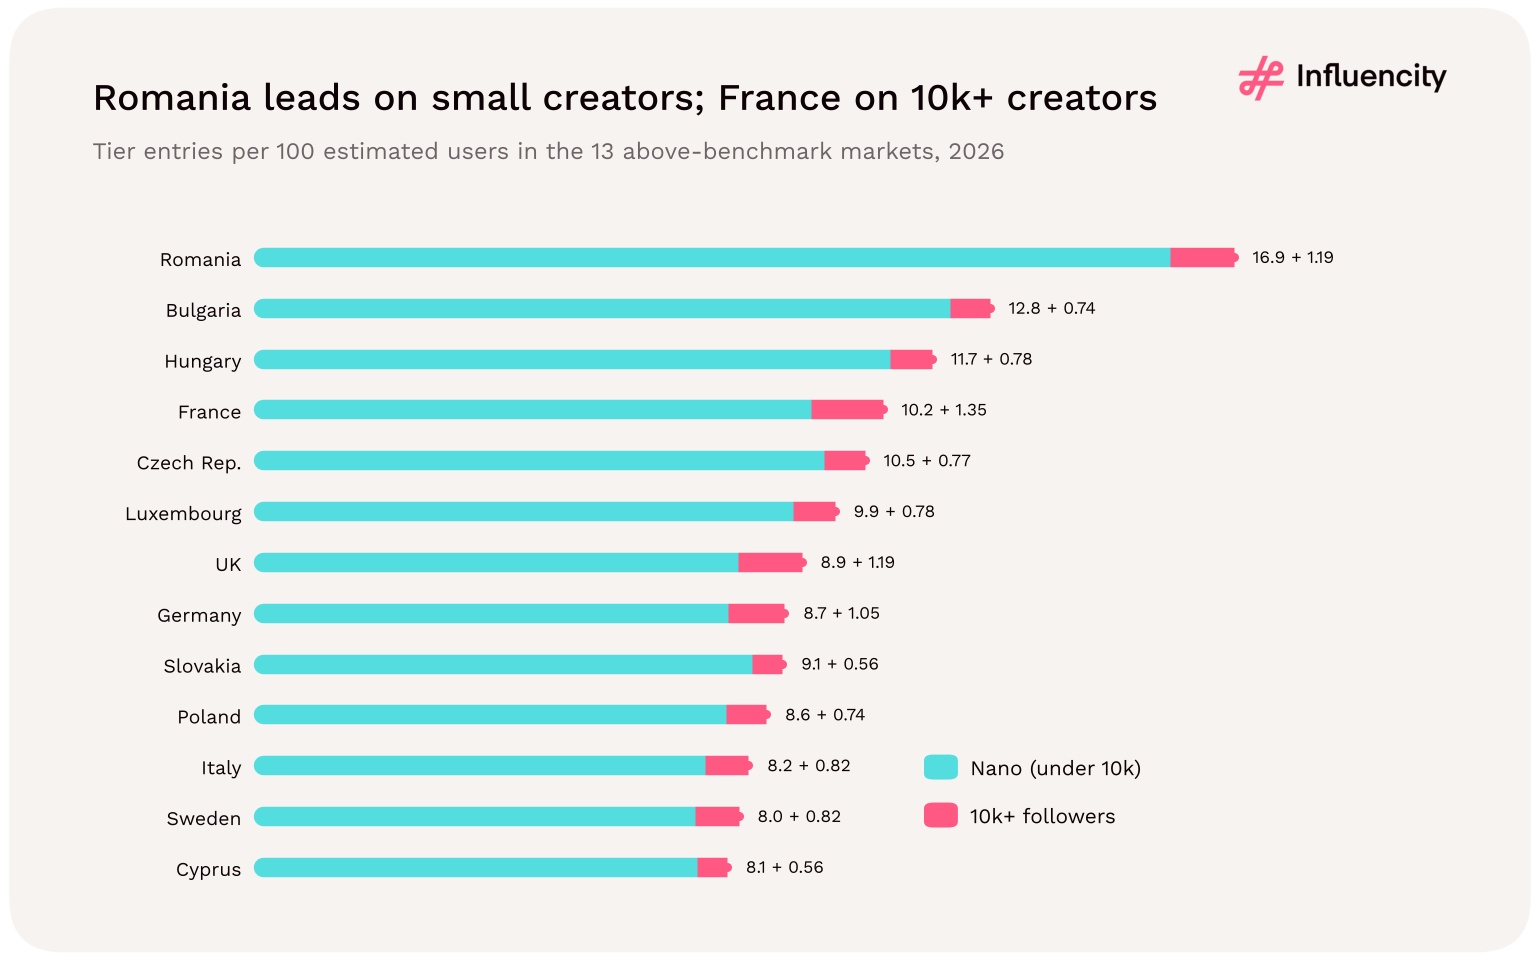
| Country | Nano entries per 100 users | 10k+ entries per 100 users | 10k+ share of entries |
|---|---|---|---|
| Romania | 16.90 | 1.19 | 6.6% |
| Bulgaria | 12.81 | 0.74 | 5.5% |
| Hungary | 11.69 | 0.78 | 6.3% |
| France | 10.21 | 1.35 | 11.6% |
| Czech Republic | 10.45 | 0.77 | 6.9% |
| United Kingdom | 8.86 | 1.19 | 11.8% |
| Germany | 8.67 | 1.05 | 10.8% |
| Poland | 8.64 | 0.74 | 7.9% |
| 29 markets (excl. Austria) | 7.63 | 0.85 | 10.0% |
Source: [1]. Tier data for 29 markets, excluding Austria (see Appendix C).

Figure 09 → Creator density split into nano entries and entries with 10k+ followers, per 100 estimated users. Excludes Austria. Source: [1].
What this means for campaign planning
Romania offers depth in both small and mid-to-large creators relative to its audience; it is the strongest single test market for supply-led TikTok programmes.
Bulgaria and Hungary suit nano-led, community-scale tests; expect fewer large accounts.
France and the UK combine high density with the deepest pools of 10k+ creators, which suits mixed-tier rosters.
So, Romania has Europe’s highest TikTok creator density in 2026: 18.11 eligible profiles per 100 estimated users, 2.14 times the 8.48% benchmark. Thirteen of 30 European markets are above the benchmark; the median market density is 7.76%. Central and Eastern Europe has the highest regional density (12.06%), and remains highest at 10.02% without Romania.
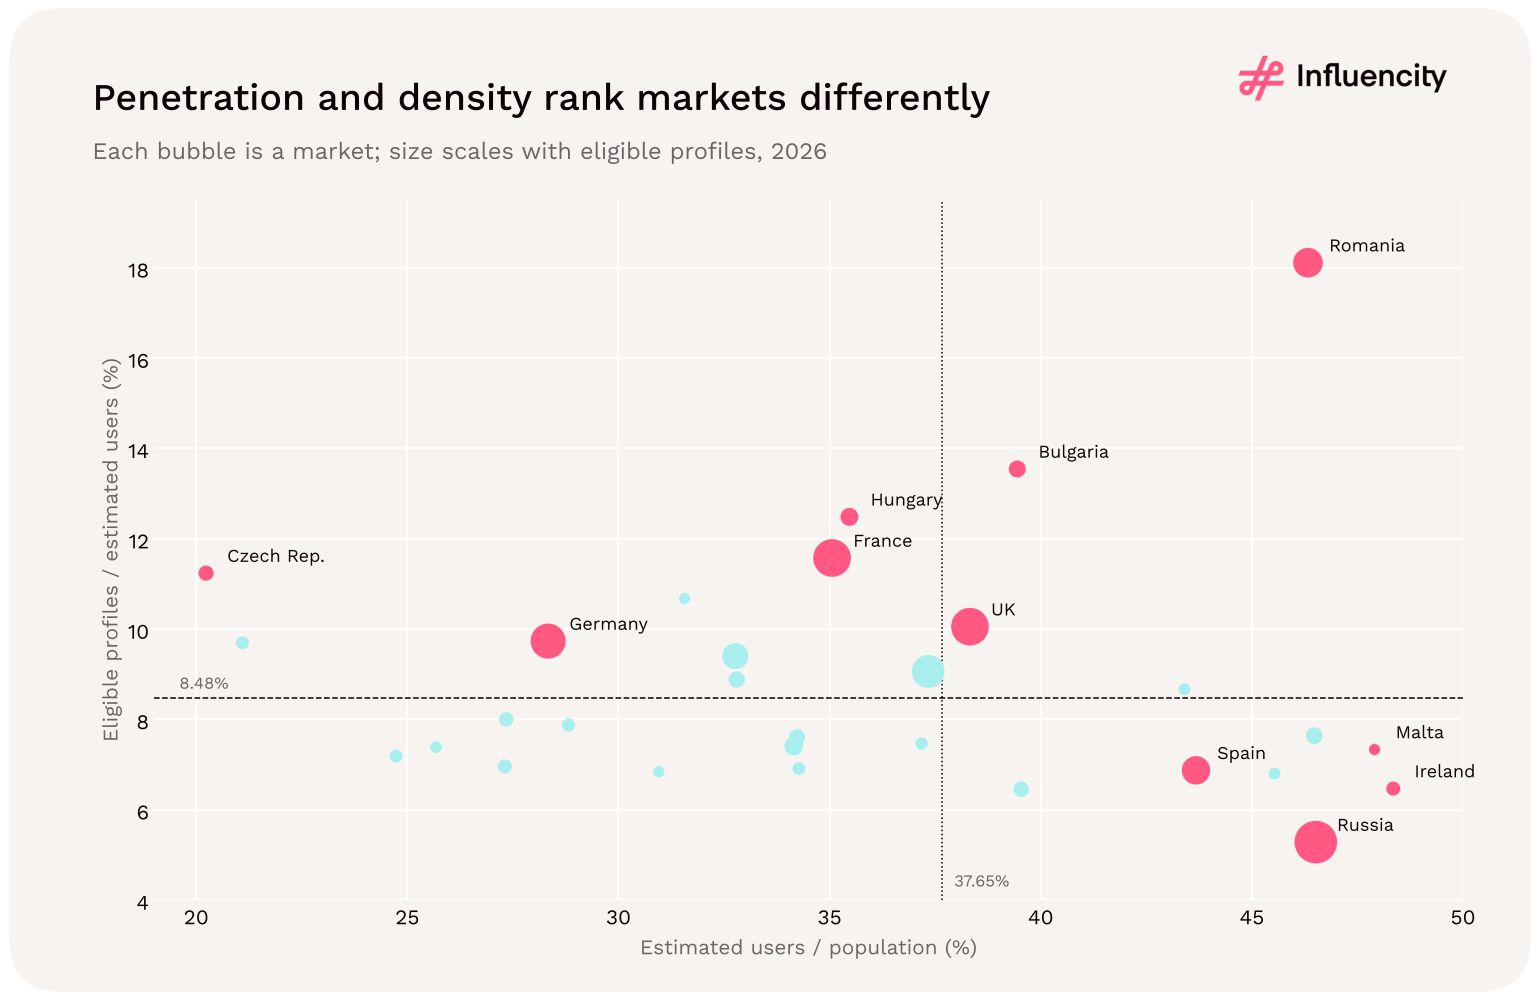
Ireland has the highest estimated users-to-population ratio, at 48.35%, followed by Malta at 47.90%. The regional ratio is 37.65%, below the US figure of 44.62%. These are contextual ratios constructed from Influencity's estimates, not independently measured resident adoption rates. [1, 4]
| Country | Estimated users | Users / population | Creator density |
|---|---|---|---|
| Ireland | 2,590,000 | 48.35% | 6.47% |
| Malta | 263,000 | 47.90% | 7.33% |
| Russia | 66,700,000 | 46.52% | 5.28% |
| Greece | 4,600,000 | 46.48% | 7.64% |
| Romania | 8,710,000 | 46.33% | 18.11% |
| Latvia | 836,000 | 45.54% | 6.80% |
| Spain | 20,900,000 | 43.68% | 6.87% |
| Cyprus | 600,000 | 43.40% | 8.67% |

Figure 10 → Audience penetration and creator density measure different relationships and should not be treated as synonyms. Source: [1].
Ireland combines the highest audience ratio with 6.47% density, below the regional 8.48%. Russia has a 46.52% audience ratio but only 5.28% density. Czech Republic illustrates the reverse: only 20.23% users relative to population, yet an 11.24% creator-to-user ratio. A high density value can reflect a smaller audience denominator as well as a large creator numerator. [1]
Across the 30 markets, the users-to-population ratio and creator density are not meaningfully related (Spearman rank correlation −0.23, not statistically clear). Splitting markets at the regional values (37.65% penetration, 8.48% density) gives four groups: [1]
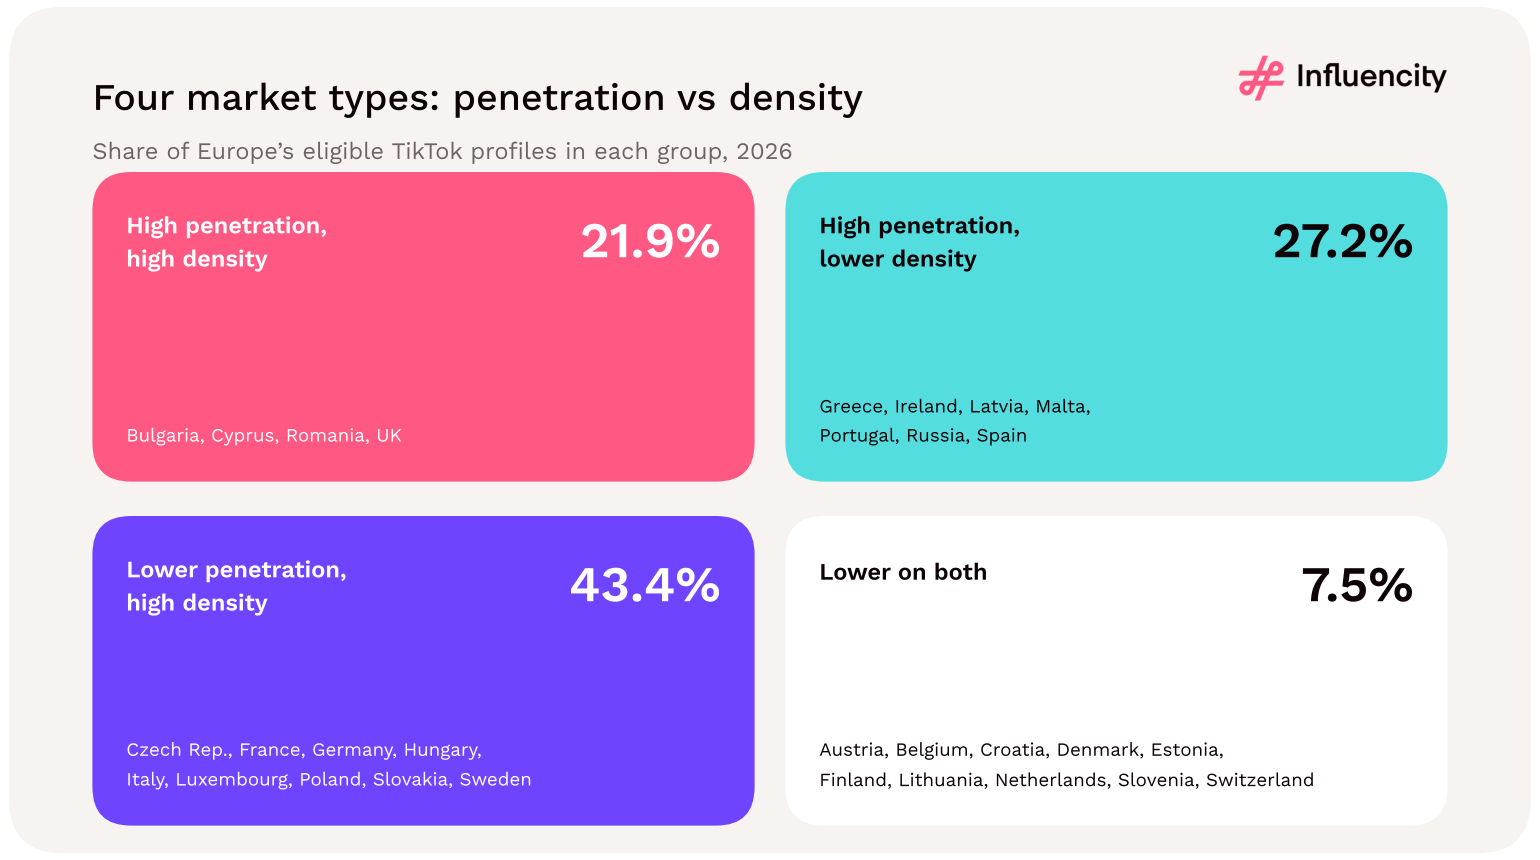
| Group | Markets | Share of profiles |
|---|---|---|
| High penetration, high density | Bulgaria, Cyprus, Romania, United Kingdom | 21.9% |
| High penetration, lower density | Greece, Ireland, Latvia, Malta, Portugal, Russia, Spain | 27.2% |
| Lower penetration, high density | Czech Republic, France, Germany, Hungary, Italy, Luxembourg, Poland, Slovakia, Sweden | 43.4% |
| Lower on both | Austria, Belgium, Croatia, Denmark, Estonia, Finland, Lithuania, Netherlands, Slovenia, Switzerland | 7.5% |
Source: [1]. Thresholds are the weighted regional ratios.

Figure 11 → Four market types by audience penetration and creator density, with each group’s share of eligible profiles. Source: [1].
Dividing estimated users by eligible profiles gives a market-level audience-per-creator ratio. It ranges from 5.5 in Romania to 18.9 in Russia; Portugal and Ireland are both at about 15.5. A high ratio describes a large audience relative to local creator supply; it is not the reach of any individual creator. [1]
What this means for campaign planning
High penetration, lower density (Ireland, Spain, Portugal, Greece): sizeable audiences relative to local creators. Widen the search to creators based elsewhere whose followers are verifiably in the market.
Lower penetration, high density (France, Germany, Italy, Poland, Czech Republic): plenty of creators relative to the estimated audience, so recruitment pools are deep, but check that each creator’s followers are local.
High on both (Romania, the UK, Bulgaria, Cyprus): the broadest combination of audience and creator supply in the footprint.
Therefore, Ireland has the highest estimated TikTok users-to-population ratio in Europe (48.35%) but below-benchmark creator density (6.47%). Across 30 European markets, audience penetration and creator density are not meaningfully related. Estimated users per eligible TikTok profile range from 5.5 in Romania to 18.9 in Russia.
Europe's TikTok creator market does not follow one pattern. Some countries are large but thin, some small but dense, and in some Instagram has almost as much creator supply as TikTok. The outliers below are the markets where the regional averages (8.48% creator density, 31.9 profiles per 1,000 residents) would mislead a planner most.
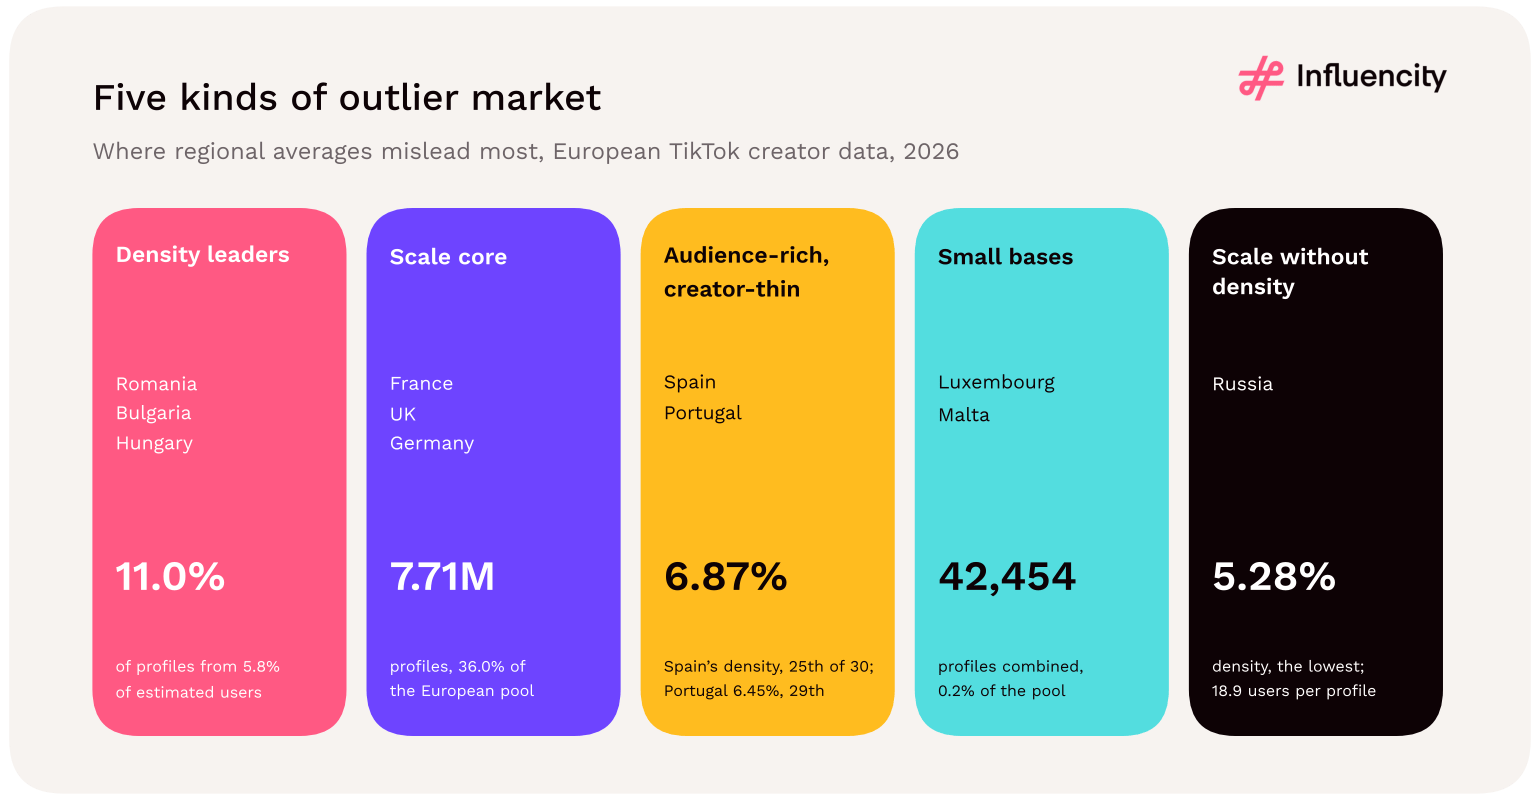
Romania, Bulgaria and Hungary have the most creators relative to their audiences. France, the UK and Germany combine scale with above-median density. Spain and Portugal have large audiences but thin TikTok creator supply relative to them, and comparatively strong Instagram supply. Luxembourg and Malta are too small to screen like larger markets. Russia is the largest pool but the least dense. [1, 2]
| Profile | Markets | What the data show | Planning hypothesis |
|---|---|---|---|
| Density leaders | Romania, Bulgaria, Hungary | 11.0% of profiles from 5.8% of estimated users; TikTok supply 5.3x to 7.3x Instagram’s | Broad local shortlists, mostly nano creators |
| Scale core | France, UK, Germany | 7.71M profiles (36.0% of the pool); 6,074 mega entries | Depth in every tier, but different gender and niche profiles |
| Audience-rich, creator-thin | Spain, Portugal | 6.87% and 6.45% density; Instagram supply level with or above TikTok’s | Plan TikTok and Instagram recruitment together |
| Small bases | Luxembourg, Malta | 42,454 profiles combined (0.2% of the pool) | Pools shrink fast once a brief is narrowed |
| Scale without density | Russia | 16.5% of profiles but 26.4% of estimated users | Recorded scale is not campaign readiness |
Source: [1, 2]. Mega entries = profiles with 1M+ followers.

Figure 12 → Five outlier profiles in the 2026 data, with one defining statistic for each. Source: [1].
These three markets have Europe's highest TikTok creator density, and they are the three most TikTok-heavy markets compared with Instagram. Romania records 1,577,542 eligible profiles at 18.11% density, more than twice the regional 8.48%. Bulgaria (356,203 profiles, 13.54%) and Hungary (424,432 profiles, 12.48%) rank second and third. Together they hold 11.0% of Europe's recorded TikTok creators but only 5.8% of its estimated TikTok users. [1]
Their TikTok-to-Instagram ratios are the highest in the study: Romania records 7.33 TikTok profiles for every Instagram profile, Bulgaria 5.87 and Hungary 5.34, against 1.72 across the 30 markets. On these counts, TikTok is the main influencer platform in all three. [1, 2]
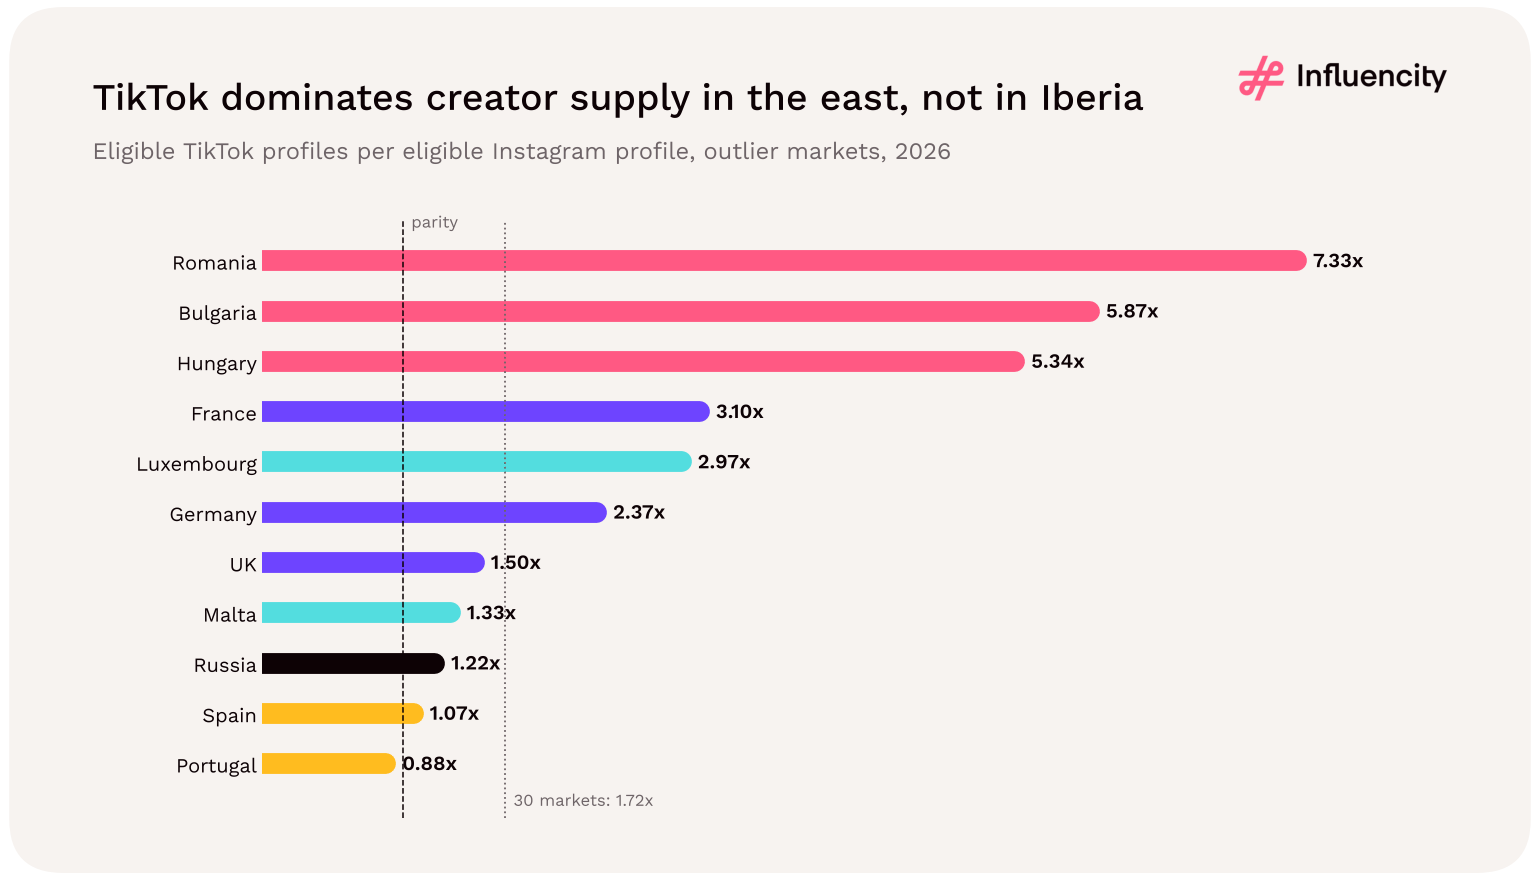
Figure 13 → TikTok-to-Instagram profile multiple for the outlier markets; below 1.00x, Instagram records more eligible profiles. Profiles are not deduplicated people. Sources: [1, 2].
The density sits mostly at the base of the pyramid. Only 6.58% of Romania's tier entries have 10k+ followers, and 5.47% in Bulgaria and 6.29% in Hungary, against 10.0% in the 29-market tier view. Romania is the partial exception: relative to its audience it has as many 10k+ creators per user as the UK (1.19 per 100 users), behind only France, and it records 178 mega entries. Bulgaria (0.74) and Hungary (0.78) sit below the regional figure of about 0.85, with 8 and 19 mega entries. Romania's signature niche is beauty (index 114; section 13). [1]
Broad screening should return large local shortlists, especially at nano and micro level. Test it with category, language, content-recency and audience-location filters, and do not assume that plentiful profiles mean plentiful suitable, low-cost or available partners.
These three markets hold 7.71M recorded profiles, 36.0% of the European pool, and 29.3% of estimated users. All three are above the 30-market median density (7.76%), and all three rank among the five largest markets for mega entries: UK 2,467, France 2,096, Germany 1,511. Beyond scale, they differ on almost every measure. [1]
France has the highest density of the five largest pools (11.57%) and the most 10k+ creators relative to its audience (1.35 per 100 users). Its TikTok supply is 3.10 times its Instagram supply, and its signature niche is tech & gaming (index 117). [1, 2]
The UK has the largest estimated TikTok audience outside Russia (26.8M users), the highest share of tier entries with 10k+ followers (11.81%) and the highest female share of classified profiles (60.89%). It also has a strong Instagram supply (1.79M profiles), so TikTok leads by only 1.50x. Wellness dominates its niche mix (index 216, the strongest single-market skew in the study). [1, 2]
Germany has the lowest estimated audience penetration of the three (28.3% of residents, against 37.65% regionally) and a male-majority creator base (49.44% female among classified profiles). Its signature niche is also wellness (index 115). [1]
A single "big three" brief will fit unevenly. Apply the same quality requirements in each market, then compare the number of suitable, responsive creators per market rather than the number of profiles.
Spain and Portugal have large TikTok audiences relative to their populations but thin TikTok creator supply relative to those audiences. Spain's estimated users equal 43.68% of its population, well above the 37.65% regional figure, yet its 1,436,110 profiles give only 6.87% density, 25th of 30 markets, or about 14.6 estimated users per profile. Portugal (265,210 profiles, 6.45%) is 29th, ahead of only Russia. [1]
Spain's thin base hides a strong top end. 11.75% of its tier entries have 10k+ followers, second only to the UK, and its 1,715 mega entries are the fourth-highest count in Europe (82 per million estimated users, against 53 regionally). Spain is also the only market where fashion is the largest niche, and it has the highest travel share of the seven niche markets (section 13). [1]
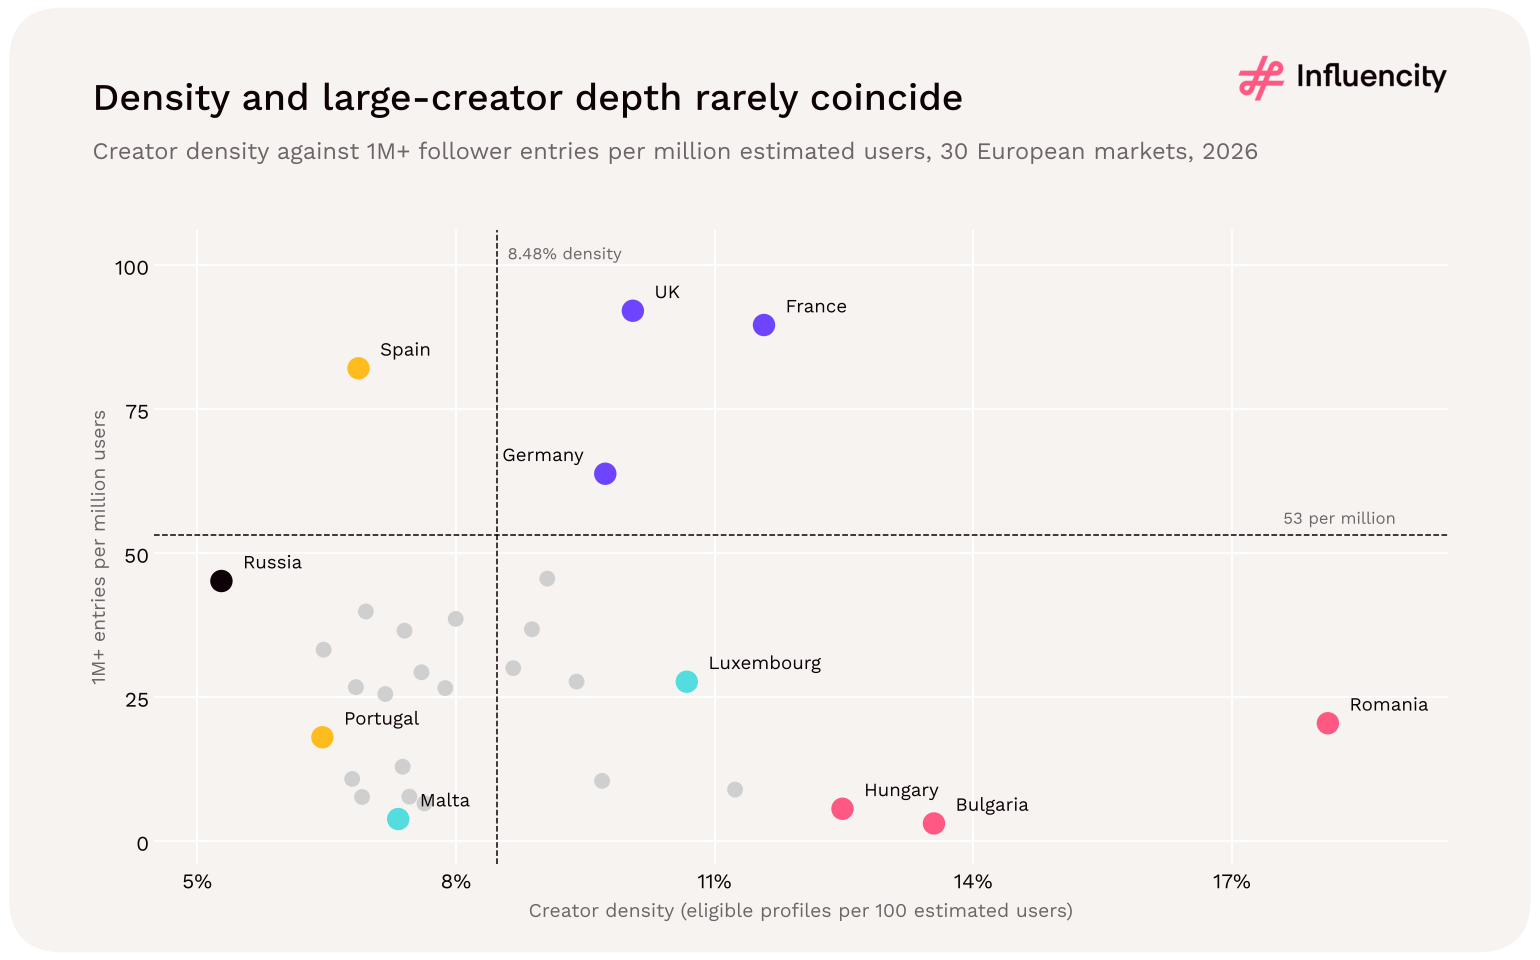
Figure 14 → Creator density against mega entries (1M+ followers) per million estimated users. Dashed lines mark the regional figures of 8.48% and 53 per million. Austria is plotted for its mega count; the 53 per million regional line covers the 29-market tier view. Source: [1].
Instagram changes the picture again. Spain records 1,340,770 Instagram profiles, so TikTok leads by only 1.07x. Portugal is the only covered market where Instagram records more eligible profiles than TikTok: 302,624 against 265,210. [1, 2]
A TikTok-only recruitment plan may leave much of the creator supply in these markets untouched. Screen both platforms; in Spain, expect a shorter list of larger creators than the audience size suggests.
These are the two smallest recorded pools: 23,171 profiles in Luxembourg and 19,283 in Malta, together 0.2% of the European total. Their ratios look strong. Luxembourg's density (10.68%) ranks sixth, and Malta's estimated penetration (47.9% of residents) is second only to Ireland's. The absolute numbers are small: Luxembourg records 6 mega entries and Malta 1, and Luxembourg's classified creators are male-majority (39.75% female). [1]
These markets may suit localised activations or cross-border briefs. Before committing, filter by category, language, audience location and brand conflicts, because the addressable pool can fall to a few dozen creators. In multilingual markets, check which language each creator's audience actually uses.
Russia is the largest recorded market and the least creator-dense. Its 3,523,007 profiles are 16.5% of the European pool, but its 66.7M estimated users are 26.4% of the region's audience. That gives 5.28% density, about 18.9 estimated users per profile, the thinnest supply in the study. [1]
The upper tiers are deep: 11.61% of tier entries have 10k+ followers, and Russia records 3,010 mega entries, the most in Europe. Tech & gaming is a third of its niche tags (index 142). However, 31.6% of Russian profiles have no gender classification, the highest share of any market, and its recorded count is about 5% below the roughly 3.7M reported in 2023, while the European total rose about 43% (section 14). [1, 3]
Russia's count describes recorded supply, not a ready-to-recruit inventory. Apply current availability, audience-location, content-recency, payment and compliance checks before including it, or any other market, in a live campaign plan.
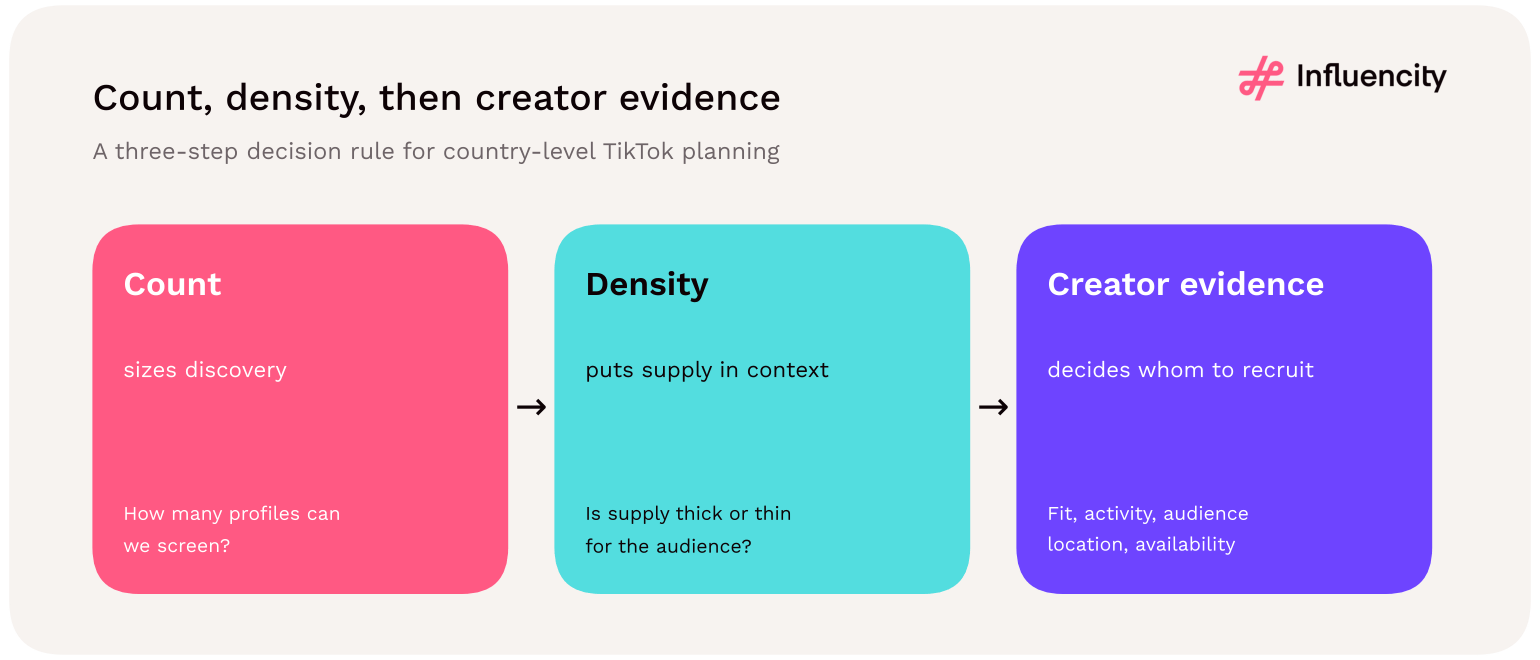
Use absolute count to size discovery, density to put supply in context, and creator-level evidence to decide whom to recruit. A country average does not replace creator vetting. Each metric answers one planning question and leaves another open:
| Planning question | Metric to use | What it cannot tell you |
|---|---|---|
| How many profiles can we screen? | Eligible profiles | How many are suitable or available |
| Is supply thick or thin for the audience? | Creator density (profiles ÷ estimated users) | Fees, quality or competition for creators |
| How large is the potential audience? | Estimated users and penetration | Who the audience is or where it is located |
| Can we find larger creators? | 10k+ share and mega entries | Engagement or reach of individual creators |
| Should TikTok lead recruitment? | TikTok-to-Instagram profile multiple | Which platform performs better |
Source: [1, 2].

Figure 15 → A three-step rule for using country figures in TikTok campaign planning. Analytical framework, not a performance model.
What this means for campaign planning
Plan Europe country by country: density runs from 5.28% (Russia) to 18.11% (Romania), a 3.4-fold spread that a regional average hides.
In the dense eastern markets, expect large nano-led shortlists; in Spain and Russia, expect fewer creators per user but strong upper tiers.
Check Instagram supply in Spain, Portugal and the UK before planning a TikTok-only campaign.
In small markets, size the pool after applying the brief’s filters, not before.
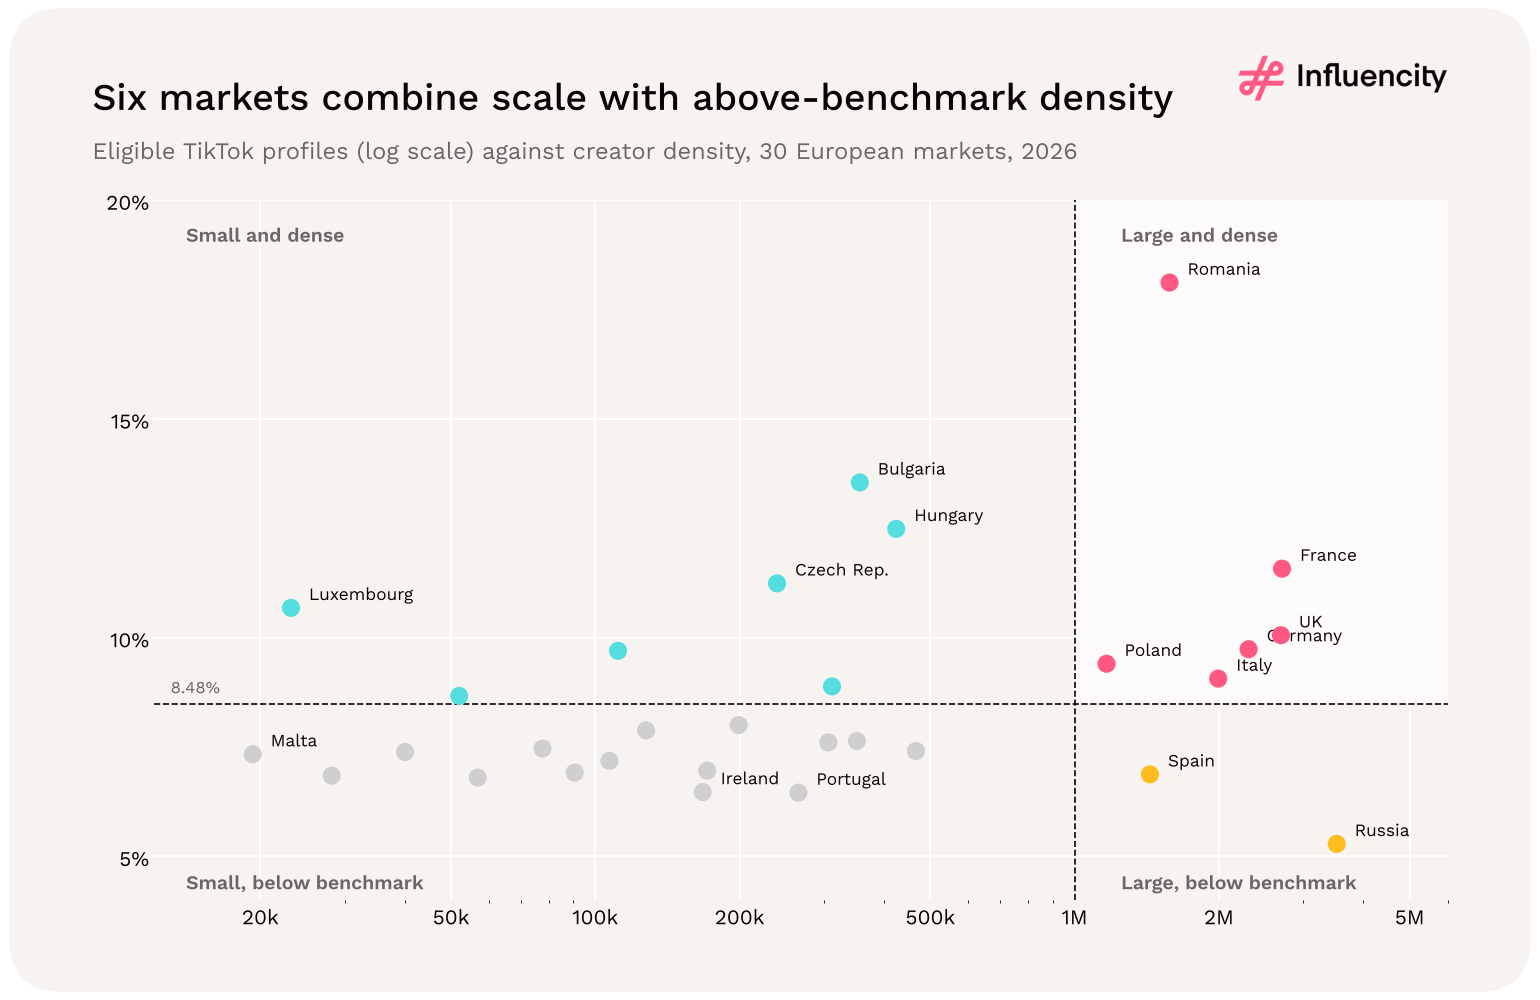
Combining absolute size (one million or more eligible profiles) with density (above or below 8.48%) sorts the 30 markets into four archetypes. They are a planning shorthand, not a performance ranking. [1]
| Archetype | Markets | Profiles | Users | Density | Suggested role |
|---|---|---|---|---|---|
| Large and dense | France, Germany, Italy, Poland, Romania, UK | 58.2% | 46.4% | 10.64% | Default starting point for scale |
| Large, below benchmark | Russia, Spain | 23.2% | 34.7% | 5.66% | Audience-led; widen the creator search |
| Small and dense | Bulgaria, Cyprus, Czech Rep., Hungary, Luxembourg, Slovakia, Sweden | 7.1% | 5.4% | 11.13% | Local test markets |
| Small, below benchmark | 15 markets, incl. Netherlands, Belgium, Greece, Portugal, Ireland | 11.6% | 13.5% | 7.26% | Targeted or cross-border recruitment |
Source: [1]. Shares of the regional total; density is the group’s weighted ratio. Small, below benchmark: Austria, Belgium, Croatia, Denmark, Estonia, Finland, Greece, Ireland, Latvia, Lithuania, Malta, Netherlands, Portugal, Slovenia, Switzerland.

Figure 16 → Market archetypes by creator-pool size and density. Thresholds: 1M profiles and 8.48% density. Source: [1].
A consumer brand planning a TikTok launch in France, Germany, Spain, Poland and Romania could read the study like this.
| Market | Profiles | Density | Female, classified | 10k+ share | Planning angle |
|---|---|---|---|---|---|
| France | 2,708,112 | 11.57% | 52.9% | 11.6% | Deep, mixed-tier pool; anchor market |
| Germany | 2,306,700 | 9.73% | 49.4% | 10.8% | Balanced gender mix; low penetration, so verify local reach |
| Spain | 1,436,110 | 6.87% | 59.7% | 11.8% | Larger-creator lean; run Instagram alongside (1.07x) |
| Poland | 1,165,571 | 9.40% | 58.9% | 7.9% | Strong TikTok lead (3.16x); micro-led roster |
| Romania | 1,577,542 | 18.11% | 51.9% | 6.6% | Densest pool; test nano/micro at volume |
Hold the offer, measurement window and audience criteria constant across the five markets, and compare the number of qualified creators and outcomes per market, not raw profile counts.
Five common planning mistakes to avoid
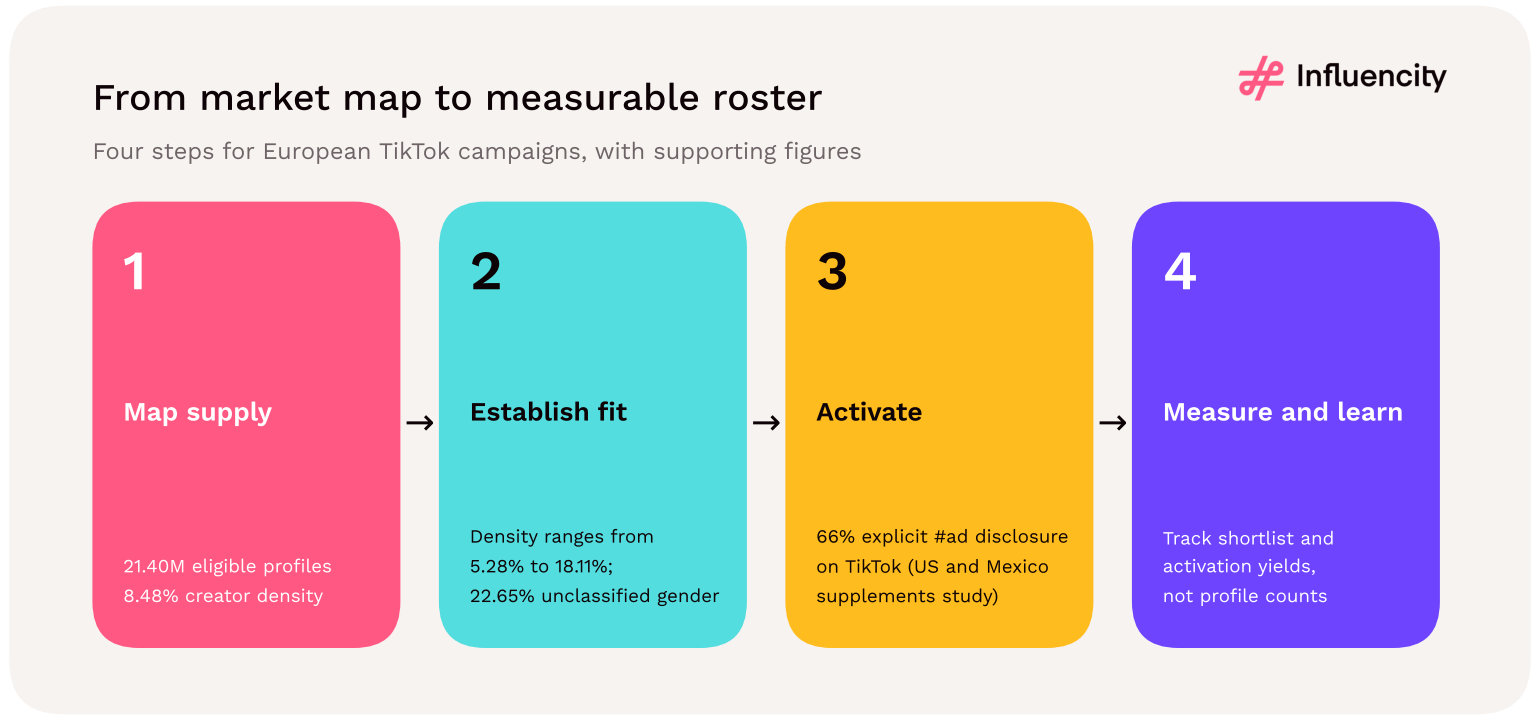
1. Treating 21.40M eligible profiles as 21.40M available partners.
2. Using the regional 8.48% density as a local rule: the country range is 5.28% to 18.11%.
3. Translating one regional brief instead of localising concept, script and claims per market.
4. Assuming TikTok-first everywhere: Portugal, Spain and Italy have Instagram pools of similar size.
5. Carrying US gender or tier assumptions into Europe without checking country data.
In conclusion, six European markets are both large (1M+ eligible TikTok profiles) and above the 8.48% density benchmark: France, Germany, Italy, Poland, Romania and the UK, with 58.2% of profiles. Russia and Spain are the only large markets below the benchmark. Romania, Bulgaria and Hungary hold 11.0% of recorded profiles but only 5.8% of estimated users, and have the highest TikTok-to-Instagram multiples (5.3x to 7.3x). Spain ranks 25th of 30 on density but has Europe's fourth-largest count of mega entries; Portugal is the only market where Instagram records more creators than TikTok.
Use country figures to decide where to look; use creator-level evidence to decide whom to recruit.
TikTok has 8,992,408 more eligible profiles than Instagram in the same 30-country footprint, despite an estimated audience that is 42,163,100 smaller. The arithmetic supports a larger recorded discovery universe and roughly twice the creator density, not a conclusion that either platform delivers better campaign results. [1, 2]
| Metric | TikTok | |
|---|---|---|
| Estimated users | 252,341,000 | 294,504,100 |
| Eligible profiles | 21,397,089 | 12,404,681 |
| Creator density | 8.48% | 4.21% |
| Users / population | 37.65% | 43.94% |
| Female share, classified | 54.43% | 59.84% |
| No-gender share, all profiles | 22.65% | 31.56% |

Figure 17 → TikTok has 72.5% more profiles and 14.3% fewer estimated users; the density ratio is 2.01x. Sources: [1, 2].
The comparison aligns countries and population references. Observation windows, eligibility rules and user-estimate definitions should also match before the difference is treated as a fully harmonised platform benchmark. Excluding Russia from both platforms gives 9.63% TikTok density and 4.13% Instagram density, a 2.33x ratio. [1, 2]
Outside Europe, Influencity's supplements study (US and Mexico, 2025) found Instagram ahead of TikTok on positive comment sentiment (68% vs 58%) and explicit #ad disclosure (78% vs 66%); TikTok's positive-sentiment share was still above YouTube's (51%). Whether those platform differences hold in European markets is untested. [7]
TikTok's 8,992,408-profile lead over Instagram is concentrated. France contributes 1,834,461 additional profiles, Romania 1,362,441 and Germany 1,333,838: together 50.4% of the gap. The UK (+903,696) and Poland (+797,203) follow. Portugal is the only market where Instagram records more eligible profiles (−37,414). [1, 2]
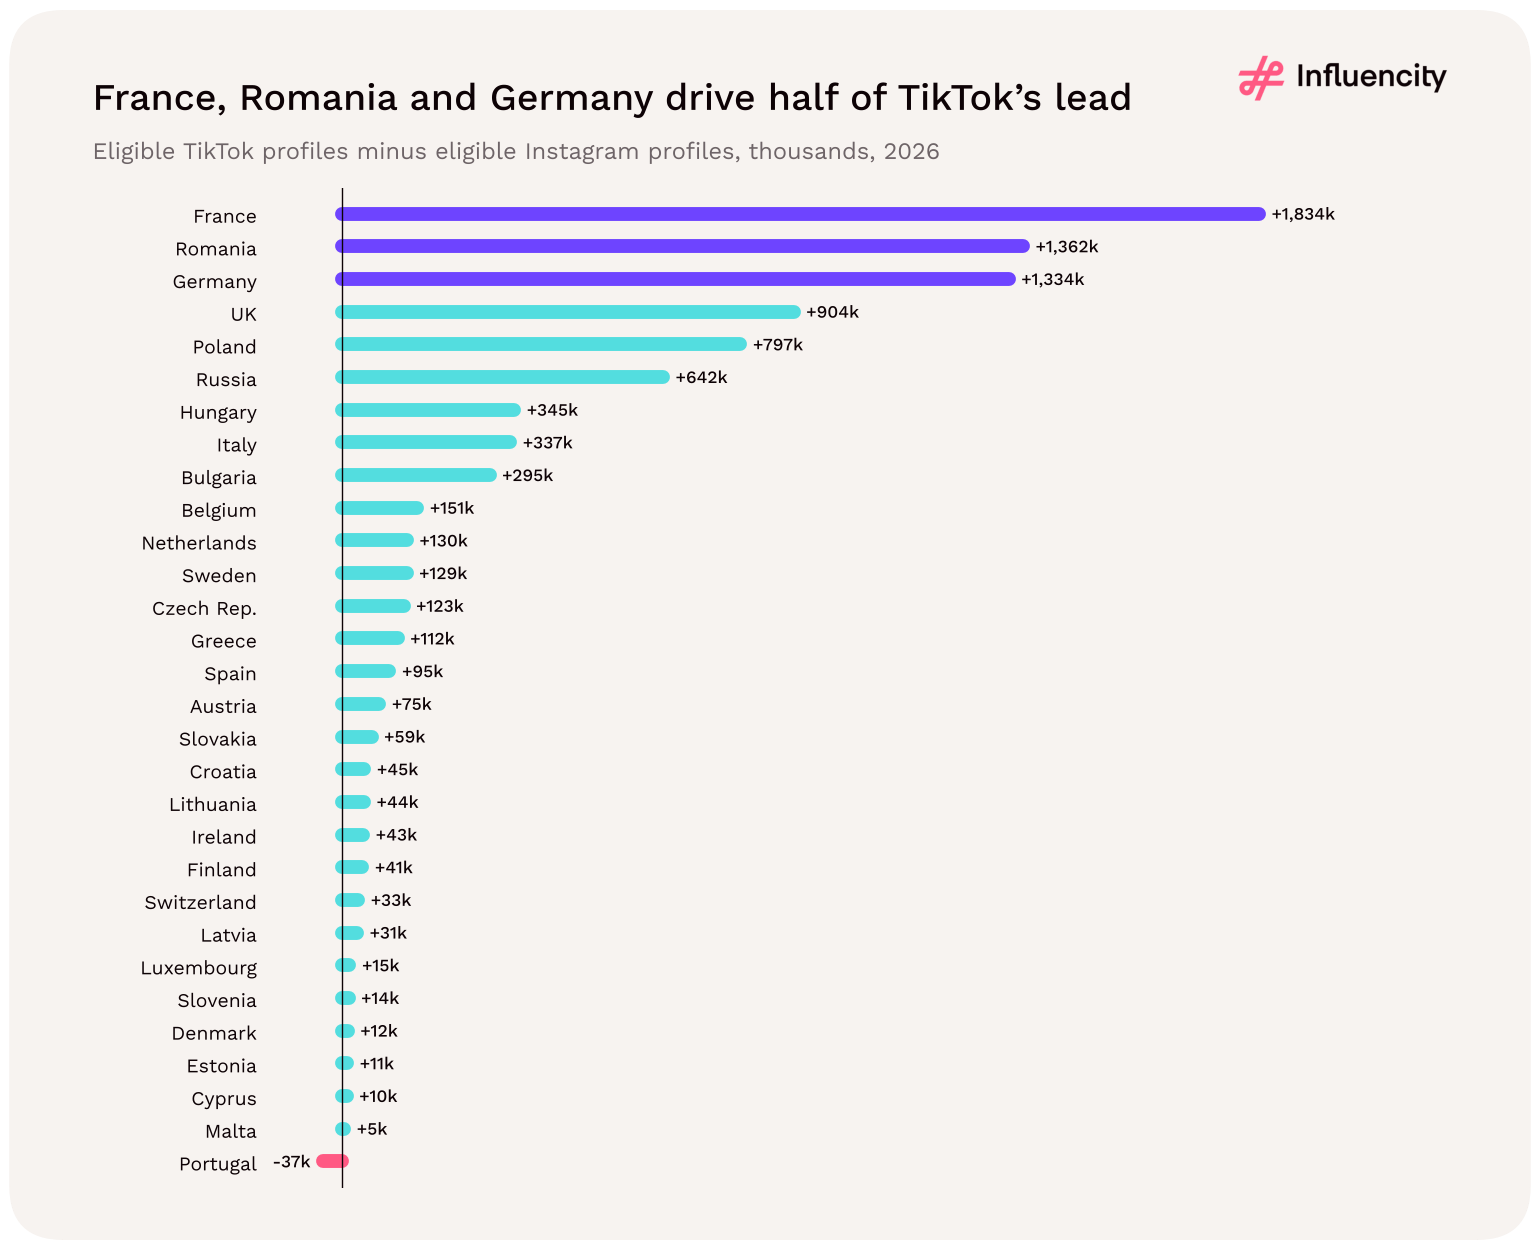
Figure 18 → Additional TikTok eligible profiles compared with Instagram, by country. Profiles are not deduplicated people. Sources: [1, 2].
By region, TikTok's profile lead is largest in Central and Eastern Europe (4.01 times Instagram's count) and smallest in Southern Europe (1.14x) and Russia (1.22x). Western Europe sits at 2.00x and the Nordics at 1.50x. Southern Europe is the part of the footprint where Instagram creator supply most closely matches TikTok's. [1, 2]
| Region | TikTok profiles | Instagram profiles | TikTok ÷ Instagram |
|---|---|---|---|
| Central & Eastern | 4,167,871 | 1,040,592 | 4.01x |
| Western | 9,042,699 | 4,523,426 | 2.00x |
| Nordic | 546,389 | 363,897 | 1.50x |
| Russia | 3,523,007 | 2,880,629 | 1.22x |
| Southern | 4,117,123 | 3,596,137 | 1.14x |
Sources: [1, 2]. Regional groupings defined in section 21.
Plan Southern Europe as two-platform markets
In Spain (1.07x), Portugal (0.88x), Italy (1.20x) and Cyprus (1.23x), Instagram’s creator pool is close to TikTok’s. Build parallel shortlists and let each brief’s objective decide the split, rather than defaulting to TikTok.
Across 30 European markets, TikTok records 72.5% more eligible profiles than Instagram in 2026 and about twice the creator density (8.48% vs 4.21%). France, Romania and Germany account for half of TikTok’s 8.99M-profile lead over Instagram. TikTok’s lead is largest in Central and Eastern Europe (4.01x) and smallest in Southern Europe (1.14x).
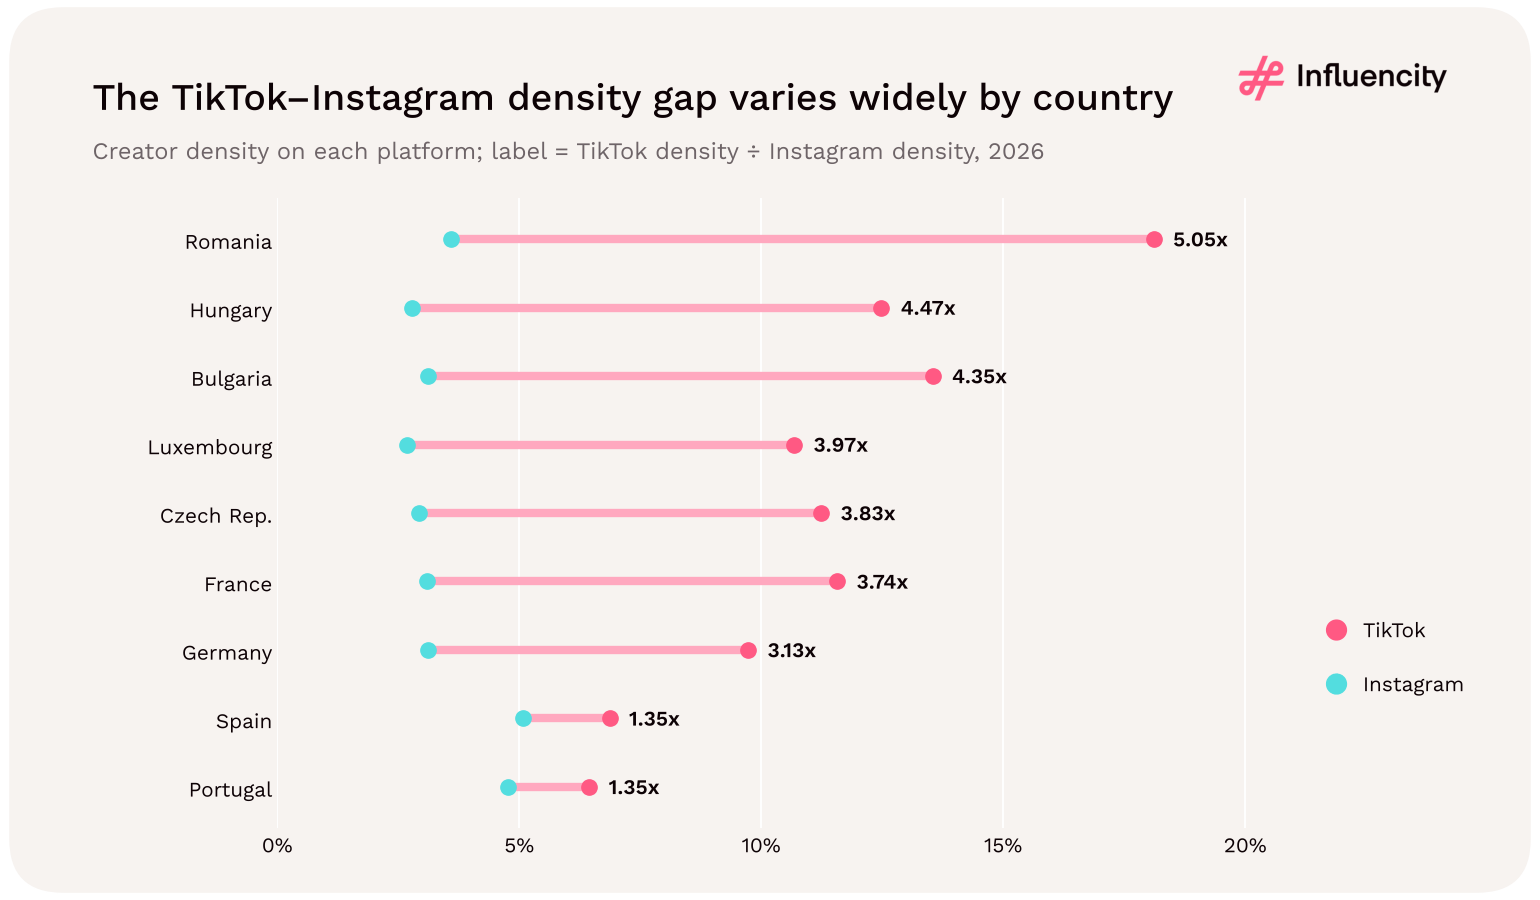
TikTok has a higher creator-density ratio than Instagram in every covered country, and more eligible profiles in 29 of the 30. Romania has the largest density multiple, at 5.05x. Portugal is the exception on absolute creator count, not on density. [1, 2]
| Country | TikTok density | Instagram density | Density multiple | Profile multiple |
|---|---|---|---|---|
| Romania | 18.11% | 3.59% | 5.05x | 7.33x |
| Hungary | 12.48% | 2.79% | 4.47x | 5.34x |
| Bulgaria | 13.54% | 3.11% | 4.35x | 5.87x |
| Luxembourg | 10.68% | 2.69% | 3.97x | 2.97x |
| Czech Republic | 11.24% | 2.93% | 3.83x | 2.07x |
| France | 11.57% | 3.10% | 3.74x | 3.10x |
| Germany | 9.73% | 3.11% | 3.13x | 2.37x |
| Spain | 6.87% | 5.08% | 1.35x | 1.07x |
| Portugal | 6.45% | 4.77% | 1.35x | 0.88x |

Figure 19 → Platform-density differences vary widely by country; the regional 2.01x ratio is not a universal local rule. Sources: [1, 2].
Portugal has 265,210 eligible TikTok profiles compared with 302,624 on Instagram, but its TikTok audience estimate is also smaller: 4.11M versus 6.35M. Its TikTok density is therefore higher even though its absolute creator pool is smaller. Treat platform selection as a country-and-category decision. [1, 2]
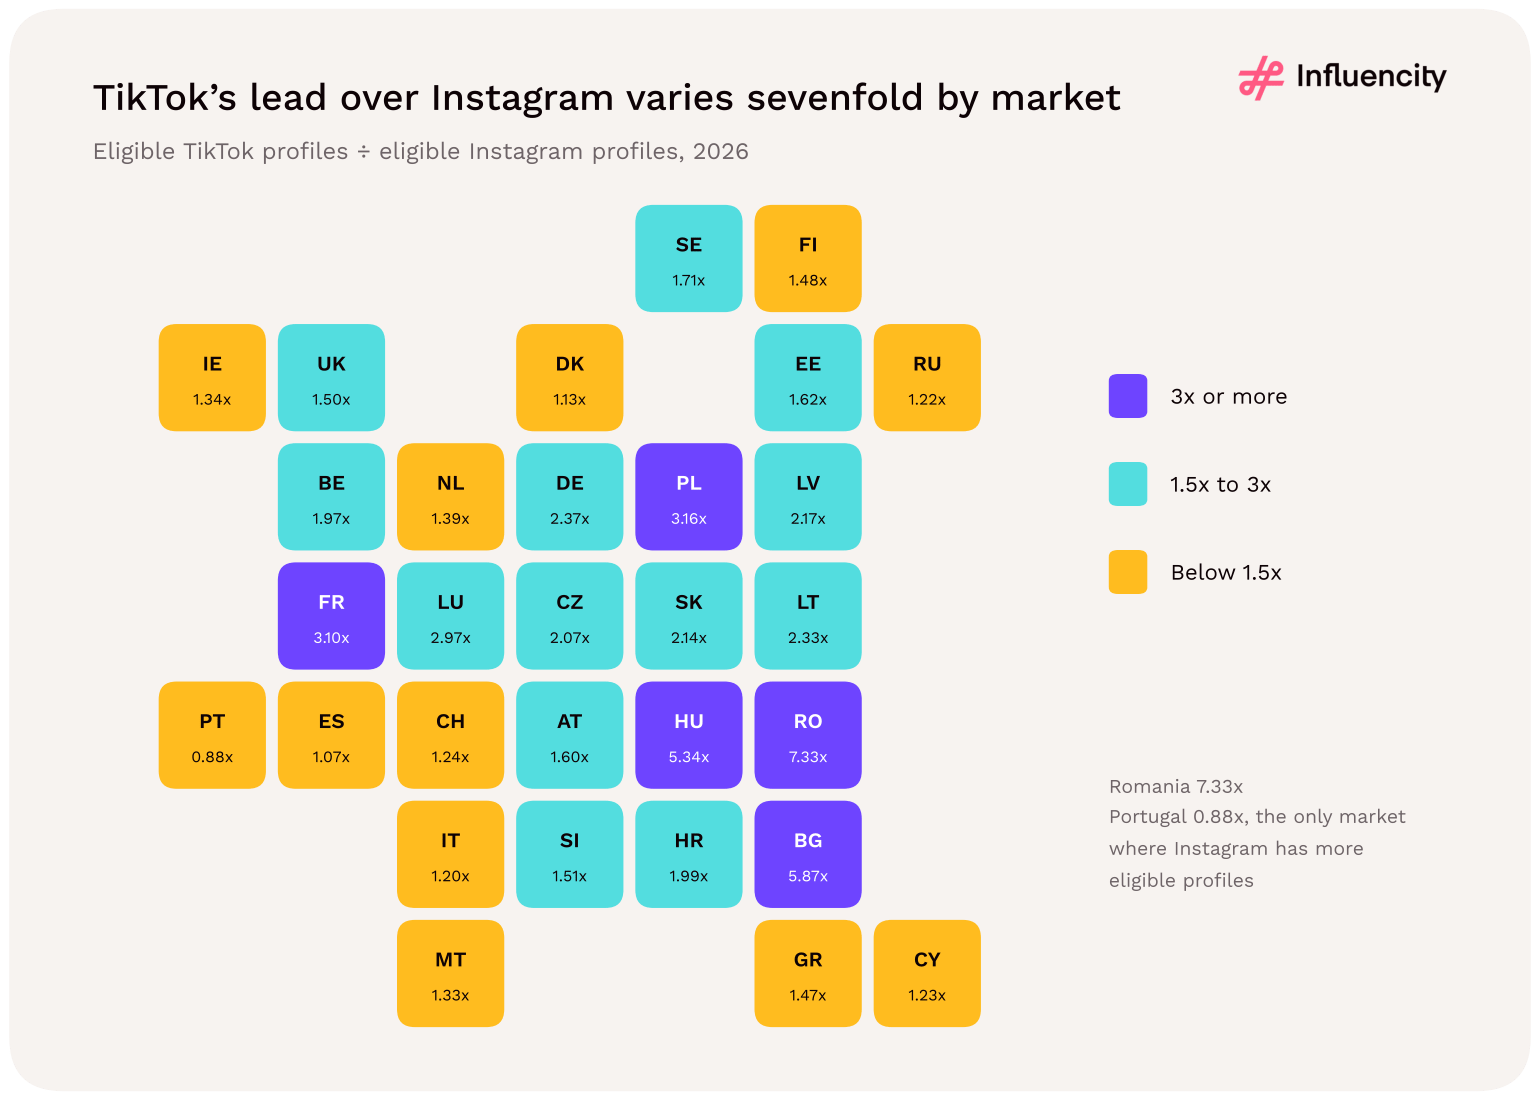
| TikTok ÷ Instagram profiles | Markets | Share of TikTok pool | Planning implication |
|---|---|---|---|
| 3x or more | Romania, Bulgaria, Hungary, Poland, France | 29.1% | TikTok-led discovery; Instagram as a supporting channel |
| 1.5x to 3x | Luxembourg, Germany, Lithuania, Latvia, Slovakia, Czech Rep., Croatia, Belgium, Sweden, Estonia, Austria, Slovenia, UK | 30.3% | TikTok-first, with a parallel Instagram shortlist |
| Below 1.5x | Finland, Greece, Netherlands, Ireland, Malta, Switzerland, Cyprus, Russia, Italy, Denmark, Spain, Portugal | 40.6% | Genuine two-platform markets; choose by objective |
Sources: [1, 2]. Profile multiples from Appendix D.

Figure 20 → TikTok-to-Instagram profile multiple by market. Sources: [1, 2].
TikTok’s creator density exceeds Instagram’s in all 30 covered European markets in 2026. Romania has the largest TikTok-to-Instagram profile multiple (7.33x); Portugal is the only market where Instagram has more eligible profiles (0.88x). In 12 markets holding 40.6% of the TikTok pool, Instagram’s creator pool is at least two-thirds the size of TikTok’s.
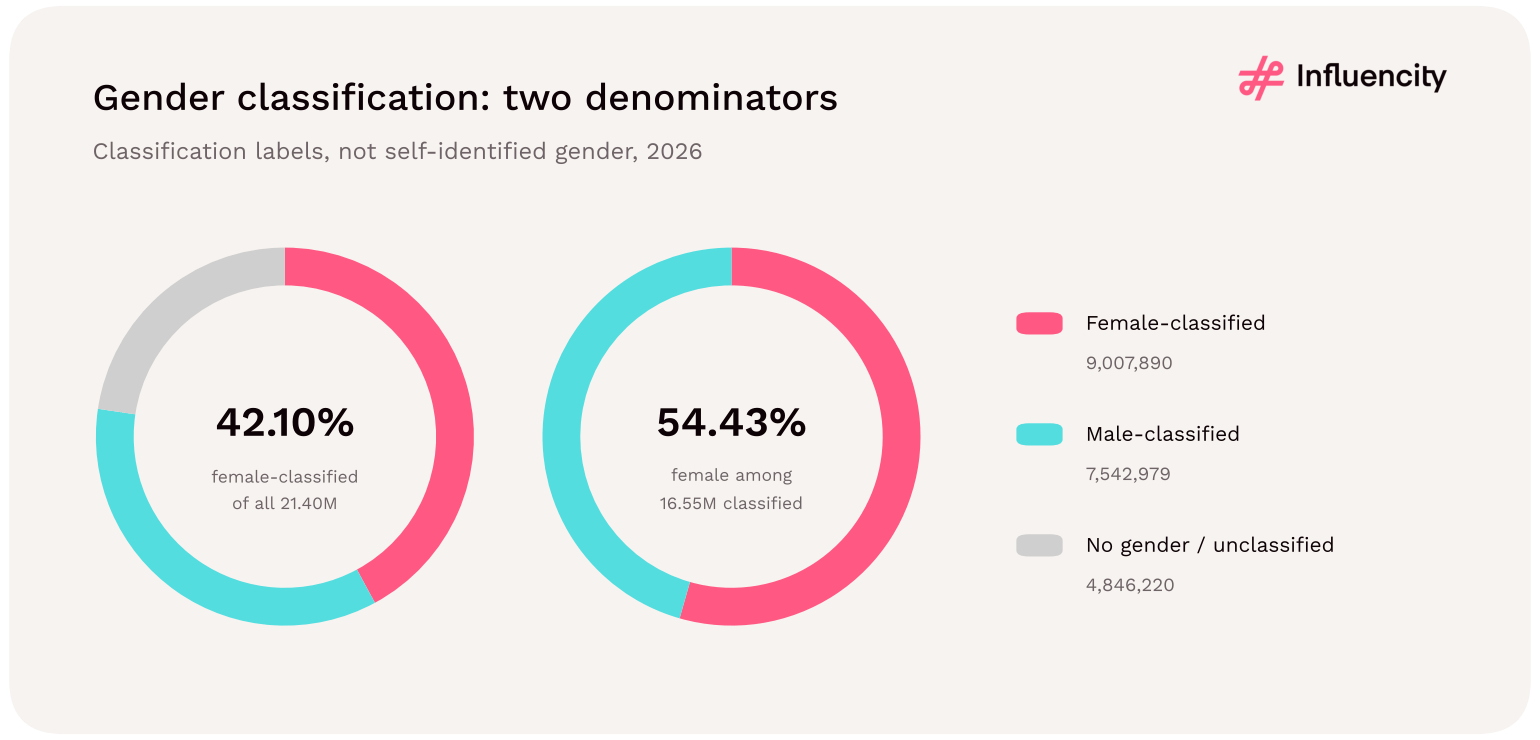
Female-classified profiles represent 54.43% of classified male/female profiles, well below the US TikTok figure of 63.1%. That figure excludes 4,846,220 profiles in the no-gender category, 22.65% of all eligible profiles. [1, 4]
| Category | Profiles | Share of all profiles | Share of classified |
|---|---|---|---|
| Female-classified | 9,007,890 | 42.10% | 54.43% |
| Male-classified | 7,542,979 | 35.25% | 45.57% |
| No gender / unclassified | 4,846,220 | 22.65% | Excluded |
| All eligible profiles | 21,397,089 | 100.00% | Not the denominator |

Figure 21 → Classified-only proportions do not describe the gender of all eligible profiles or of TikTok users. Source: [1].
These are profile-classification fields, not a survey of self-described gender identity. Unclassified records must not be treated as a measured non-binary population, nor reassigned to male or female. Creator gender is also not follower gender; use the classification findings descriptively, not as a substitute for audience analysis.
There are about 1.19 female-classified profiles for every male-classified one in European TikTok, against about 1.71 in the US TikTok data. In a set of 100 profiles in the same proportions as the regional pool, about 42 would be female-classified, 35 male-classified and 23 unclassified. Quoting 54% female without the denominator would overstate the female share of all profiles by about 12 points. [1, 4]
The female share of classified profiles is similar across the regional groups: 55.8% in Southern Europe, 55.2% in CEE, 54.4% in Western Europe, 54.3% in the Nordics and 51.4% in Russia. The real variation is at country level, from 39.75% in Luxembourg to 60.89% in the UK. Gender balance is also unrelated to creator density across the 30 markets (rank correlation −0.08). [1]
In Influencity’s 2026 TikTok Europe data, 54.43% of male- or female-classified creator profiles are female, against 63.1% in the US. Female-classified profiles are 42.10% of all eligible profiles; 22.65% have no gender classification. Gender varies far more between countries (39.75% to 60.89% female) than between regional groups.
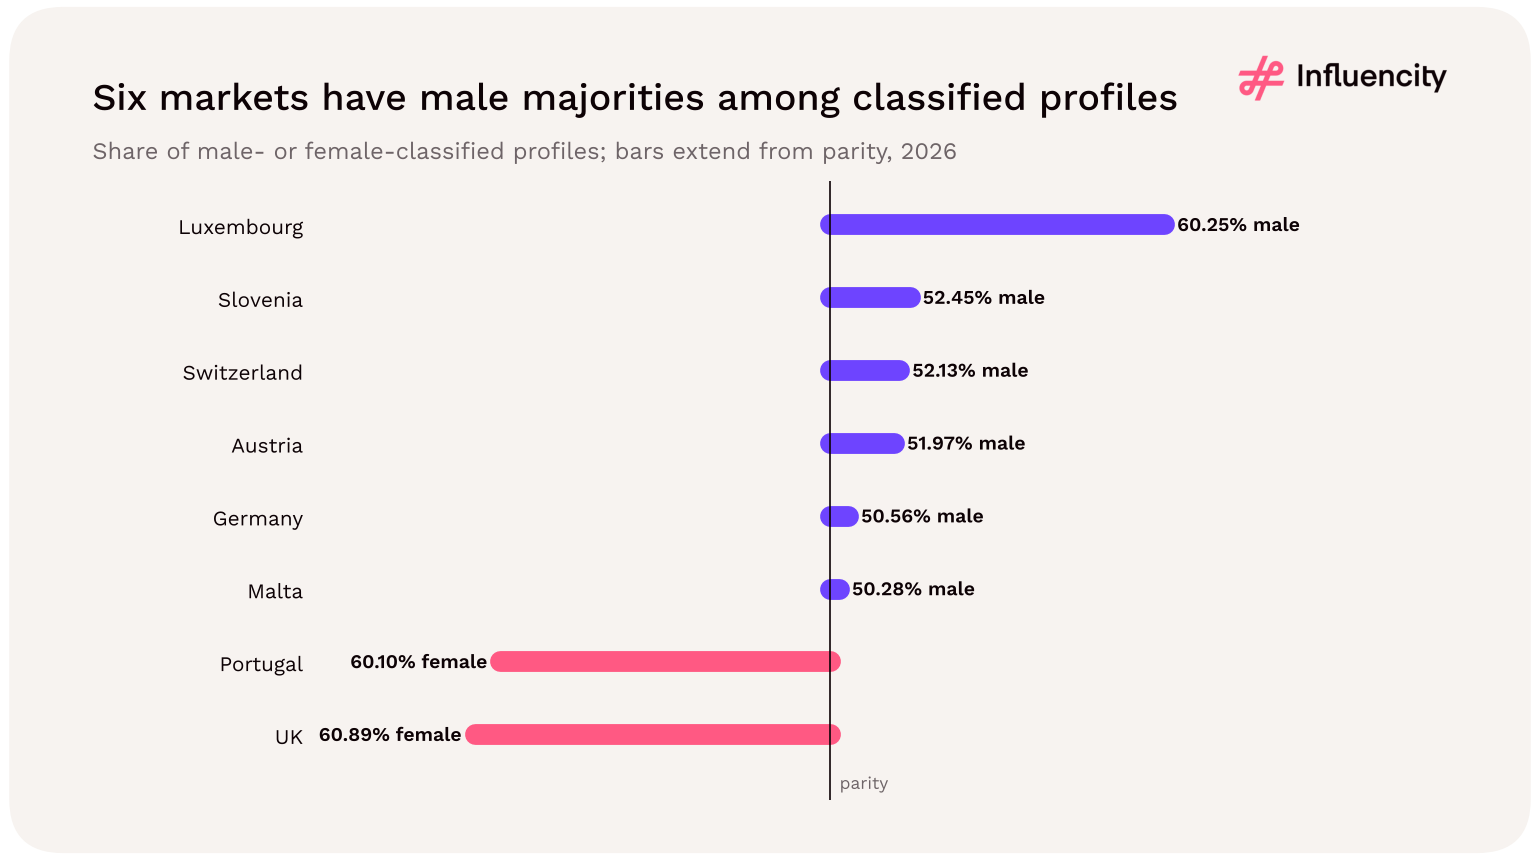
Twenty-four country totals have female majorities among classified profiles; six have male majorities. Luxembourg has the largest male share, 60.25%. Malta is much closer to parity: 8,489 male-classified profiles versus 8,394 female-classified, a difference of only 95. [1]
| Male-majority country | Male share, classified | Female share, classified | Unclassified, all profiles |
|---|---|---|---|
| Luxembourg | 60.25% | 39.75% | 19.36% |
| Slovenia | 52.45% | 47.55% | 24.64% |
| Switzerland | 52.13% | 47.87% | 20.19% |
| Austria | 51.97% | 48.03% | 21.19% |
| Germany | 50.56% | 49.44% | 22.85% |
| Malta | 50.28% | 49.72% | 12.45% |

Figure 22 → Country exceptions are descriptive; the data do not establish causes or statistical significance. Source: [1].
The UK has the highest female share among classified country profiles, at 60.89%, followed by Portugal at 60.10% and Spain at 59.71%; even the UK is below the US national figure of 63.1%. No-gender records range from 12.45% of all profiles in Malta to 31.63% in Russia. [1, 4]
Available mega-tier records contain 6,021 male-classified and 4,756 female-classified entries: 55.87% male among classified mega entries. The same reversal appears in US TikTok (52.4% male) and European Instagram (55.5% male), but not in US Instagram (near parity). This is a tier-level finding, not a conclusion about earnings or campaign effectiveness. [1, 4–6]
Four of the six male-majority markets are German-speaking or partly German-speaking: Germany, Austria, Switzerland and Luxembourg. Combined, the DACH markets (Germany, Austria and Switzerland) are 49.2% female among classified profiles. The six male-majority markets together hold 2,759,526 profiles, 12.9% of the regional pool, so this is not a marginal pattern. [1]
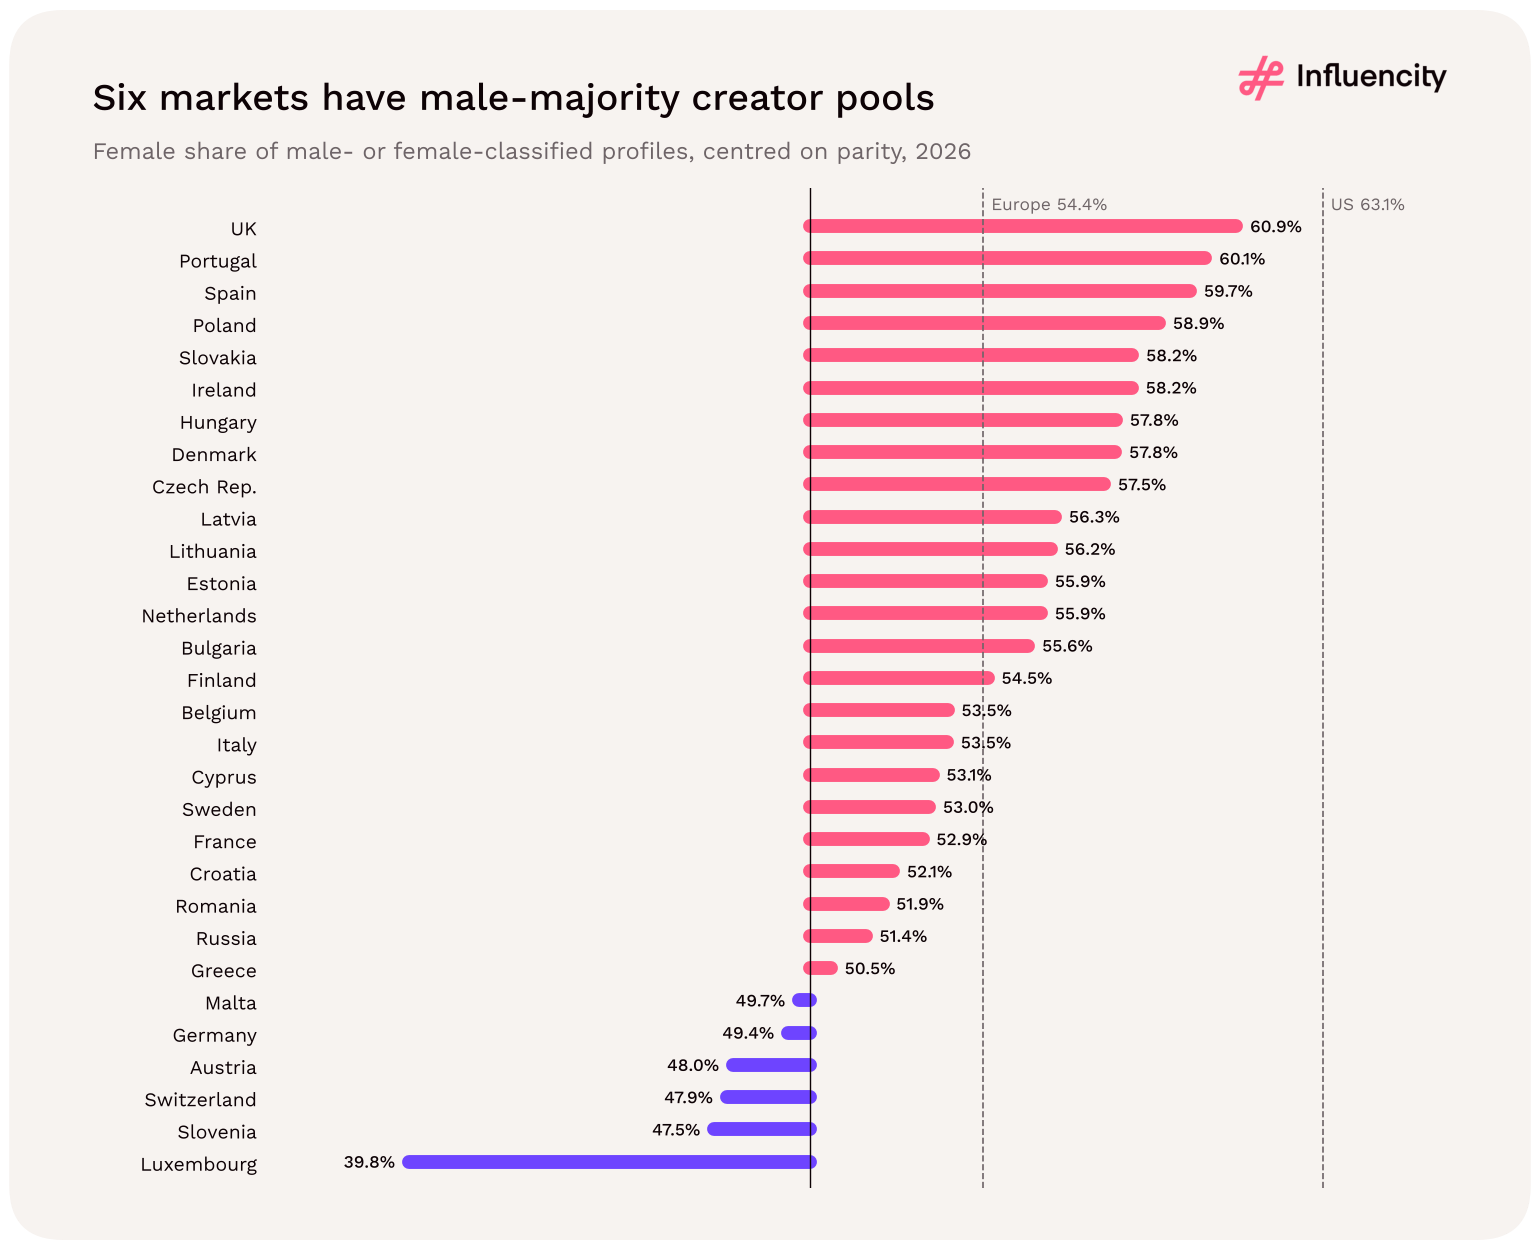
Figure 23 → Female share of male- or female-classified profiles by market, centred on parity. Source: [1].
Markets with a larger share of 10k+ creators tend to have more unclassified profiles (rank correlation 0.36, borderline statistical significance across 29 markets). This is consistent with larger accounts more often belonging to brands, media or collectives, which have no individual gender to classify.
Six of 30 European markets have more male- than female-classified TikTok creator profiles; four of them are German-speaking. The UK has the highest female share of classified profiles (60.89%); Luxembourg has the lowest (39.75%). At the mega tier, 55.87% of classified European entries are male.
What this means for briefs
For rosters that need male creators, the DACH markets and Luxembourg offer more balanced pools; for female-led briefs, the UK, Portugal and Spain have the strongest female majorities among classified profiles.
For the mega tier, expect a male majority in Europe (55.87%) even though the overall pool leans female.
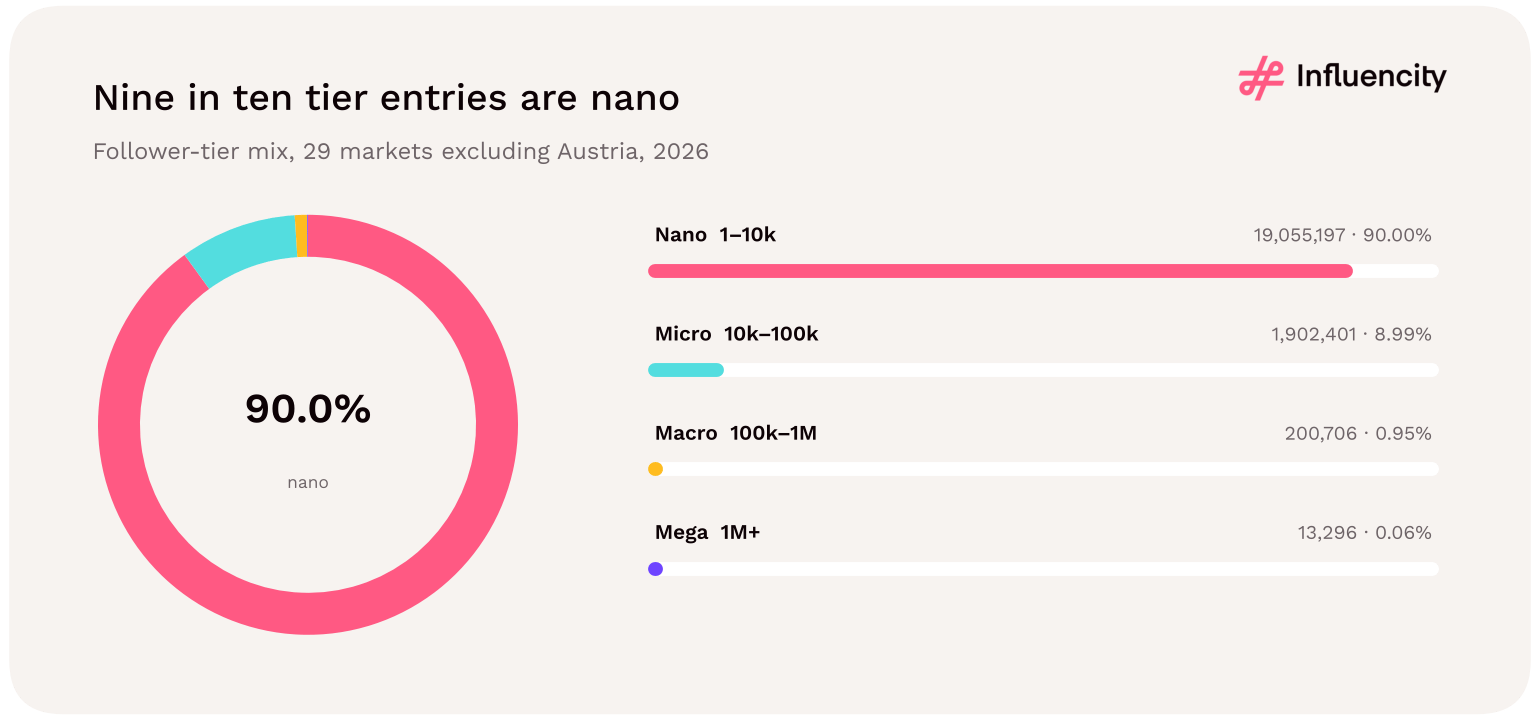
About nine in ten European TikTok tier entries are nano influencers, with under 10k followers; creators with 1M+ followers make up 0.06%. Across the 29 markets in the tier view, Influencity's 2026 data record 19,055,197 nano, 1,902,401 micro, 200,706 macro and 13,296 mega entries. Nano and micro creators together account for 98.99% of the pool. [1]
Of 21,171,600 follower-tier entries across 29 European markets, 90.00% are nano (under 10k followers), 8.99% micro (10k–100k), 0.95% macro (100k–1M) and 0.06% mega (1M+). Five markets (Russia, the UK, France, Spain and Germany) hold 81.2% of the mega entries. [1]
The four bands are nano (under 10k followers), micro (10k–100k), macro (100k–1M) and mega (1M+). All tier figures in this study cover 29 markets and exclude Austria, whose macro-tier field (694,027 entries) is more than three times its 199,153 eligible profiles. Austria's other three tiers are consistent with its profile count, but leaving it out of every tier keeps one denominator throughout. [1]
In the 29 markets, tier entries (21,171,600) match eligible profiles (21,197,936) to within 0.12%, so tier shares describe the profile pool closely. They are not the 21,397,089 headline count for all 30 markets. Appendix C lists every country's tier entries, including Austria's. [1]
| Tier | Followers | Entries | Share of tier entries | Per 100,000 estimated users |
|---|---|---|---|---|
| Nano | Under 10k | 19,055,197 | 90.00% | 7,627 |
| Micro | 10k–100k | 1,902,401 | 8.99% | 761 |
| Macro | 100k–1M | 200,706 | 0.95% | 80 |
| Mega | 1M+ | 13,296 | 0.06% | 5.3 |
| All tiers | 21,171,600 | 100.00% | 8,474 |
Source: [1]. 29 markets, excluding Austria; 249,851,000 estimated TikTok users in those markets.

Figure 24 → Follower-tier mix, 29 markets excluding Austria. Source: [1].
Each step up the follower ladder is about ten times smaller than the one below. There are 10.0 nano entries for every micro entry, 9.5 micro for every macro and 15.1 macro for every mega. Per 100,000 estimated users, that means about 761 micro, 80 macro and 5.3 mega entries. A brand looking for 1M+ creators is choosing from 13,296 entries across 29 markets. [1]
Concentration rises with follower size. The five largest markets in each tier hold 61.6% of nano entries, 68.9% of micro, 75.6% of macro and 81.2% of mega entries (section 04). Six markets record fewer than 10 mega entries (Bulgaria, Latvia, Lithuania, Luxembourg, Malta and Slovenia), and 18 of the 29 record fewer than 100. [1]
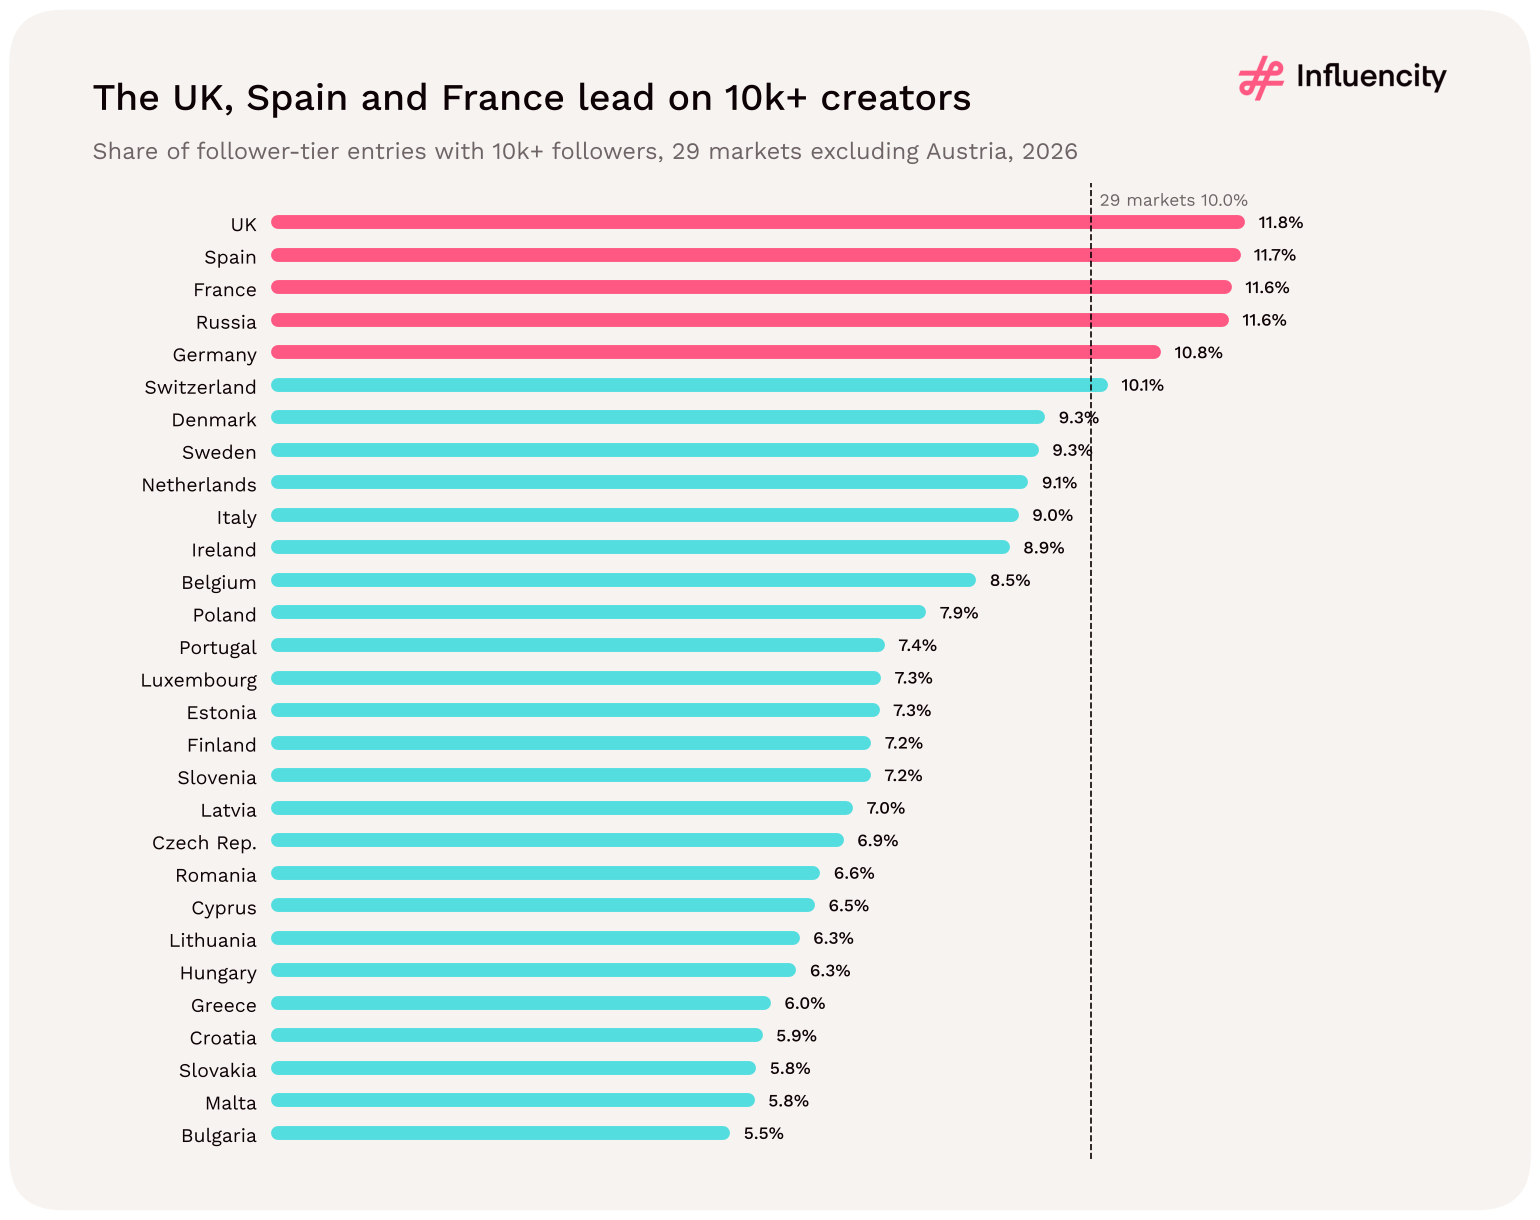
The UK, Spain and France have the highest shares of tier entries with 10k+ followers. The share is highest in the UK (11.81%), Spain (11.75%), France (11.64%), Russia (11.61%) and Germany (10.77%), against 10.0% across the 29 markets. It is lowest in Bulgaria (5.47%), Malta (5.78%) and Slovakia (5.80%). [1]
Relative to the audience, the picture shifts. France has the most micro entries per 100,000 estimated users (1,211), followed by Romania (1,123), the UK (1,056) and Germany (949), against 761 regionally. For macro and mega combined, France (134 per 100,000 users) and the UK (130) lead, with Spain (99) and Germany (99) next, against 86 regionally. Spain has a thin creator base overall but one of Europe's deepest top ends (section 07). [1]
Mega entries are the most clustered tier. Six markets hold 88.8% of them:
| Country | Mega entries | Share of 29-market mega | Mega per 1M estimated users |
|---|---|---|---|
| Russia | 3,010 | 22.6% | 45 |
| United Kingdom | 2,467 | 18.6% | 92 |
| France | 2,096 | 15.8% | 90 |
| Spain | 1,715 | 12.9% | 82 |
| Germany | 1,511 | 11.4% | 64 |
| Italy | 1,002 | 7.5% | 46 |
| 29 markets | 13,296 | 100.0% | 53 |
Source: [1]. 29 markets, excluding Austria.

Figure 25 → Share of tier entries with 10k+ followers by market, 29 markets excluding Austria; the dashed line marks the 29-market figure of 10.0%. Source: [1].
Thus, 90.00% of European TikTok tier entries are nano (under 10k followers) and 0.06% are mega (1M+), across 29 markets excluding Austria. Each tier is roughly ten times smaller than the one below; there are about 5.3 mega entries per 100,000 estimated users.
The UK, Spain and France have the highest shares of tier entries with 10k+ followers (11.6% to 11.8%); Bulgaria has the lowest (5.5%). Russia, the UK, France, Spain and Germany hold 81.2% of the 13,296 mega entries.
What this means for tier strategy
Build European TikTok rosters from the base of the pyramid: nano and micro creators make up 98.99% of tier entries and are available in every market.
Source mega partners mainly in the UK, France, Spain and Germany, which have the most per estimated user; Russia holds the largest mega count, subject to the caveats in section 07.
In nano-heavy markets such as Bulgaria, Slovakia and Hungary, plan for more creators per campaign rather than a few large accounts.
Romania is 93.4% nano, but it records 1,123 micro entries per 100,000 users, second only to France, so mixed nano-and-micro rosters are realistic there.
In the 18 markets with fewer than 100 mega entries, plan large-creator reach as a cross-border buy rather than a local one.
Across Europe's seven largest TikTok creator markets (Russia, France, the UK, Germany, Italy, Romania and Spain), beauty and tech & gaming are the two leading niches. Together they account for an average of 46.6% of each market's niche tags. Beauty ranks first or second in all seven markets, and tech & gaming is the largest niche in France, Germany and Russia. The real story, though, is how differently the seven markets lean. [1]
| Niche | France | Germany | Italy | Romania | Russia | Spain | UK |
|---|---|---|---|---|---|---|---|
| Beauty | 114,147 | 132,527 | 80,577 | 45,563 | 35,754 | 41,509 | 455,065 |
| Tech & gaming | 140,144 | 141,458 | 69,468 | 33,470 | 46,038 | 40,045 | 391,254 |
| Fashion | 91,472 | 94,016 | 65,901 | 28,295 | 19,542 | 45,558 | 207,927 |
| Travel | 73,153 | 70,226 | 55,794 | 26,444 | 14,175 | 40,393 | 203,366 |
| Food | 58,587 | 67,263 | 48,105 | 20,894 | 11,256 | 21,311 | 244,284 |
| Wellness | 38,111 | 77,844 | 27,799 | 16,459 | 12,350 | 18,107 | 500,506 |
| Niche tags | 515,614 | 583,334 | 347,644 | 171,125 | 139,115 | 206,923 | 2,002,402 |
| Share of eligible profiles tagged | 19.0% | 25.3% | 17.4% | 10.8% | 3.9% | 14.4% | 74.3% |
Source: [1]. Niche-tagged TikTok profiles, 2026, same eligibility rules as the main dataset. In France, fashion includes lifestyle tags and wellness includes healthy-living tags.
Niche coverage differs sharply by market. Niche tags cover 74% of eligible profiles in the UK but 3.9% in Russia, with the other five markets between 10.8% and 25.3%. Absolute niche counts therefore partly reflect how fully each market's content is categorised. This section compares each market's niche mix, the share of its niche tags that falls in each niche. [1]
Beauty is the largest niche in Italy (23.2% of niche tags) and Romania (26.6%), and second everywhere else. Tech & gaming leads in Russia (33.1%), France (27.2%) and Germany (24.2%). Only two markets break the pattern, wellness is the UK's largest niche (25.0%), and fashion is Spain's (22.0%). [1]
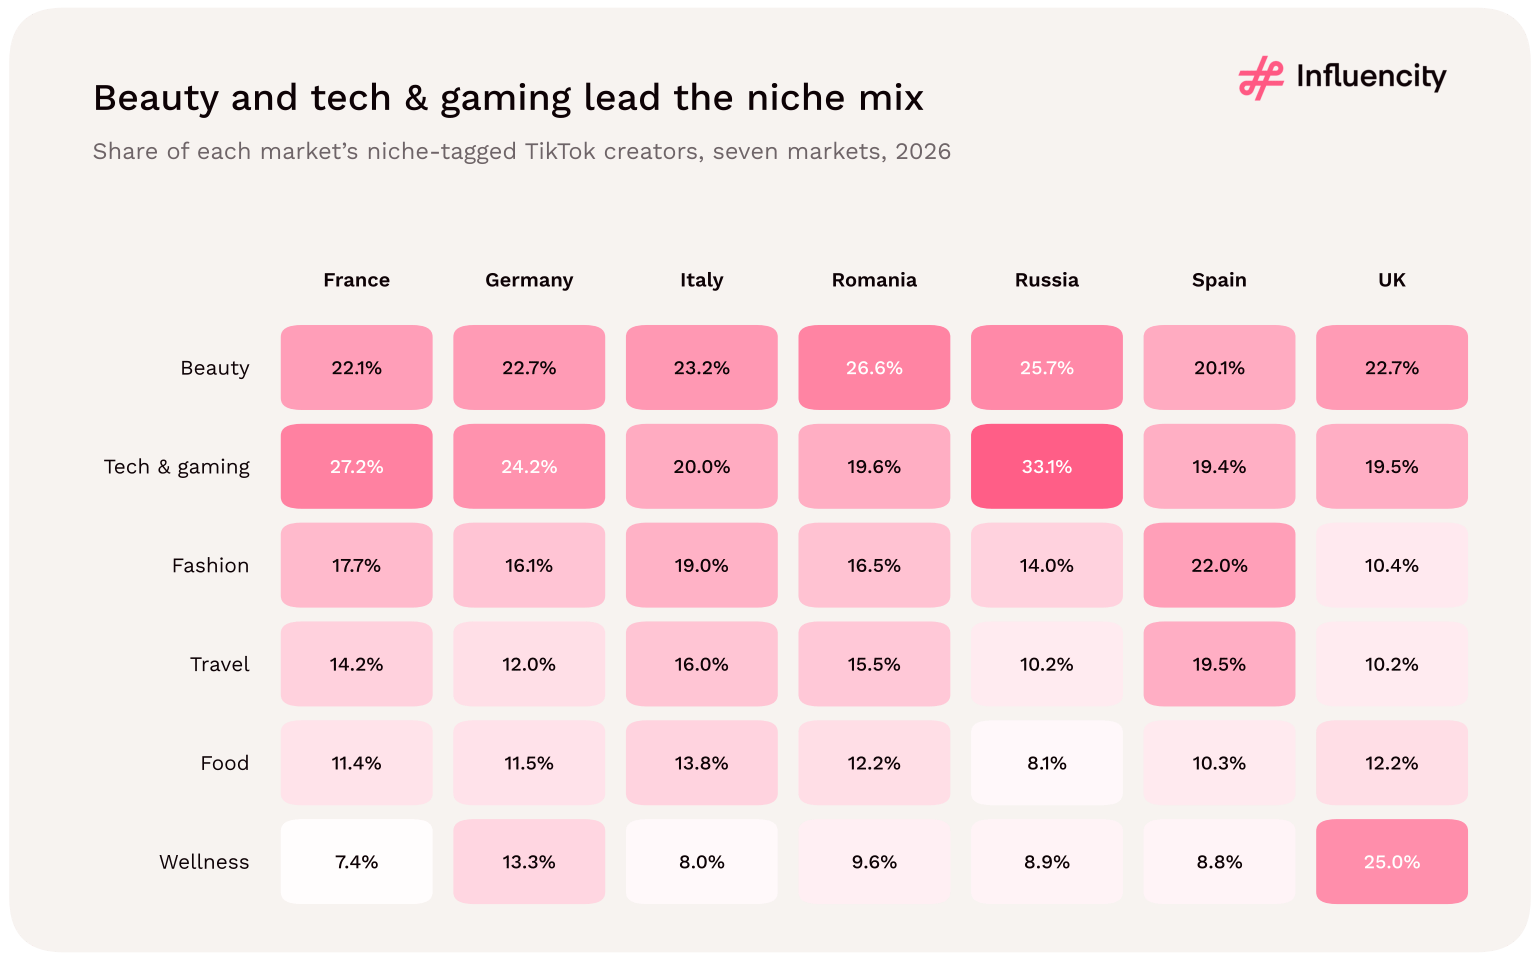
Figure 26 → Share of each market’s niche-tagged TikTok creators by niche, seven markets, 2026. Source: [1].
Comparing each market's niche shares with the seven-market average (index 100) shows where each one over-indexes. Every market has at least one clear signature niche, and several of them match how those countries are known abroad. [1]
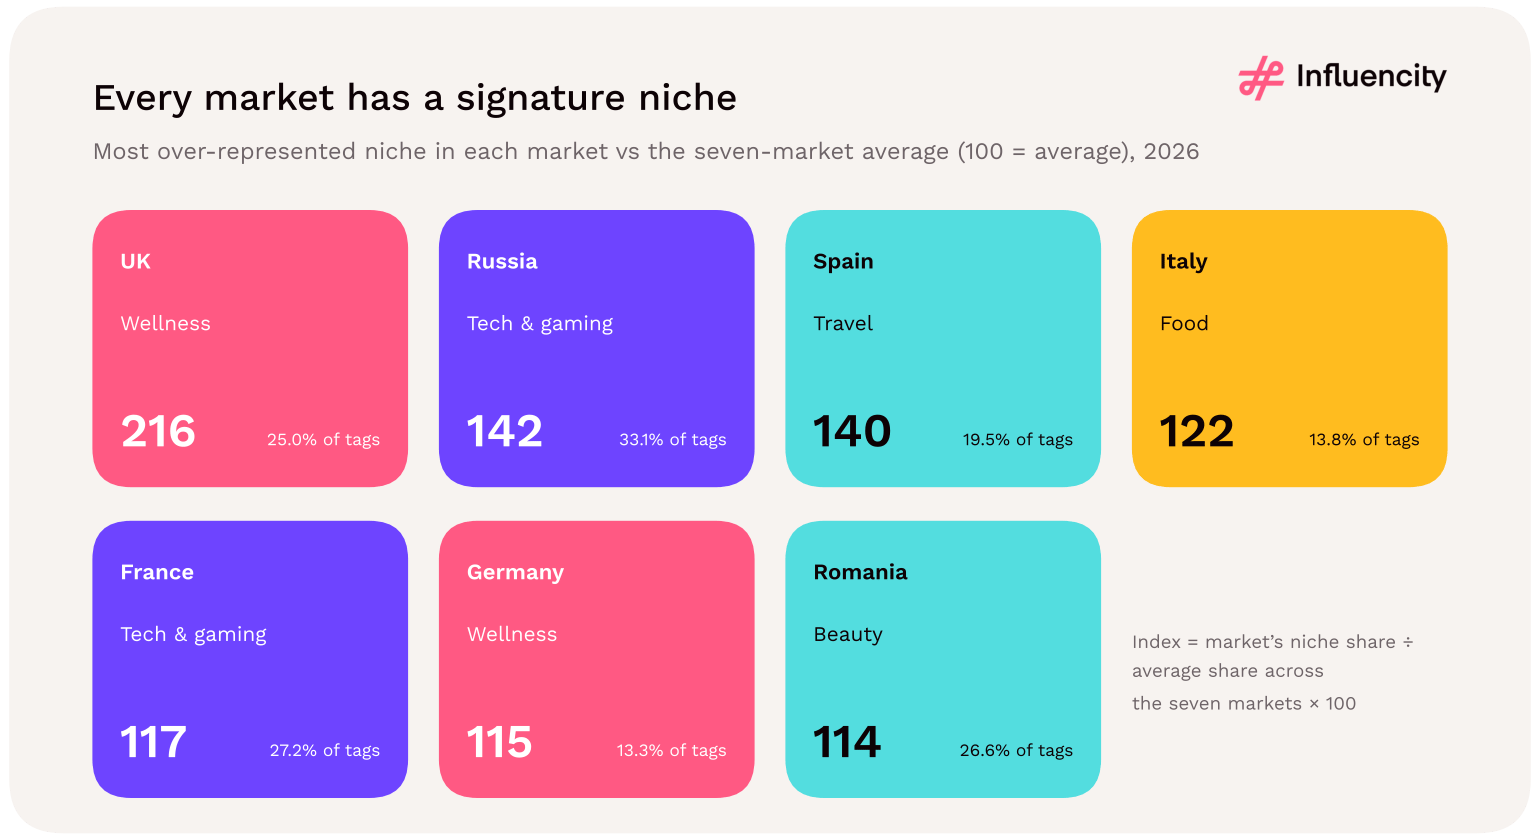
Figure 27 → Most over-represented niche in each market; index = market’s niche share ÷ seven-market average × 100. Source: [1].
United Kingdom: wellness (216). Wellness accounts for a quarter of UK niche tags, more than twice the seven-market average of 11.6%, and is the UK's largest niche. It is the strongest single-market skew in the data: wellness is a deeper creator category in the UK than anywhere else in the seven markets. Fashion, by contrast, is only 10.4% of UK tags, the lowest fashion share of the seven. [1]
Russia: tech & gaming (142). One in three Russian niche tags is tech & gaming (33.1%), the highest share in the study and about 40% above the seven-market average. Its food share (8.1%) is the lowest of the seven markets, and its travel share (10.2%) ties with the UK's for lowest. [1]
Spain: travel (140) and fashion (133). Spain is the only market where fashion is the largest niche (22.0%), and it has the highest travel share (19.5%). Both match strengths of the Spanish economy: Spain received a record 96.8 million international tourists in 2025 [9], and it is home to Inditex, owner of Zara, Bershka and Massimo Dutti, which reported €39.9bn in sales for its 2025 financial year [10]. [1]
Italy: food (122), fashion and travel (both 115). Italy has the highest food share (13.8%) and over-indexes on fashion (19.0%) and travel (16.0%): a lifestyle trio that sets Italy apart from the other six markets. Even so, food is only Italy's fifth-largest niche. [1]
France: tech & gaming (117). France's largest niche is tech & gaming (27.2%), not food or fashion. Wellness is its smallest niche (7.4%), the lowest wellness share of the seven markets. [1]
Germany: wellness (115). Germany has the second-highest wellness share (13.3%) after the UK, while tech & gaming remains its largest niche (24.2%). [1]
Romania: beauty (114). Romania has the highest beauty share (26.6%), and beauty is its largest niche, followed by tech & gaming (19.6%). [1]
| Niche | France | Germany | Italy | Romania | Russia | Spain | UK |
|---|---|---|---|---|---|---|---|
| Beauty | 95 | 97 | 99 | 114 | 110 | 86 | 98 |
| Tech & gaming | 117 | 104 | 86 | 84 | 142 | 83 | 84 |
| Fashion | 107 | 97 | 115 | 100 | 85 | 133 | 63 |
| Travel | 102 | 86 | 115 | 111 | 73 | 140 | 73 |
| Food | 100 | 101 | 122 | 107 | 71 | 91 | 107 |
| Wellness | 64 | 115 | 69 | 83 | 77 | 76 | 216 |
Source: [1]. Niche index = market’s niche share ÷ seven-market average share × 100. Bold: 110 or more.
Food ranks fourth in the UK and fifth or sixth in every other market. Its share ranges from 8.1% in Russia to 13.8% in Italy, and France, often cited as a gastronomy reference, sits at 11.4%, exactly the seven-market average. Strong culinary reputations do not translate into a larger share of food creators. For restaurant, food and drink brands, the dedicated pool is narrower than headline totals suggest. [1]
Across the seven markets, 44.9% of classified tech & gaming creators are female. Every other niche has a female majority, from 64.4% in fashion to 74.9% in beauty. [1]
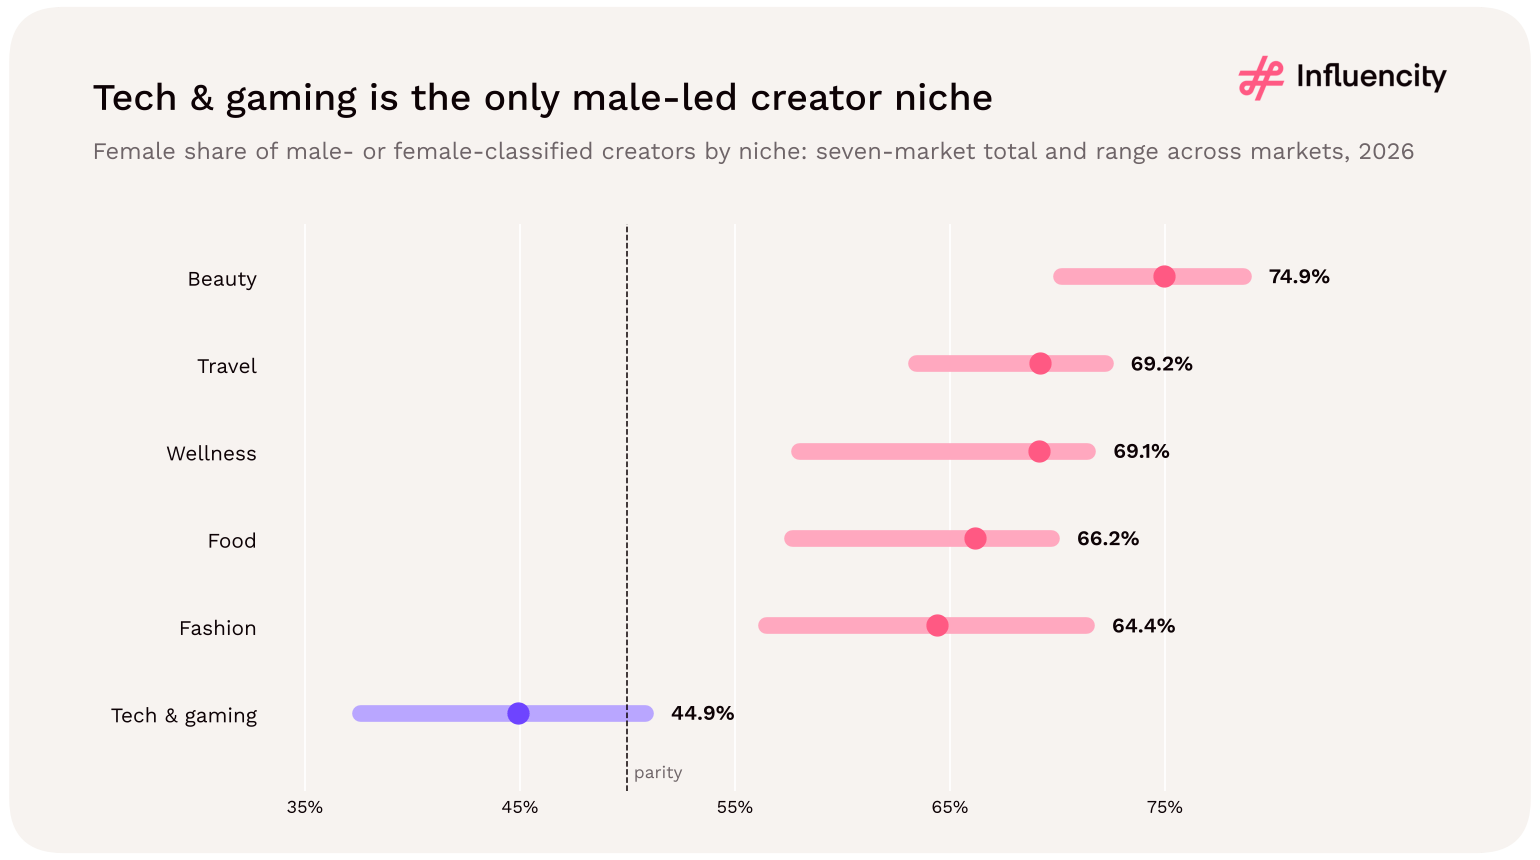
Figure 28 → Female share of male- or female-classified creators by niche: seven-market total (dot) and range across markets (bar). Source: [1].
The UK breaks the pattern. Its tech & gaming creators are at parity (50.8% female), against 37.5% to 42.0% in the other six markets. [1]
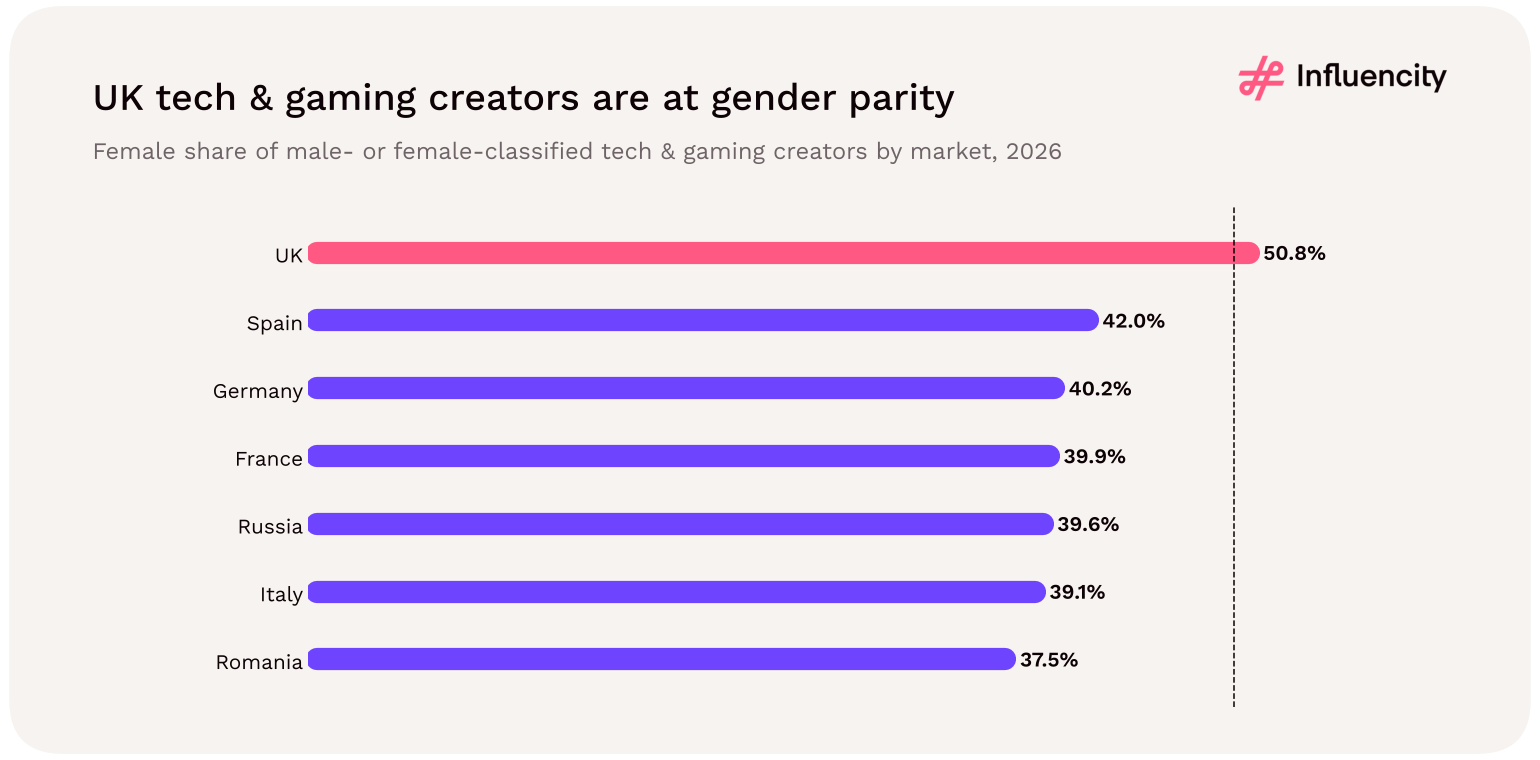
Figure 29 → Female share of male- or female-classified tech & gaming creators by market. Source: [1].
Beauty is the most female niche, yet it still includes about 181,900 male-classified creators across the seven markets. In Russia and Italy, roughly three in ten classified beauty creators are male (29.8% and 29.5%). [1]
Germany is one of six male-majority markets overall (section 11), yet its niche-tagged creators are female-majority in every niche except tech & gaming. Its male majority therefore sits in tech & gaming and in content outside these six niches. [1]
| Niche | France | Germany | Italy | Romania | Russia | Spain | UK |
|---|---|---|---|---|---|---|---|
| Beauty | 72.8% | 72.0% | 70.5% | 76.1% | 70.2% | 78.6% | 77.1% |
| Tech & gaming | 39.9% | 40.2% | 39.1% | 37.5% | 39.6% | 42.0% | 50.8% |
| Fashion | 62.7% | 59.2% | 56.5% | 61.6% | 62.6% | 61.4% | 71.3% |
| Travel | 67.6% | 67.8% | 64.5% | 66.4% | 63.4% | 69.8% | 72.2% |
| Food | 64.6% | 63.1% | 57.6% | 62.0% | 58.1% | 65.8% | 69.7% |
| Wellness | 70.6% | 69.1% | 65.4% | 68.8% | 58.0% | 71.4% | 69.4% |
Source: [1]. Female ÷ (female + male) within each niche.
Profiles without a gender classification make up 24.8% of tech & gaming and 22.5% of food tags, against 15.7% in travel and 17.7% in beauty. That is consistent with more brand, publisher, review and team accounts in those two niches.
What this means for campaign planning
Match the brief to each market’s signature niche. Wellness programmes have the deepest relative supply in the UK and Germany, tech & gaming in Russia and France, travel and fashion in Spain, beauty in Romania, and food, fashion and travel in Italy.
Search beyond niche tags where coverage is low. In Russia and Romania, niche tags cover a small share of eligible profiles, so add keyword, hashtag and content searches to tag-based discovery.
Plan food campaigns around adjacent niches. Food is a mid-sized niche everywhere; pairing food with travel creators in Italy and Spain, or lifestyle creators in France, widens the pool.
Do not assume gaming means male. UK tech & gaming creators are at gender parity, and every other niche is female-majority.
In Europe’s seven largest TikTok creator markets, beauty and tech & gaming are the leading niches in 2026, together averaging 46.6% of each market’s niche tags. Each market has a signature niche: wellness in the UK (index 216), tech & gaming in Russia (142), travel in Spain (140), food in Italy (122), tech & gaming in France (117), wellness in Germany (115) and beauty in Romania (114). Tech & gaming is the only male-led niche (44.9% female), except in the UK, where it is at parity (50.8%). Food never ranks above fourth, even in Italy and France.
Search across overlapping niches
Many creators carry several niche tags: fashion overlaps beauty and lifestyle, travel overlaps food. Shortlist by content fit rather than by niche label alone, and deduplicate creators who appear in more than one niche search.
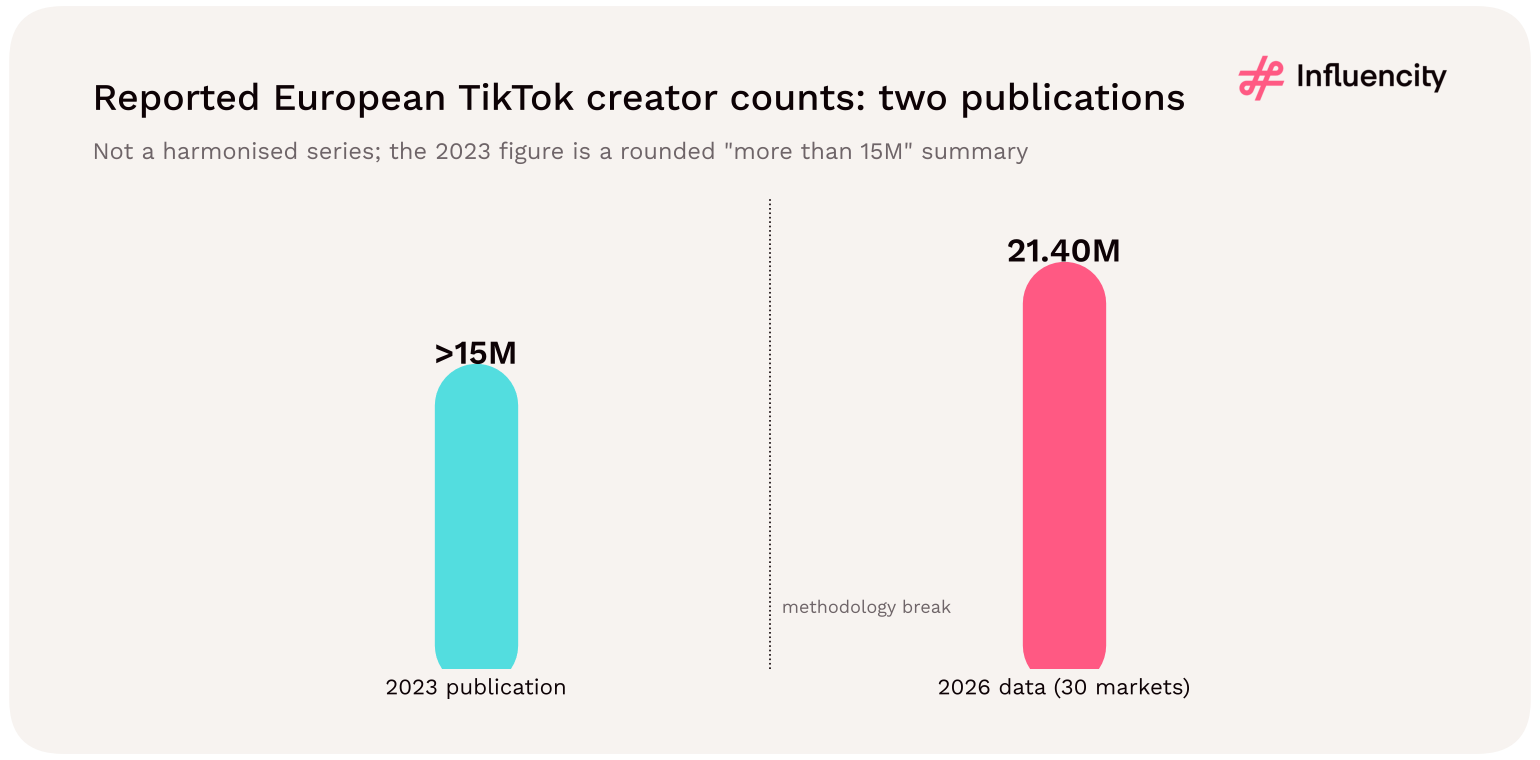
Influencity's TikTok Statistics To Know in 2023 reported more than 15M European TikTok influencers, with Russia at about 3.7M and the UK at almost 2M. It also described a female majority overall and a male majority among mega-influencers. These provide historical context, not a harmonised baseline. [3]
| Measure | 2023 published summary | 2026 data |
|---|---|---|
| European eligible creator pool | More than 15M; chart rounds to 15M | 21,397,089 across 30 markets |
| Russia | About 3.7M | 3,523,007 |
| United Kingdom | Almost 2M | 2,694,094 |
| Overall classified gender pattern | Female majority | Female majority: 54.43% |
| Classified mega-tier pattern | Male majority | Male majority (55.87%) |

Figure 30 → Historical published context and the 2026 data are not a harmonised time series. Sources: [1, 3].
Using exactly 15.0M as an explicitly rounded comparison point produces a difference of about 6.40M profiles, or 42.6%. The same 2023 study reported 10,116,950 US TikTok influencers; the 2026 US count is 43.0% higher. That the two regions moved by almost the same proportion may reflect common changes in discovery coverage or eligibility as much as market growth; the aggregate data cannot separate those effects. [1, 3, 4]
Russia is the exception among the markets the 2023 study reported separately: its recorded count fell. Influencity's 2023 study reported about 3.7M Russian TikTok influencers; the 2026 data record 3,523,007, roughly 5% fewer, while the European total rose about 43% and the UK moved from almost 2M to 2,694,094, at least a third more. Russia's share of the regional pool fell from roughly a quarter to 16.5%. The data cannot explain the decline. Changes in coverage or eligibility are possible, and the market context changed between the two editions: TikTok suspended new uploads and livestreaming for users in Russia in March 2022 [11]. Both 2023 figures were rounded, so treat the changes as approximate. [1, 3]
| Possible driver | What it would mean | Can the data separate it? |
|---|---|---|
| Wider database coverage | More existing creators indexed, not more creators | No |
| Changed eligibility or footprint | Different definition of who counts, or which markets | No |
| Underlying market growth | More people creating eligible TikTok content | No |
All three drivers are plausible and they are not mutually exclusive. The near-identical change in Europe (+42.6%) and the US (+43.0%) is consistent with a shared methodological component, but does not prove it. [1, 3, 4]
Key takeaways
Influencity’s 2026 data record 21.40M eligible European TikTok profiles, about 42.6% above the rounded 15M published in 2023. The change mixes coverage, eligibility and market effects, so it should not be read as market growth.
The US count moved by almost the same proportion (+43.0%). Russia is the exception: its recorded count fell about 5% (from about 3.7M to 3.52M), cutting its regional share from roughly a quarter to 16.5%.
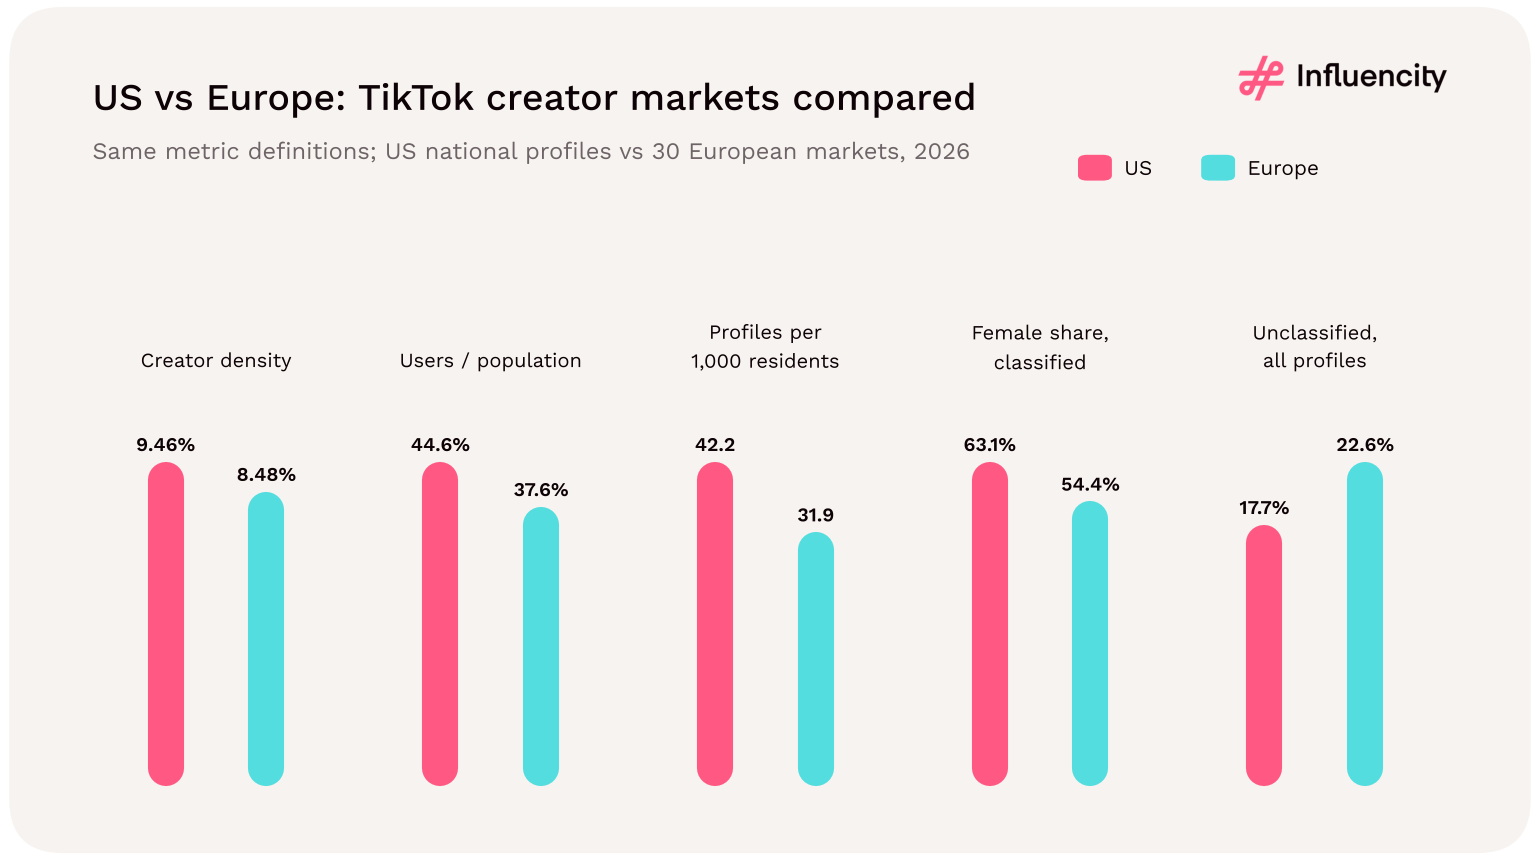
Europe's TikTok creator pool is larger than the US pool, but thinner relative to its audience and population, and much less female-skewed. The 30 European markets record 21.40M eligible profiles against 14.47M in the US (47.9% more) and 252.3M estimated users against 153.0M (64.9% more). Creator density is 8.48% in Europe and 9.46% in the US; Europe has 31.9 eligible profiles per 1,000 residents against 42.2. [1, 4]
Both 2026 datasets use the same metric definitions. Two differences limit the comparison: US TikTok creator counts are national only, so there is no US equivalent of Europe's country creator rankings; and follower-tier comparisons need care (Europe's tier view covers 29 markets, excluding Austria).
| Metric | Europe (30 markets) [1] | United States [4] |
|---|---|---|
| Population reference | 670.2M | 342.9M |
| Estimated TikTok users | 252.3M | 153.0M |
| Influencer-eligible profiles | 21.40M | 14.47M |
| Creator density | 8.48% | 9.46% |
| Estimated users / population | 37.65% | 44.62% |
| Eligible profiles per 1,000 residents | 31.9 | 42.2 |
| Female share, classified | 54.43% | 63.1% |
| Unclassified share, all profiles | 22.65% | 17.7% |
| Markets with male classified majority | 6 of 30 | Not available (national only) |
| Classified mega tier, male share | 55.87% | 52.4% |
| Nano share | 90.0% (29 markets, excl. Austria) | 86.0% of tier records |
| Largest four markets' share of users | 55.7% (countries) | 33.6% (states) |
| Country / state creator rankings | Available for 30 markets | Not available |
| TikTok density ÷ Instagram density | 2.01x | 2.04x |
| TikTok profiles vs Instagram | +72.5% | +62.4% |
| TikTok users vs Instagram | −14.3% | −20.6% |
| Change vs 2023 published count | +42.6% (vs rounded 15M) | +43.0% |
Sources: [1] for Europe; [4] for the US; [2] and [5] for Instagram ratios; [3] for 2023 counts.

Figure 31 → Five comparable TikTok ratios for the two regions. Pink = US, turquoise = Europe. Sources: [1, 4].
Europe has 1.95 times the US population reference but only 1.48 times as many eligible TikTok profiles. Most of the gap per resident comes from lower estimated audience penetration (37.65% against 44.62%); relative to estimated users, the difference narrows to 8.48% against 9.46%. Excluding Russia, Europe's density rises to 9.63%, marginally above the US. [1, 4]
The largest regional difference is in gender classification. Female-classified profiles are 63.1% of classified US TikTok creators but 54.43% in Europe, and six European markets have male majorities. On Instagram the regions are almost identical (60.3% US, 59.8% Europe). In other words, European TikTok's creator base is distinctly more balanced than its Instagram base, while the US TikTok base is slightly more female than its Instagram base. Both regions show a male majority at the TikTok mega tier. [1, 4–6]
In both regions TikTok records more creators and fewer estimated users than Instagram, and its creator density is about twice as high: 2.01 times in Europe and 2.04 times in the US. That consistency, from four separately reconciled national or regional totals, is one of the more robust cross-platform findings in Influencity's 2026 data. It still describes supply, not performance. [1, 2, 4, 5]
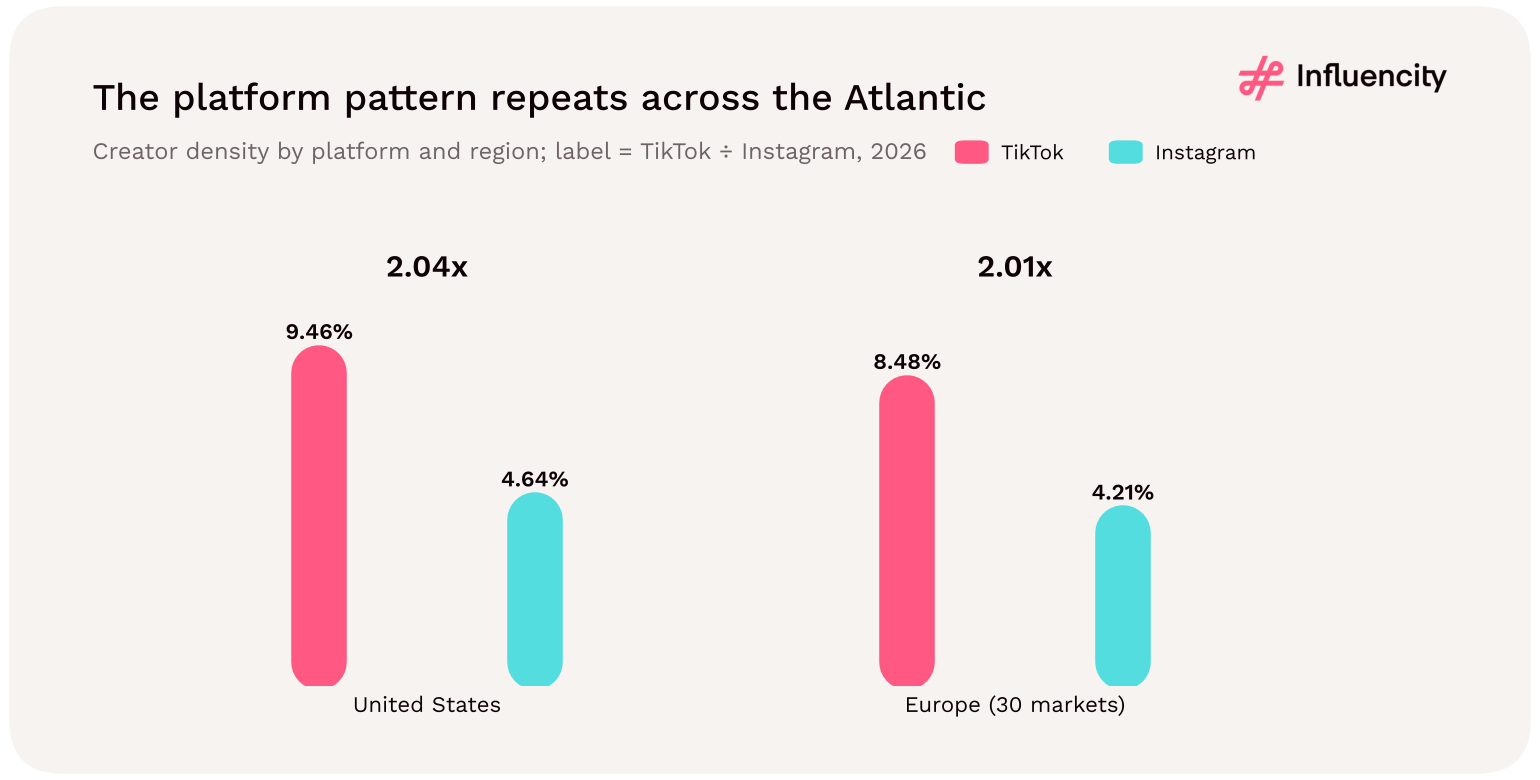
Figure 32 → TikTok and Instagram creator density in each region, 2026 data. Sources: [1, 2, 4, 5].
Both regions' recorded TikTok counts are about 43% above the figures in Influencity's 2023 TikTok study (+42.6% in Europe against a rounded 15M; +43.0% in the US). European audiences are also more concentrated in their largest markets: Russia, the UK, Germany and France hold 55.7% of estimated users, against 33.6% for the four largest US states, though countries and states are not equivalent units. [1, 3, 4]
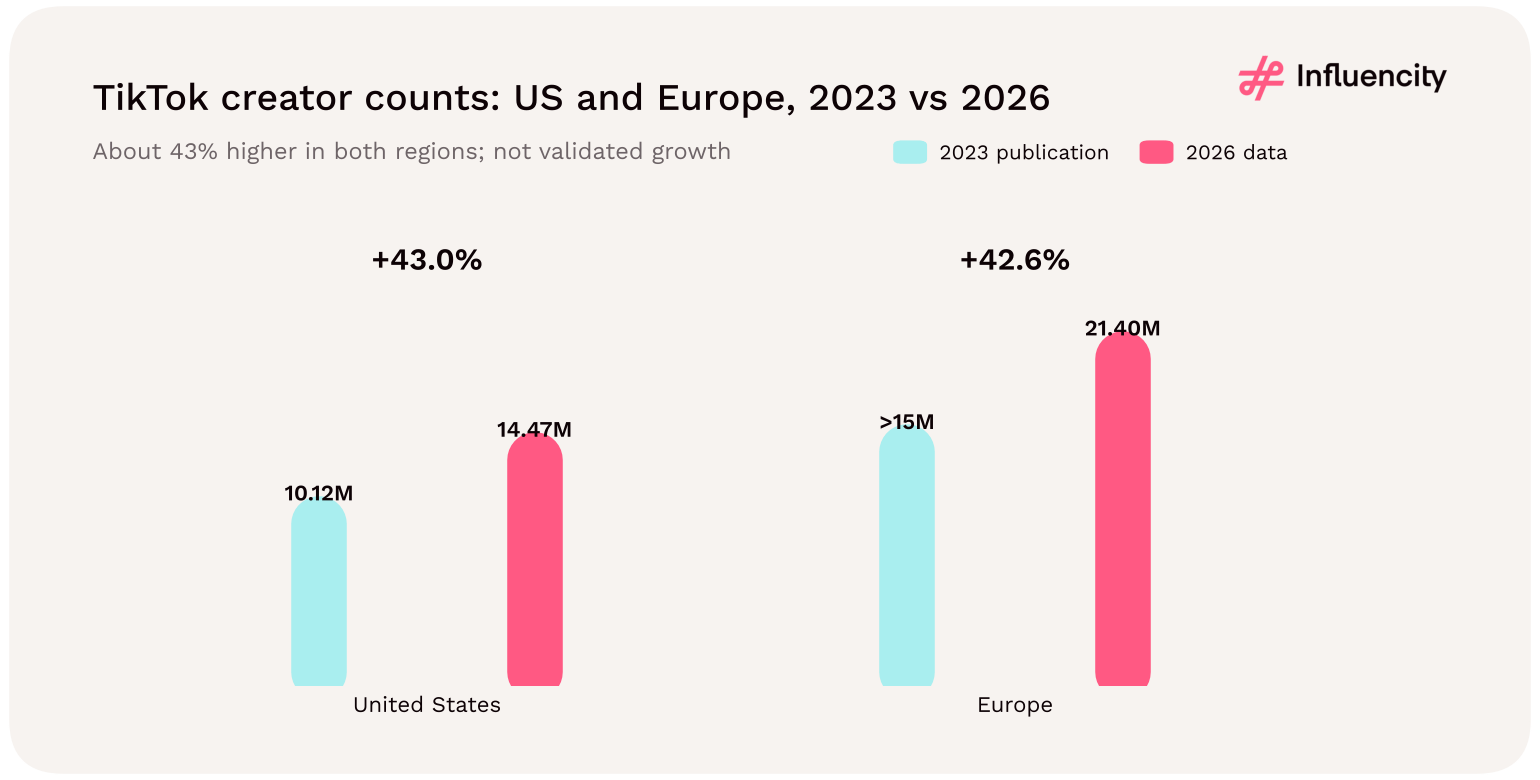
Figure 33 → Reported TikTok creator counts in the 2023 publication and the 2026 data, by region. Not validated growth. Sources: [1, 3, 4].
What this means for transatlantic TikTok campaigns
Expect a broadly similar creator-to-audience ratio in both regions, and about twice the Instagram ratio in each.
Do not carry a US gender assumption into Europe: the European TikTok creator base is much closer to balanced, and male-majority in six markets.
Plan European discovery by country: Europe offers country-level creator counts and a 3.4-fold density spread; the US TikTok data does not yet offer state creator counts.
European country densities run from 5.28% to 18.11%, on either side of the US figure of 9.46%. A single Europe-versus-US comparison hides that spread, so plan European campaigns country by country. [1, 4]
Europe (30 markets) records 21.40M eligible TikTok profiles against 14.47M in the US, but lower density (8.48% vs 9.46%). European TikTok creators are less female-skewed than US creators: 54.43% vs 63.1% of classified profiles. In both regions, TikTok’s creator density is about twice Instagram’s (2.01x Europe, 2.04x US).
The 2026 Europe data count profiles; it has no engagement, sentiment, disclosure or conversion fields. Two recent Influencity studies measured those things on TikTok, Instagram and YouTube in specific categories, but in the US and Mexico, not Europe. Their findings are therefore hypotheses for European planning, not European results. [7, 8]
| Supplements study [7] | Food study [8] | |
|---|---|---|
| Published | October 2025 | November 2025 |
| Sample | 5,000+ sponsored posts; creators aged 18–50; 500+ comments per post | 10,568 social mentions; 20-creator dataset; nine brand case studies |
| Platforms | TikTok, Instagram, YouTube | TikTok, Instagram, YouTube |
| Geography | United States and Mexico | United States (five states) |
| Period | January–June 2025 | Not stated |
TikTok had the lowest share of posts with an explicit #ad or #sponsored disclosure (66%), the lowest share with properly placed disclosures (58%) and the lowest share avoiding disease or medical claims (81%) of the three platforms. Its share of positive comments (58%) sat between Instagram's (68%) and YouTube's (51%). Its composite trust index was 23 out of 100, against 69 for Instagram and 8 for X. The study attributes the disclosure gap to "implicit or buried" disclosures. [7]
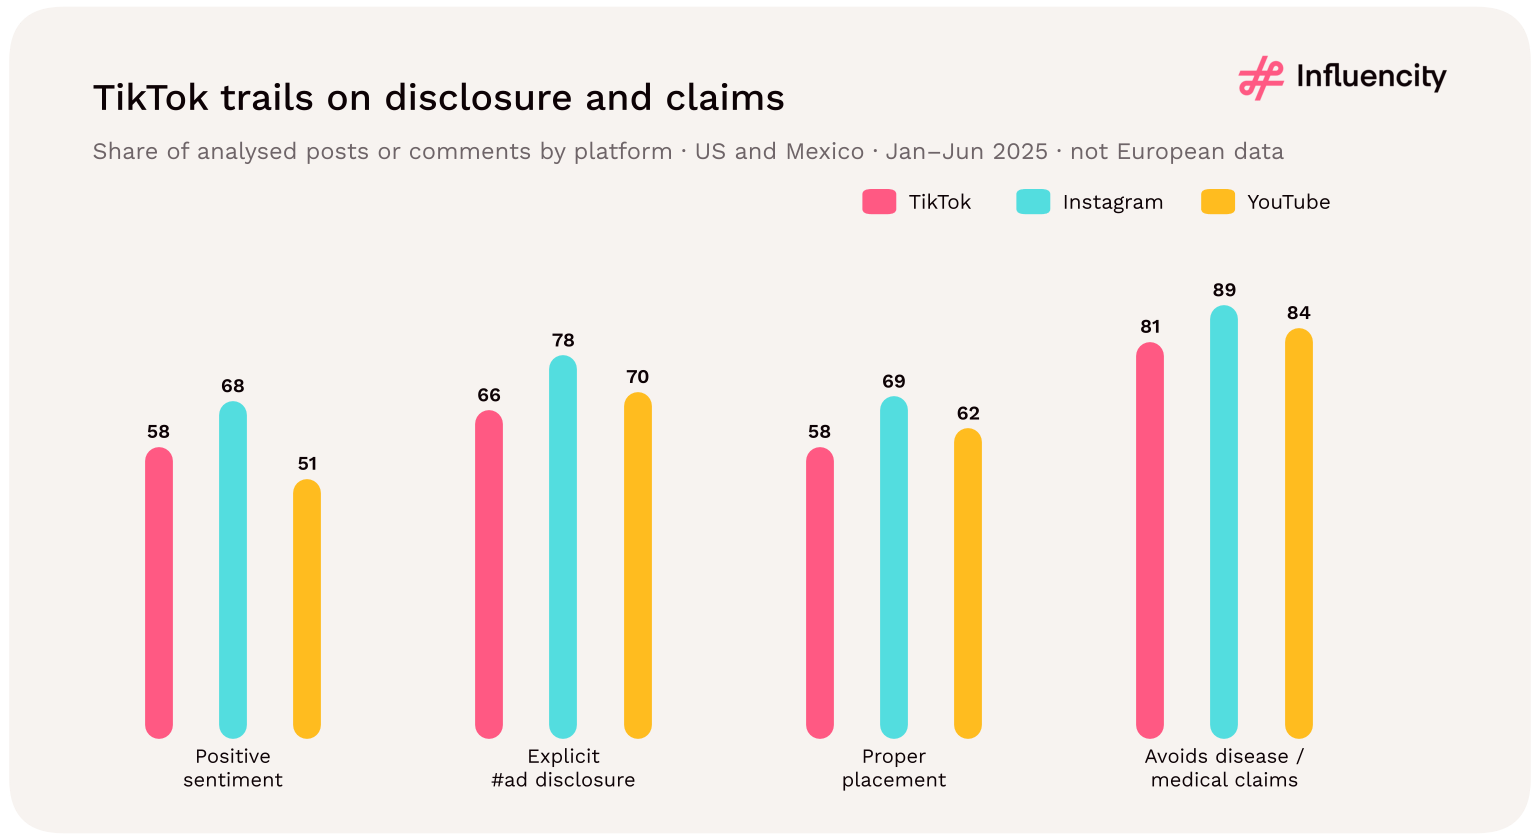
Figure 34 → Sentiment, disclosure and claim compliance by platform in Influencity's US and Mexico supplements study, TikTok shown first. Not European data. Source: [7].
Average engagement fell from a reported 57% for creators under 100k followers to 38% for 100k–1M and 24% above 1M across platforms, and micro-influencers on TikTok ranked highest in audience trust. Disclosed posts performed 12% better on long-term engagement across platforms, and routine-based content earned about three times the engagement of hard-sell posts. The engagement-rate definition is not given, so quote the direction rather than the values. [7]
The supplements study notes that the EU and UK restrict nutrition and health claims to authorised wording under Regulation (EC) No 1924/2006, prohibit disease claims, and that the UK's ASA enforces these rules in influencer content. With TikTok showing the weakest disclosure and claims compliance in its US and Mexico sample, approved wording and visible disclosure should be part of every European TikTok brief in regulated categories. The study also found that local messaging (science-based in the US, natural and family-focused in Mexico, where it describes campaigns as TikTok-led) outperformed one-size-fits-all content. [7]
The food study describes TikTok as where restaurant discovery now starts for Gen Z, found micro creators behind more than half of tagged posts, and recommends pairing national creators for awareness with city-level micro creators for visits; people aged 25–34 wrote 39.11% of mentions. [8]
| Finding (source) | Evidence base | How to use it in Europe |
|---|---|---|
| Smaller creators earn the highest engagement; TikTok micro-influencers rank highest on trust [7] | US + Mexico, supplements | Test micro-led TikTok rosters in high-density markets such as Romania |
| TikTok trails on disclosure (66%) and claims compliance (81%) [7] | US + Mexico, supplements | Specify on-screen and caption disclosure and approved claims, required under EU/UK rules |
| Clear #ad disclosure: +12% long-term engagement [7] | US + Mexico, supplements | Disclosure is a low-risk practice as well as a legal requirement |
| Localised messaging outperforms generic messaging [7] | US vs Mexico | Brief per country and language, not per region |
| TikTok-first discovery for Gen Z; national + city creator mix [8] | US, food | Pair pan-European creators with city-level TikTok creators |
| 25–34s wrote 39.11% of food mentions [8] | US social listening | Check audience age per market before targeting |
| Hypothesis (from US/Mexico evidence) | European test | Measure |
|---|---|---|
| Micro-creators out-engage larger tiers on TikTok in Europe too | Matched micro vs macro cohorts in one dense and one large market | Saves, shares, completion rate per post |
| Clear disclosure does not hurt engagement | Same brief with on-screen + caption disclosure across all creators | Long-term engagement; negative-comment share |
| Local messaging beats regional messaging | Localised vs translated scripts in two languages | Watch time; click-through; sentiment |
| National + city creators work together | Pair two national creators with 10–20 city-level micro creators | Incremental reach; store or site visits by city |
Test designs are proposals. Sources: [7, 8].
Key takeaways
Influencity’s category studies cover the US and Mexico, not Europe; treat their findings as hypotheses for European TikTok campaigns. In the supplements study, TikTok had the lowest explicit-disclosure share (66%) of the three platforms studied. Smaller creators led on engagement across platforms, and micro-influencers on TikTok ranked highest on trust.
Use the study as a market-screening layer, then replace aggregate assumptions with creator-level evidence. The workflow below is an analytical recommendation, not an observed performance model.
| Planning decision | Recommended action | Evidence to require |
|---|---|---|
| Market selection | Combine relevant audience size, absolute creator supply and density. Do not choose from density alone. | Target geography; language; category demand; available profile pool |
| Recruitment | Build separate country and platform shortlists. Apply consistent suitability criteria before comparing counts. | Recent content; follower location; authenticity checks; response and availability |
| Tier mix | Test nano and micro cohorts against the same objective; US/Mexico category evidence favours micro-led TikTok tests. [7, 8] | Audience fit; expected deliverables; rights; measured outcomes |
| Compliance | Specify disclosure format and approved claim wording; TikTok showed the weakest compliance in our US/Mexico sample, and EU/UK rules are stricter. [7] | Disclosure presence and placement; claim review log |
| Localisation | Adapt concepts, scripts and product claims to each intended audience rather than translating a regional brief. | Local review; creator input; audience language; market-specific offer |
| Cross-platform and cross-region | Evaluate TikTok and Instagram rosters separately; do not carry US gender or tier assumptions into Europe. | Audience overlap; platform-native content; incremental reach |
| Scaling | Expand cohorts that satisfy pre-agreed performance and quality criteria. | Consistent attribution; comparable cost basis; repeatability |
A brand could compare a large-supply market such as France with a high-density market such as Romania. First, measure how many profiles survive the same audience and quality filters. Then compare response rates and campaign outcomes within matched objectives. This tests whether the aggregate supply signal becomes useful recruitment capacity, without assuming the answer in advance.
The regional gender majority and nano-heavy sensitivity view describe the data, not an ideal campaign roster. Select creators for audience relevance, expertise, creative suitability and the brief. Keep inclusive sourcing and individual evidence separate from country-level classification patterns.
| Campaign objective | Where to start | Why (2026 data) |
|---|---|---|
| Broad awareness at scale | France, UK, Germany, Italy | Large and dense pools; 9.06%–11.57% density |
| Large-creator distribution | UK, France, Spain | Most mega entries per 1M users (UK 92, France 90, Spain 82) |
| Nano and community testing | Romania, Bulgaria, Hungary | Highest nano entries per 100 users (16.9, 12.8, 11.7) |
| Cross-platform programmes | Spain, Portugal, Italy | Instagram pools close to TikTok’s (0.88x–1.20x) |
| Gender-balanced rosters | Germany, Austria, Switzerland | Male-majority or near-parity classified pools |
| Audience-led reach | Ireland, Spain, Greece | High users-to-population ratios with below-benchmark density |
Source: [1, 2]. Starting points for discovery, not predictions of results.
| Weeks | Stage | What to do | Output |
|---|---|---|---|
| 1–2 | Map supply | Pick 2–3 markets by objective; run brief filters on each pool | Qualified-candidate counts per market |
| 3–4 | Establish fit | Verify follower location, language, recent activity, authenticity | Shortlist with audience evidence |
| 5–6 | Activate | Brief per market; agree disclosure, claims and usage rights | Signed creators and approved scripts |
| 7–10 | Run | Publish in matched windows; monitor compliance and comments | Live content log |
| 11–13 | Measure and learn | Compare cohorts on the agreed metrics; decide where to scale | Scale, adjust or stop decision |

Figure 35 → Campaign decision sequence with supporting evidence from this study and the category studies. Sources: [1, 7].
Choose European TikTok markets by objective: large and dense markets for scale, the UK, France and Spain for mega creators, and Romania, Bulgaria and Hungary for nano-led tests.
Build separate country and platform shortlists and compare them on the same filters.
Write disclosure format and approved claims into every brief in regulated categories.
| Objective | Useful measures | Interpretation safeguard |
|---|---|---|
| Relevant exposure | Qualified views; target-market reach; frequency | Use consistent definitions; separate paid and organic delivery. |
| Content resonance | Watch time; completion; saves; shares; meaningful comments | Compare equivalent formats and windows, not raw totals. |
| Trust and compliance | Comment sentiment; skeptical questions; disclosure presence and placement | Positive comments do not prove effectiveness. |
| Traffic and consideration | Tagged clicks; landing-page engagement; product-page visits | Check tracking coverage and attribution windows. |
| Commercial response | Attributed orders; revenue; qualified leads; assisted conversions | Separate attribution from incrementality; account for total costs. |
| Recruitment efficiency | Qualified shortlist yield; replies; acceptance; time to launch | Record the funnel from candidates to active partners. |
The trust and compliance row reflects the measures used in Influencity's supplements study. [7]
Suppose a team screens 1,000 profiles, retains 200 after audience and category checks, receives 100 replies and activates 50 creators. The shortlist yield is 20% and the final activation yield is 5%. They show why millions of eligible profiles cannot be treated as millions of available partners. Include creator fees, products, shipping, coordination, usage rights and paid support when comparing cohort costs.
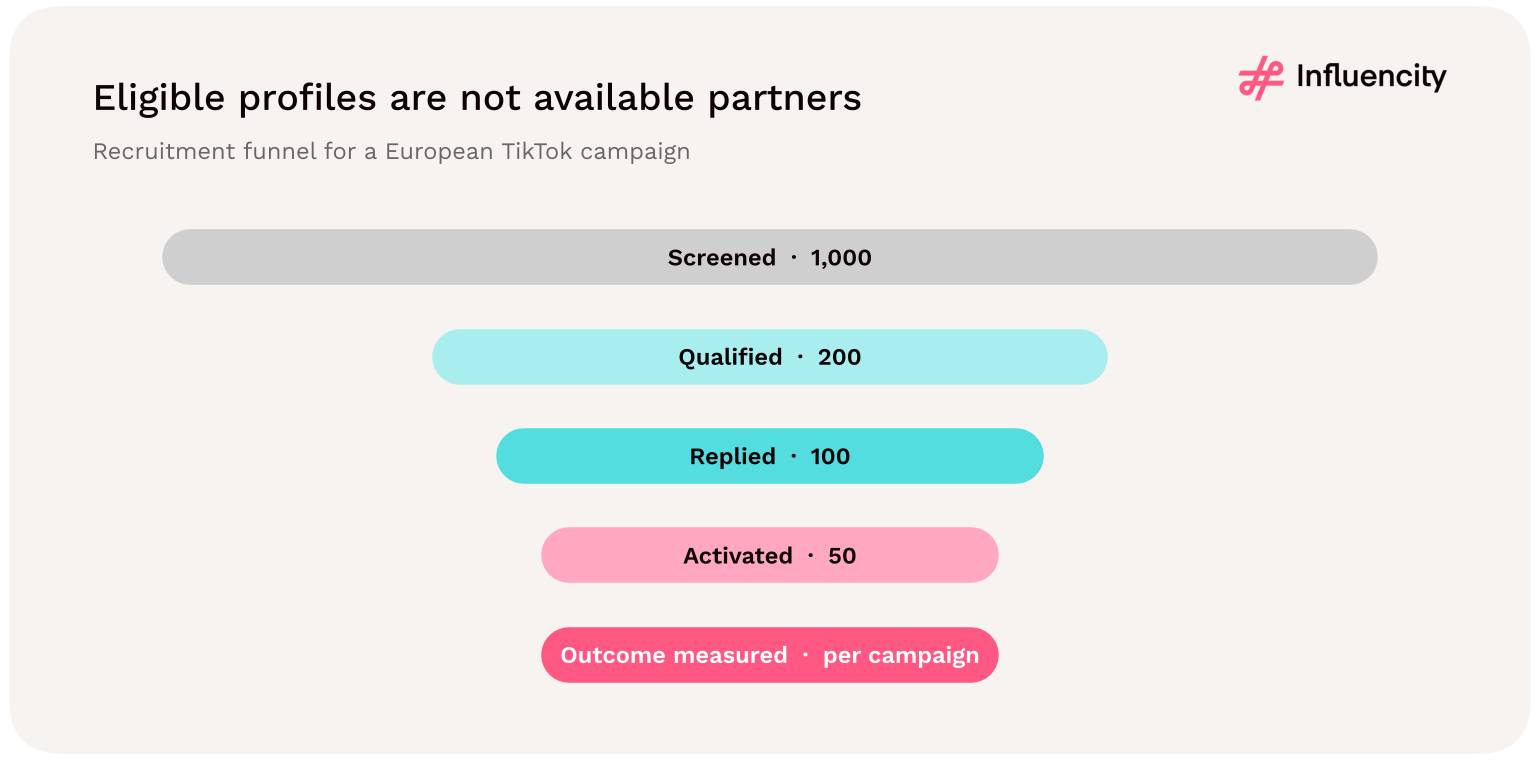
Figure 36 → Recruitment funnel showing why eligible profiles are not available partners. Not a dataset finding.
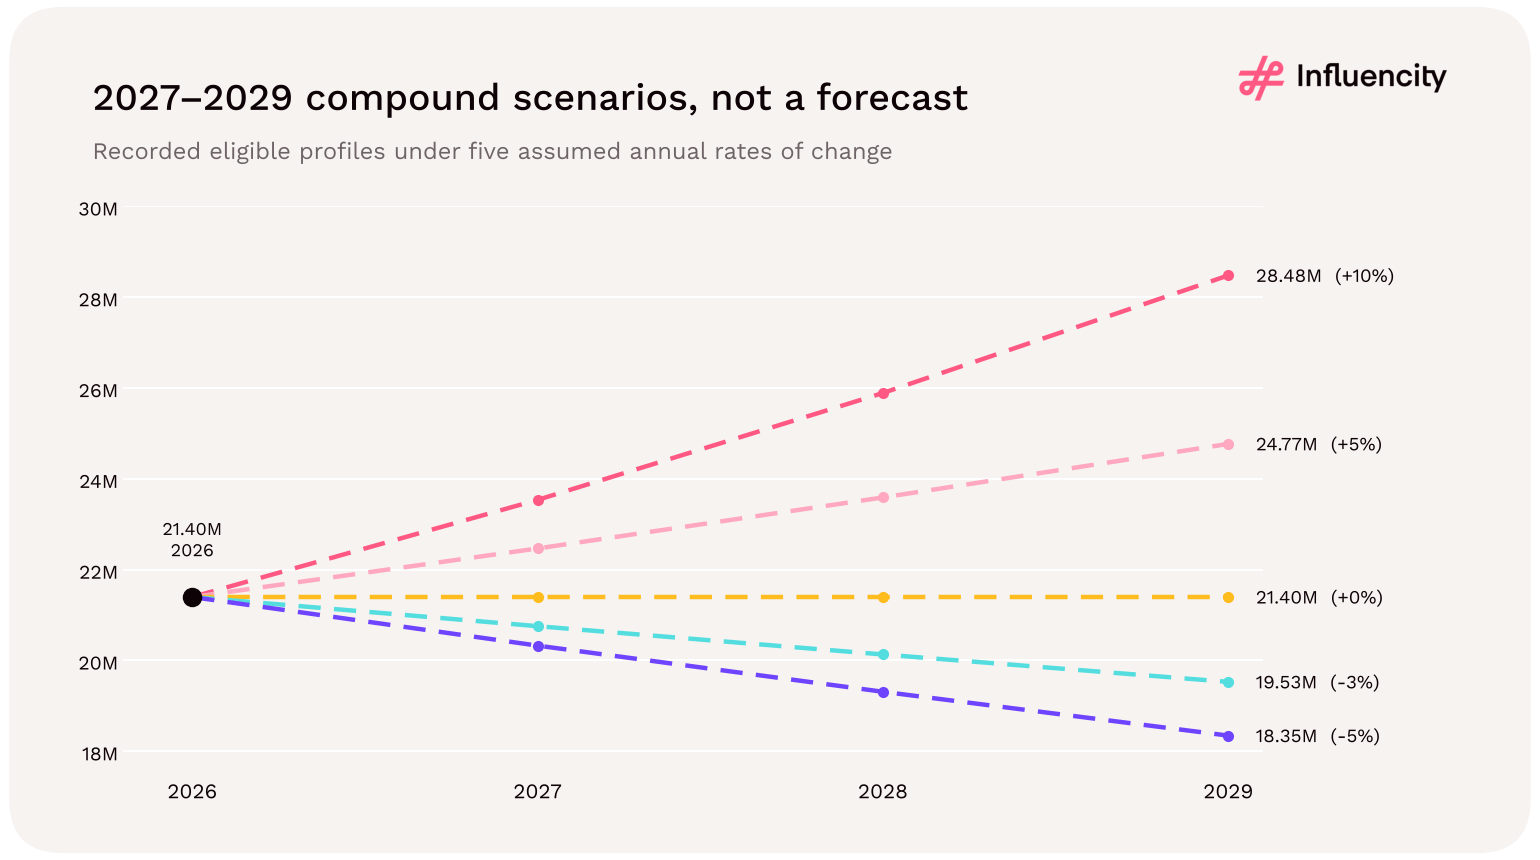
Keep a cross-market scorecard
Record the same five numbers for every market: qualified candidates, reply rate, activation rate, cost per activated creator and the primary outcome metric. After two or three campaigns this becomes your own European benchmark, which no market-level count can provide.
Measure the outcome each campaign was designed to produce, with the same definitions in every market. Then, track the recruitment funnel from screened profiles to active partners. Eligible profiles are not available partners: shortlist and activation yields set real capacity.
From market map to measurable roster
Use the country tables to decide where to investigate. Use current creator and audience evidence to decide whom to recruit. Use campaign outcomes to decide where to scale. Explore Influencity
The following compound-growth scenarios illustrate the effect of alternative assumptions on the 2026 profile count. They are not predictions, confidence intervals or estimates fitted to the historical publication.
| Year | Flat: 0% | Illustrative: 5% | Illustrative: 10% |
|---|---|---|---|
| 2026 | 21,397,089 | 21,397,089 | 21,397,089 |
| 2027 | 21,397,089 | 22,466,943 | 23,536,798 |
| 2028 | 21,397,089 | 23,590,291 | 25,890,478 |
| 2029 | 21,397,089 | 24,769,805 | 28,479,525 |

Figure 37 → Scenarios apply selected constant growth assumptions to recorded profile counts; they do not model future users or density. Source: [1], with analyst-selected assumptions.
The flat case is not a lower bound: recorded counts could also fall. For comparison, the US TikTok study's snapshot-rate extension uses 12.67% a year; applying a mechanical rate to Europe's rounded 2023 figure (about 12.6%) would be similarly unreliable, which is why it is not shown. [1, 4]
Because recorded counts could also fall, two illustrative contraction rates are shown for symmetry. As with the growth cases, they carry no probabilities. [1]
| Year | Illustrative: −3% | Illustrative: −5% |
|---|---|---|
| 2027 | 20,755,176 | 20,327,235 |
| 2028 | 20,132,521 | 19,310,873 |
| 2029 | 19,528,545 | 18,345,329 |
Across the five cases, the 2029 recorded pool ranges from about 18.3M to 28.5M profiles. The width of that range is the main message: after three years, the lowest and highest cases are more than 10M profiles apart.
What would move the number
Changes in eligibility thresholds or database coverage; platform policy or regulatory changes affecting TikTok in individual markets; creator churn and account inactivity; and shifts in the audience estimates used as denominators.
This study analyses Influencity's proprietary 2026 TikTok creator data for 30 European markets, aggregated by country, gender classification and follower tier. Regional totals, shares and ratios are calculated from the 30 country figures. Influencity's 2026 Instagram data for the same markets provide the cross-platform comparison [2]; the companion US studies provide the regional comparison [4, 5]; and two Influencity category studies supply context in section 16 [7, 8].
The footprint comprises Austria, Belgium, Bulgaria, Croatia, Cyprus, Czech Republic, Denmark, Estonia, Finland, France, Germany, Greece, Hungary, Ireland, Italy, Latvia, Lithuania, Luxembourg, Malta, Netherlands, Poland, Portugal, Romania, Slovakia, Slovenia, Spain, Sweden, the United Kingdom, Russia and Switzerland. The country label is Influencity's market assignment; it does not establish nationality, legal residence or follower location. Counts refer to profiles rather than distinct people.
The data are a point-in-time snapshot observed in October–November 2026, not full-year 2026 results; population figures are 2026 references. The estimated-user figure is an audience estimate, not a count of monthly active users. Male, female and no-gender are Influencity classification categories; classified-only shares use male plus female as the denominator. Follower tiers use four bands: nano, micro, macro and mega.
This study is part of Influencity's regional research series. The 2026 Instagram editions cover Europe, the United States and Latin America. Earlier European Instagram editions were published in 2020 and 2023, and the 2023 TikTok study covered both Europe and the US.
| Measure | Calculation | Denominator safeguard |
|---|---|---|
| Creator density | Eligible profiles / estimated users × 100 | Not creators as a share of residents |
| Country supply share | Country profiles / all covered profiles × 100 | Use the same country footprint |
| Audience penetration | Estimated users / reference population × 100 | Not verified unique-resident adoption |
| Profiles per 1,000 residents | Eligible profiles / population × 1,000 | Supply relative to residents (sections 02, 05, 15) |
| Female share, classified | Female / (female + male) × 100 | Exclude no-gender records explicitly |
| Unclassified share | No-gender records / total profiles × 100 | Include all recorded profiles |
| Density index | Country density / regional density | Regional density is the weighted ratio |
| Tier share, 29 markets | Tier entries / all tier entries in the stated subset | Do not mix 29- and 30-country inputs |
| Measure | Calculation | Interpretation |
|---|---|---|
| Users per eligible profile | Estimated users ÷ eligible profiles | Market-level ratio, not individual reach |
| HHI and effective number of markets | Sum of squared % shares; 10,000 ÷ HHI | Concentration of supply, users or population |
| Nano / 10k+ entries per 100 users | Tier entries ÷ estimated users × 100 | 29 markets excl. Austria |
| 10k+ share | (Micro + macro + mega) ÷ all tier entries | Tier mix, not performance |
| Mega per 1M users | Mega entries ÷ estimated users × 1,000,000 | Relative availability of 1M+ accounts |
| Spearman rank correlation | Correlation of country rankings | Direction and strength; not causation |
| Market archetypes | ≥1M profiles; density above or below 8.48% | Planning shorthand |
| Niche mix | Niche-tagged profiles ÷ all niche tags in the market | Comparable across markets despite different tagging coverage |
| Niche index | Market’s niche share ÷ seven-market average × 100 | Above 100 = over-represented niche |
| Group | Markets |
|---|---|
| Western (9) | Austria, Belgium, France, Germany, Ireland, Luxembourg, Netherlands, Switzerland, United Kingdom |
| Southern (6) | Cyprus, Greece, Italy, Malta, Portugal, Spain |
| Nordic (3) | Denmark, Finland, Sweden |
| Central & Eastern (11) | Bulgaria, Croatia, Czech Republic, Estonia, Hungary, Latvia, Lithuania, Poland, Romania, Slovakia, Slovenia |
| Russia (1) | Russia, shown separately because of its size |
Analytical groupings for this study; they are not official geographic or political classifications.
Country population, user and profile figures sum to the regional totals, and each country's profile count equals its male, female and no-gender components. The follower-tier figures do not fully reconcile: Austria's macro-tier figure exceeds its total profile count, so all tier analysis excludes Austria. Across the other 29 markets, tier entries differ from profile counts by 0.12%. [1]
How many TikTok influencers are there in Europe in 2026?
Influencity's data, observed in October–November 2026, record 21,397,089 influencer-eligible TikTok profiles across 30 European markets. The count describes eligible profiles, not unique professional creators. [1]
How many TikTok users does the European dataset include?
Influencity estimates 252,341,000 TikTok users across the same 30 markets. This is the study's estimated audience field, not a verified monthly-active-user count. [1]
What is TikTok creator density in Europe?
Creator density is 8.48%: 21,397,089 eligible profiles divided by 252,341,000 estimated users, multiplied by 100. It is not the share of residents working as influencers. [1]
Which European country has the most TikTok influencers?
Russia has the largest recorded pool, at 3,523,007 eligible profiles. France is second with 2,708,112 and the United Kingdom third with 2,694,094. [1]
Which country has the highest TikTok creator density?
Romania, at 18.11%, based on 1,577,542 profiles and 8,710,000 estimated users. Bulgaria and Hungary follow at 13.54% and 12.48%. [1]
Does TikTok have more creators than Instagram in Europe?
Across the matched footprint, TikTok has 72.5% more eligible profiles and about twice the creator density: 8.48% versus 4.21%. TikTok has more profiles in 29 of 30 countries; Portugal is the exception. [1, 2]
How does European TikTok compare with the US?
Europe has 47.9% more eligible TikTok profiles (21.40M vs 14.47M) but slightly lower creator density (8.48% vs 9.46%). Its classified creator base is much less female-skewed (54.43% vs 63.1%). In both regions TikTok's density is about twice Instagram's. [1, 4]
Are most European TikTok influencers women?
Female-classified profiles are 54.43% of the male/female-classified total and 42.10% of all eligible profiles; 22.65% have no gender classification. Six markets have male majorities. [1]
Are nano-influencers the largest TikTok tier in Europe?
Yes. Across 29 markets (Austria is excluded because its macro-tier figure exceeds its profile count), nano entries represent 90.00% of tier entries and micro entries 8.99%; nano and micro together are 98.99%. [1]
Do micro-influencers perform better on TikTok?
This study does not measure performance. In Influencity's 2025 US and Mexico supplements study, creators under 100k followers averaged a reported 57% engagement rate against 24% above 1M across platforms, and micro-influencers on TikTok ranked highest in audience trust. Test it in your European markets. [7]
Does high creator density mean lower prices or better results?
No. Density describes recorded creator supply relative to estimated users. This study does not measure fees, availability, engagement quality, conversions or return on investment.
Are the 2027–2029 figures a forecast?
No. They are compound-change scenarios: growth of 0%, 5% and 10% a year, and contraction of 3% and 5% a year. None carries a probability.
How many TikTok influencers are there in France?
Influencity’s 2026 data record 2,708,112 influencer-eligible TikTok profiles in France, 12.7% of the 30-market European pool, at 11.57% creator density. [1]
How many TikTok influencers are there in the UK?
The UK records 2,694,094 eligible TikTok profiles in 2026, against 26.8M estimated TikTok users: 10.05% creator density. It has the highest female share of classified profiles in the study (60.89%). [1]
How many TikTok influencers are there in Germany?
Germany records 2,306,700 eligible TikTok profiles in 2026 at 9.73% creator density. It is one of six European markets where male-classified profiles outnumber female-classified ones. [1]
How many TikTok influencers are there in Spain?
Spain records 1,436,110 eligible TikTok profiles in 2026 at 6.87% creator density, below the 8.48% European benchmark. Its Instagram pool is almost as large (1,340,770). [1, 2]
How many TikTok influencers are there in Italy?
Italy records 1,993,272 eligible TikTok profiles in 2026 at 9.06% creator density, the fifth-largest pool in the study. [1]
How many TikTok influencers are there in Poland?
Poland records 1,165,571 eligible TikTok profiles in 2026 at 9.40% creator density, 3.16 times its Instagram count. [1, 2]

Which European country has the most TikTok creators per resident?
Romania, with 83.9 eligible TikTok profiles per 1,000 residents in 2026, against 31.9 across the 30 markets. Denmark has the fewest, 17.8. [1]
Which European country has the lowest TikTok creator density?
Russia, at 5.28%: 3,523,007 eligible profiles against 66.7M estimated users. It is also the largest pool, so it pulls down the regional benchmark. [1]
Where are Europe’s mega TikTok influencers?
The study records 13,296 mega entries (1M+ followers) across the 29 markets in its tier view. Russia (3,010), the UK (2,467), France (2,096), Spain (1,715) and Germany (1,511) hold 81.2% of them. [1]
Which European countries have more male than female TikTok influencers?
Six markets have male majorities among classified profiles: Luxembourg (60.25% male), Slovenia, Switzerland, Austria, Germany and Malta. [1]
Is Instagram bigger than TikTok anywhere in Europe?
Only in Portugal, by eligible profile count: 302,624 on Instagram against 265,210 on TikTok. TikTok still has higher creator density there because its estimated audience is smaller. [1, 2]
Which European region has the highest TikTok creator density?
Central and Eastern Europe, at 12.06% across 11 markets, and 10.02% excluding Romania. Russia has the lowest, 5.28%. [1]
Is the European TikTok creator market concentrated?
Moderately. The top eight markets hold 81.3% of eligible profiles, but supply is less concentrated than the audience: profiles behave like 10.6 equal-sized markets and users like 8.4. [1]
What are the most popular TikTok influencer niches in Europe?
In the seven largest European TikTok creator markets, beauty and tech & gaming are the leading niches, together averaging 46.6% of each market’s niche tags in 2026. Fashion, travel, food and wellness follow, with wide differences between markets. [1]
Which European country has the most wellness TikTok influencers?
Relative to its niche mix, the UK: wellness accounts for 25.0% of UK niche tags in 2026, more than twice the seven-market average, and is the UK’s largest niche. Germany is second (13.3%). [1]
Are European TikTok gaming influencers mostly male?
Mostly, but not everywhere. Across seven markets, 44.9% of classified tech & gaming creators are female, the only niche below parity. In the UK the niche is at parity (50.8% female). [1]
| Country | Population | Estimated users | Eligible profiles | Creator density | Users / population |
|---|---|---|---|---|---|
| Austria | 9,107,266 | 2,490,000 | 199,153 | 8.00% | 27.34% |
| Belgium | 11,774,642 | 4,030,000 | 306,345 | 7.60% | 34.23% |
| Bulgaria | 6,667,659 | 2,630,000 | 356,203 | 13.54% | 39.44% |
| Croatia | 3,822,345 | 1,310,000 | 90,556 | 6.91% | 34.27% |
| Cyprus | 1,382,334 | 600,000 | 51,993 | 8.67% | 43.40% |
| Czech Republic | 10,527,781 | 2,130,000 | 239,362 | 11.24% | 20.23% |
| Denmark | 6,023,520 | 1,490,000 | 107,018 | 7.18% | 24.74% |
| Estonia | 1,331,062 | 412,000 | 28,184 | 6.84% | 30.95% |
| Finland | 5,621,739 | 1,620,000 | 127,610 | 7.88% | 28.82% |
| France | 66,746,401 | 23,400,000 | 2,708,112 | 11.57% | 35.06% |
| Germany | 83,644,258 | 23,700,000 | 2,306,700 | 9.73% | 28.33% |
| Greece | 9,897,115 | 4,600,000 | 351,255 | 7.64% | 46.48% |
| Hungary | 9,585,818 | 3,400,000 | 424,432 | 12.48% | 35.47% |
| Ireland | 5,356,950 | 2,590,000 | 167,495 | 6.47% | 48.35% |
| Italy | 58,926,166 | 22,000,000 | 1,993,272 | 9.06% | 37.33% |
| Latvia | 1,835,935 | 836,000 | 56,834 | 6.80% | 45.54% |
| Lithuania | 2,797,338 | 1,040,000 | 77,596 | 7.46% | 37.18% |
| Luxembourg | 687,448 | 217,000 | 23,171 | 10.68% | 31.57% |
| Malta | 549,011 | 263,000 | 19,283 | 7.33% | 47.90% |
| Netherlands | 18,448,775 | 6,300,000 | 466,499 | 7.40% | 34.15% |
| Poland | 37,843,188 | 12,400,000 | 1,165,571 | 9.40% | 32.77% |
| Portugal | 10,395,362 | 4,110,000 | 265,210 | 6.45% | 39.54% |
| Romania | 18,800,605 | 8,710,000 | 1,577,542 | 18.11% | 46.33% |
| Russia | 143,394,458 | 66,700,000 | 3,523,007 | 5.28% | 46.52% |
| Slovakia | 5,451,342 | 1,150,000 | 111,502 | 9.70% | 21.10% |
| Slovenia | 2,114,573 | 543,000 | 40,089 | 7.38% | 25.68% |
| Spain | 47,850,793 | 20,900,000 | 1,436,110 | 6.87% | 43.68% |
| Sweden | 10,701,047 | 3,510,000 | 311,761 | 8.88% | 32.80% |
| Switzerland | 9,007,798 | 2,460,000 | 171,130 | 6.96% | 27.31% |
| United Kingdom | 69,931,528 | 26,800,000 | 2,694,094 | 10.05% | 38.32% |
| TOTAL | 670,224,257 | 252,341,000 | 21,397,089 | 8.48% | 37.65% |
Source: [1]. Density = eligible profiles ÷ estimated users × 100; users / population = estimated users ÷ population × 100. Regional totals are ratios of sums.
| Country | Male | Female | No gender | Female / classified | No gender / all |
|---|---|---|---|---|---|
| Austria | 81,567 | 75,382 | 42,204 | 48.03% | 21.19% |
| Belgium | 117,024 | 134,754 | 54,567 | 53.52% | 17.81% |
| Bulgaria | 134,907 | 168,812 | 52,484 | 55.58% | 14.73% |
| Croatia | 33,984 | 37,006 | 19,566 | 52.13% | 21.61% |
| Cyprus | 21,176 | 24,011 | 6,806 | 53.14% | 13.09% |
| Czech Republic | 77,726 | 105,235 | 56,401 | 57.52% | 23.56% |
| Denmark | 36,528 | 50,036 | 20,454 | 57.80% | 19.11% |
| Estonia | 9,119 | 11,562 | 7,503 | 55.91% | 26.62% |
| Finland | 42,331 | 50,793 | 34,486 | 54.54% | 27.02% |
| France | 989,415 | 1,110,335 | 608,362 | 52.88% | 22.46% |
| Germany | 899,768 | 879,750 | 527,182 | 49.44% | 22.85% |
| Greece | 147,576 | 150,778 | 52,901 | 50.54% | 15.06% |
| Hungary | 147,142 | 201,712 | 75,578 | 57.82% | 17.81% |
| Ireland | 54,657 | 76,186 | 36,652 | 58.23% | 21.88% |
| Italy | 747,521 | 860,188 | 385,563 | 53.50% | 19.34% |
| Latvia | 18,852 | 24,254 | 13,728 | 56.27% | 24.15% |
| Lithuania | 26,038 | 33,348 | 18,210 | 56.15% | 23.47% |
| Luxembourg | 11,257 | 7,428 | 4,486 | 39.75% | 19.36% |
| Malta | 8,489 | 8,394 | 2,400 | 49.72% | 12.45% |
| Netherlands | 154,508 | 195,892 | 116,099 | 55.91% | 24.89% |
| Poland | 345,819 | 496,025 | 323,727 | 58.92% | 27.77% |
| Portugal | 91,904 | 138,447 | 34,859 | 60.10% | 13.14% |
| Romania | 651,787 | 701,975 | 223,780 | 51.85% | 14.19% |
| Russia | 1,169,985 | 1,238,722 | 1,114,300 | 51.43% | 31.63% |
| Slovakia | 37,428 | 52,193 | 21,881 | 58.24% | 19.62% |
| Slovenia | 15,847 | 14,366 | 9,876 | 47.55% | 24.64% |
| Spain | 462,584 | 685,628 | 287,898 | 59.71% | 20.05% |
| Sweden | 115,545 | 130,545 | 65,671 | 53.05% | 21.06% |
| Switzerland | 71,199 | 65,387 | 34,544 | 47.87% | 20.19% |
| United Kingdom | 821,296 | 1,278,746 | 594,052 | 60.89% | 22.05% |
| TOTAL | 7,542,979 | 9,007,890 | 4,846,220 | 54.43% | 22.65% |
Source: [1]. Influencity classifications, not self-reported identity categories.
| Country | Nano | Micro | Macro | Mega | Tier gap |
|---|---|---|---|---|---|
| Austria | 181,161 | 16,174 | 694,027 | 96 | +692,305 |
| Belgium | 279,485 | 23,666 | 2,176 | 118 | -900 |
| Bulgaria | 336,855 | 18,632 | 870 | 8 | +162 |
| Croatia | 85,109 | 4,922 | 379 | 10 | -136 |
| Cyprus | 48,530 | 3,156 | 209 | 18 | -80 |
| Czech Republic | 222,597 | 15,306 | 1,095 | 19 | -345 |
| Denmark | 96,895 | 9,118 | 833 | 38 | -134 |
| Estonia | 26,068 | 1,914 | 131 | 11 | -60 |
| Finland | 118,213 | 8,455 | 686 | 43 | -213 |
| France | 2,388,847 | 283,376 | 29,299 | 2,096 | -4,494 |
| Germany | 2,055,838 | 224,863 | 21,846 | 1,511 | -2,642 |
| Greece | 329,787 | 19,617 | 1,306 | 30 | -515 |
| Hungary | 397,466 | 25,218 | 1,431 | 19 | -298 |
| Ireland | 152,373 | 13,563 | 1,256 | 86 | -217 |
| Italy | 1,811,474 | 163,626 | 14,989 | 1,002 | -2,181 |
| Latvia | 52,790 | 3,702 | 253 | 9 | -80 |
| Lithuania | 72,653 | 4,641 | 259 | 8 | -35 |
| Luxembourg | 21,435 | 1,539 | 150 | 6 | -41 |
| Malta | 18,139 | 1,034 | 77 | 1 | -32 |
| Netherlands | 423,273 | 38,387 | 3,960 | 230 | -649 |
| Poland | 1,071,642 | 84,181 | 7,193 | 343 | -2,212 |
| Portugal | 245,307 | 18,074 | 1,383 | 74 | -372 |
| Romania | 1,472,122 | 97,826 | 5,708 | 178 | -1,708 |
| Russia | 3,111,355 | 356,351 | 49,189 | 3,010 | -3,102 |
| Slovakia | 104,908 | 6,064 | 378 | 12 | -140 |
| Slovenia | 37,234 | 2,716 | 167 | 7 | +35 |
| Spain | 1,265,470 | 147,676 | 19,063 | 1,715 | -2,186 |
| Sweden | 282,437 | 26,143 | 2,576 | 129 | -476 |
| Switzerland | 153,576 | 15,668 | 1,526 | 98 | -262 |
| United Kingdom | 2,373,319 | 282,967 | 32,318 | 2,467 | -3,023 |
| TOTAL | 19,236,358 | 1,918,575 | 894,733 | 13,296 | +665,969 |
Source: [1]. Tier gap = sum of tier entries minus eligible profiles. Austria's macro-tier figure is anomalous and is excluded from tier analysis.
| Country | TikTok profiles | Instagram profiles | TikTok density | Instagram density | Profile multiple |
|---|---|---|---|---|---|
| Austria | 199,153 | 124,086 | 8.00% | 3.70% | 1.60x |
| Belgium | 306,345 | 155,294 | 7.60% | 3.04% | 1.97x |
| Bulgaria | 356,203 | 60,718 | 13.54% | 3.11% | 5.87x |
| Croatia | 90,556 | 45,451 | 6.91% | 2.93% | 1.99x |
| Cyprus | 51,993 | 42,317 | 8.67% | 5.57% | 1.23x |
| Czech Republic | 239,362 | 115,893 | 11.24% | 2.93% | 2.07x |
| Denmark | 107,018 | 95,119 | 7.18% | 3.59% | 1.13x |
| Estonia | 28,184 | 17,387 | 6.84% | 3.48% | 1.62x |
| Finland | 127,610 | 86,491 | 7.88% | 3.60% | 1.48x |
| France | 2,708,112 | 873,651 | 11.57% | 3.10% | 3.10x |
| Germany | 2,306,700 | 972,862 | 9.73% | 3.11% | 2.37x |
| Greece | 351,255 | 239,580 | 7.64% | 5.21% | 1.47x |
| Hungary | 424,432 | 79,533 | 12.48% | 2.79% | 5.34x |
| Ireland | 167,495 | 124,782 | 6.47% | 4.80% | 1.34x |
| Italy | 1,993,272 | 1,656,396 | 9.06% | 5.54% | 1.20x |
| Latvia | 56,834 | 26,244 | 6.80% | 3.56% | 2.17x |
| Lithuania | 77,596 | 33,259 | 7.46% | 3.33% | 2.33x |
| Luxembourg | 23,171 | 7,800 | 10.68% | 2.69% | 2.97x |
| Malta | 19,283 | 14,450 | 7.33% | 5.27% | 1.33x |
| Netherlands | 466,499 | 336,304 | 7.40% | 4.13% | 1.39x |
| Poland | 1,165,571 | 368,368 | 9.40% | 2.97% | 3.16x |
| Portugal | 265,210 | 302,624 | 6.45% | 4.77% | 0.88x |
| Romania | 1,577,542 | 215,101 | 18.11% | 3.59% | 7.33x |
| Russia | 3,523,007 | 2,880,629 | 5.28% | 4.51% | 1.22x |
| Slovakia | 111,502 | 52,061 | 9.70% | 2.97% | 2.14x |
| Slovenia | 40,089 | 26,577 | 7.38% | 3.70% | 1.51x |
| Spain | 1,436,110 | 1,340,770 | 6.87% | 5.08% | 1.07x |
| Sweden | 311,761 | 182,287 | 8.88% | 3.28% | 1.71x |
| Switzerland | 171,130 | 138,249 | 6.96% | 3.64% | 1.24x |
| United Kingdom | 2,694,094 | 1,790,398 | 10.05% | 5.04% | 1.50x |
| TOTAL | 21,397,089 | 12,404,681 | 8.48% | 4.21% | 1.72x |
Sources: [1, 2]. Profile multiple = TikTok ÷ Instagram profiles. The two platforms' profiles are not deduplicated people.
| Country | Per 1,000 residents | Users per profile | Density index | Nano per 100 users | 10k+ per 100 users | 10k+ share | Mega per 1M users | TikTok ÷ IG profiles |
|---|---|---|---|---|---|---|---|---|
| Austria | 21.9 | 12.5 | 0.94x | — | — | — | — | 1.60x |
| Belgium | 26.0 | 13.2 | 0.90x | 6.94 | 0.64 | 8.5% | 29.3 | 1.97x |
| Bulgaria | 53.4 | 7.4 | 1.60x | 12.81 | 0.74 | 5.5% | 3.0 | 5.87x |
| Croatia | 23.7 | 14.5 | 0.82x | 6.50 | 0.41 | 5.9% | 7.6 | 1.99x |
| Cyprus | 37.6 | 11.5 | 1.02x | 8.09 | 0.56 | 6.5% | 30.0 | 1.23x |
| Czech Republic | 22.7 | 8.9 | 1.33x | 10.45 | 0.77 | 6.9% | 8.9 | 2.07x |
| Denmark | 17.8 | 13.9 | 0.85x | 6.50 | 0.67 | 9.3% | 25.5 | 1.13x |
| Estonia | 21.2 | 14.6 | 0.81x | 6.33 | 0.50 | 7.3% | 26.7 | 1.62x |
| Finland | 22.7 | 12.7 | 0.93x | 7.30 | 0.57 | 7.2% | 26.5 | 1.48x |
| France | 40.6 | 8.6 | 1.36x | 10.21 | 1.35 | 11.6% | 89.6 | 3.10x |
| Germany | 27.6 | 10.3 | 1.15x | 8.67 | 1.05 | 10.8% | 63.8 | 2.37x |
| Greece | 35.5 | 13.1 | 0.90x | 7.17 | 0.46 | 6.0% | 6.5 | 1.47x |
| Hungary | 44.3 | 8.0 | 1.47x | 11.69 | 0.78 | 6.3% | 5.6 | 5.34x |
| Ireland | 31.3 | 15.5 | 0.76x | 5.88 | 0.58 | 8.9% | 33.2 | 1.34x |
| Italy | 33.8 | 11.0 | 1.07x | 8.23 | 0.82 | 9.0% | 45.5 | 1.20x |
| Latvia | 31.0 | 14.7 | 0.80x | 6.31 | 0.47 | 7.0% | 10.8 | 2.17x |
| Lithuania | 27.7 | 13.4 | 0.88x | 6.99 | 0.47 | 6.3% | 7.7 | 2.33x |
| Luxembourg | 33.7 | 9.4 | 1.26x | 9.88 | 0.78 | 7.3% | 27.6 | 2.97x |
| Malta | 35.1 | 13.6 | 0.86x | 6.90 | 0.42 | 5.8% | 3.8 | 1.33x |
| Netherlands | 25.3 | 13.5 | 0.87x | 6.72 | 0.68 | 9.1% | 36.5 | 1.39x |
| Poland | 30.8 | 10.6 | 1.11x | 8.64 | 0.74 | 7.9% | 27.7 | 3.16x |
| Portugal | 25.5 | 15.5 | 0.76x | 5.97 | 0.48 | 7.4% | 18.0 | 0.88x |
| Romania | 83.9 | 5.5 | 2.14x | 16.90 | 1.19 | 6.6% | 20.4 | 7.33x |
| Russia | 24.6 | 18.9 | 0.62x | 4.66 | 0.61 | 11.6% | 45.1 | 1.22x |
| Slovakia | 20.5 | 10.3 | 1.14x | 9.12 | 0.56 | 5.8% | 10.4 | 2.14x |
| Slovenia | 19.0 | 13.5 | 0.87x | 6.86 | 0.53 | 7.2% | 12.9 | 1.51x |
| Spain | 30.0 | 14.6 | 0.81x | 6.05 | 0.81 | 11.7% | 82.1 | 1.07x |
| Sweden | 29.1 | 11.3 | 1.05x | 8.05 | 0.82 | 9.3% | 36.8 | 1.71x |
| Switzerland | 19.0 | 14.4 | 0.82x | 6.24 | 0.70 | 10.1% | 39.8 | 1.24x |
| United Kingdom | 38.5 | 9.9 | 1.19x | 8.86 | 1.19 | 11.8% | 92.1 | 1.50x |
| TOTAL / REGION | 31.9 | 11.8 | 1.00x | 7.63 | 0.85 | 10.0% | 53.2 | 1.72x |
Sources: [1, 2]. Tier-based columns exclude Austria; regional tier values cover 29 markets.
[1] Influencity. (2026). Proprietary TikTok creator data: 30 European markets by country, gender classification and follower tier.
[2] Influencity. (2026). Proprietary Instagram creator data: the same 30 European markets.
[3] Influencity. (2023). TikTok Statistics To Know in 2023. European and US sections.
[4] Influencity. (2026). TikTok Influencer Marketing in the United States: 2026 Study.
[5] Influencity. (2026). Instagram Influencer Marketing in the United States: 2026 Study.
[6] Influencity. (2026). Instagram Influencer Marketing in Europe: 2026 Study.
[7] Influencity. (2025). The Influence Effect: How Social Media Creators Shape Consumer Perception and Purchasing Behavior in the Supplements Industry. 5,000+ sponsored posts; TikTok, Instagram and YouTube; US and Mexico; January–June 2025.
[8] Influencity. (2025). From Feed to Fork: How Foodie Influencers Shape Restaurant Choices in the U.S. 10,568 social mentions; five US states.
[9] La Moncloa / INE Frontur. (2026). Spain received a record 96.8 million international tourists in 2025.
[10] FashionUnited. (2026). Inditex results for financial year 2025: €39.86bn sales.
[11] The Moscow Times. (2022). TikTok suspends posting of new videos from Russia. 7 March 2022.
Suggested citation
Source: Influencity, TikTok Influencer Marketing in Europe: 2026 Study. https://influencity.com/resources/studies/tiktok-influencer-marketing-europe/