Skip to content
Book a Call
Start Your Trial

Instagram Influencer Marketing in the United States 2026 Study

A state-level look at the US Instagram creator economy. Audience estimates, creator supply, concentration, follower tiers and gender classification.

Instagram Influencer Marketing in the United States 2026 Study

A state-level look at the US Instagram creator economy. Audience estimates, creator supply, concentration, follower tiers and gender classification.

Overview

The US Instagram Influencer Market at a Glance

8.94M

influencer profiles

192.6M

estimated Instagram users

4.64%

influencer density

~89%

profiles under 10k followers

Influencity's 2026 dataset records 8,943,596 influencer-eligible Instagram profiles across 50 US states and an estimated 192,606,008 Instagram users. That is 4.64 eligible profiles per 100 estimated users. California has the largest recorded creator supply, while New York has the highest creator density, at 9.80%. About 89% of eligible profiles have fewer than 10,000 followers. [1]

The national headline is only the starting point. Almost 55% of recorded creator supply sits in five states, yet some smaller markets have disproportionately large creator pools relative to their estimated Instagram audiences. For brands and agencies, the useful question is not simply how many creators exist. It is where a relevant, measurable campaign roster can be built. [1]
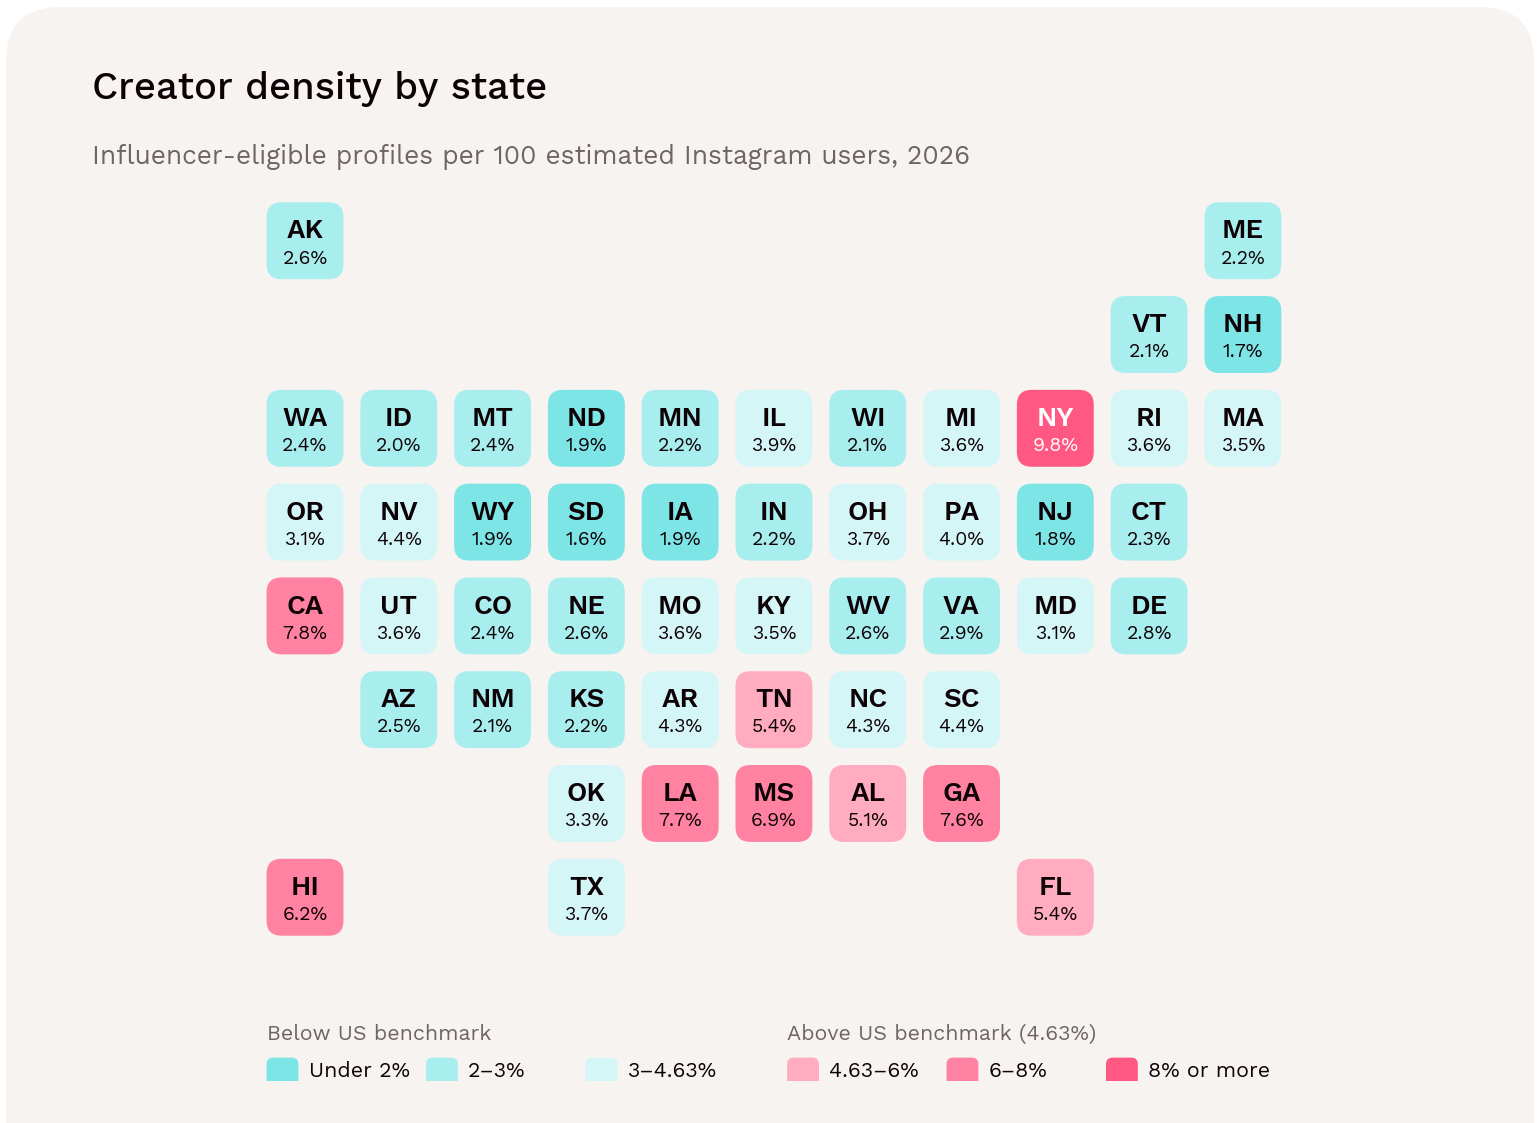
Figure 01 → US Instagram creator density by state, 2026. Geographic coverage is the 50 states; counts refer to profiles, not unique people. Source: [1].
Reading the study

Market counts are cross-platform-derived estimates, not a census of professional influencers. Creator location does not establish where followers live.

Every figure in this study has been reconciled against the source data point. Section 14 adds engagement, sentiment and disclosure evidence from other Influencity studies (supplements and food). Those figures come from different samples and are labelled with their source wherever they appear.

01 → EXECUTIVE SUMMARY

Key Findings: What the 2026 Data Reveals

  • A large recruitment universe, not a ready-made roster. The study records 8.94M eligible profiles. Eligibility alone does not demonstrate campaign experience, availability, authentic engagement or commercial results.

  • Five states hold most recorded creator supply. California, New York, Florida, Texas and Georgia contain 4.90M profiles: 54.7% of the total, against 38.8% of estimated users.

  • New York has more than twice the national creator density. Its 9.80% profile-to-user ratio is 2.11 times the national 4.64% benchmark. Only nine states are above that weighted benchmark.

  • The southern outliers deserve a closer look. Louisiana ranks third for density at 7.74%, followed by Georgia at 7.65% and Mississippi at 6.91%.

  • Large audiences and dense creator markets are different things. Texas has the highest estimated users-to-population ratio, 62.3%, but its creator density is 3.68%, below the national benchmark.

  • Nine in ten profiles are nano-sized. About 89% of eligible profiles have fewer than 10,000 followers; 10.8% have 10,000 or more. Micro, macro and mega counts reconcile in all 50 states.

  • Context from our category studies: small creators perform. In Influencity's 2025 supplements study, micro-influencers averaged a reported 57% engagement rate against 24% for celebrities, and micro-influencers made up over half of tagged posts in our food study. These are category samples, not measures of the 8.94M pool. [7, 8]

  • Gender reporting needs two denominators. Female-classified profiles represent 60.2% of classified male/female profiles, not 60.2% of all profiles. Another 21.5% have no gender classification.

Source: Influencity proprietary 2026 data, [1] Calculations use unrounded values.

US Instagram Influencer Market Overview

Metric

2026 value

What it measures

Population in covered states

341.1M

Reference population supplied in the data source

Estimated Instagram users

192.6M

Audience-estimate field, not a verified monthly-active-user count

Influencer-eligible profiles

8.94M

Recorded eligible profile count (sum of 50 state rows)

Creator density

4.64%

Eligible profiles / estimated Instagram users

Profiles per 1,000 residents

26.2

Eligible profiles / population × 1,000

Estimated audience / population

56.5%

Contextual ratio, not a verified resident adoption rate

Profiles with 10k+ followers

10.8%

Micro + macro + mega / all eligible profiles

Female share, classified profiles

60.2%

Female / (female + male)

Unclassified share, all profiles

21.5%

No-gender profiles / all eligible profiles

Source: Influencity proprietary 2026 data, [1]

02 → CREATOR SUPPLY

Which States Have the Most Instagram Influencers?

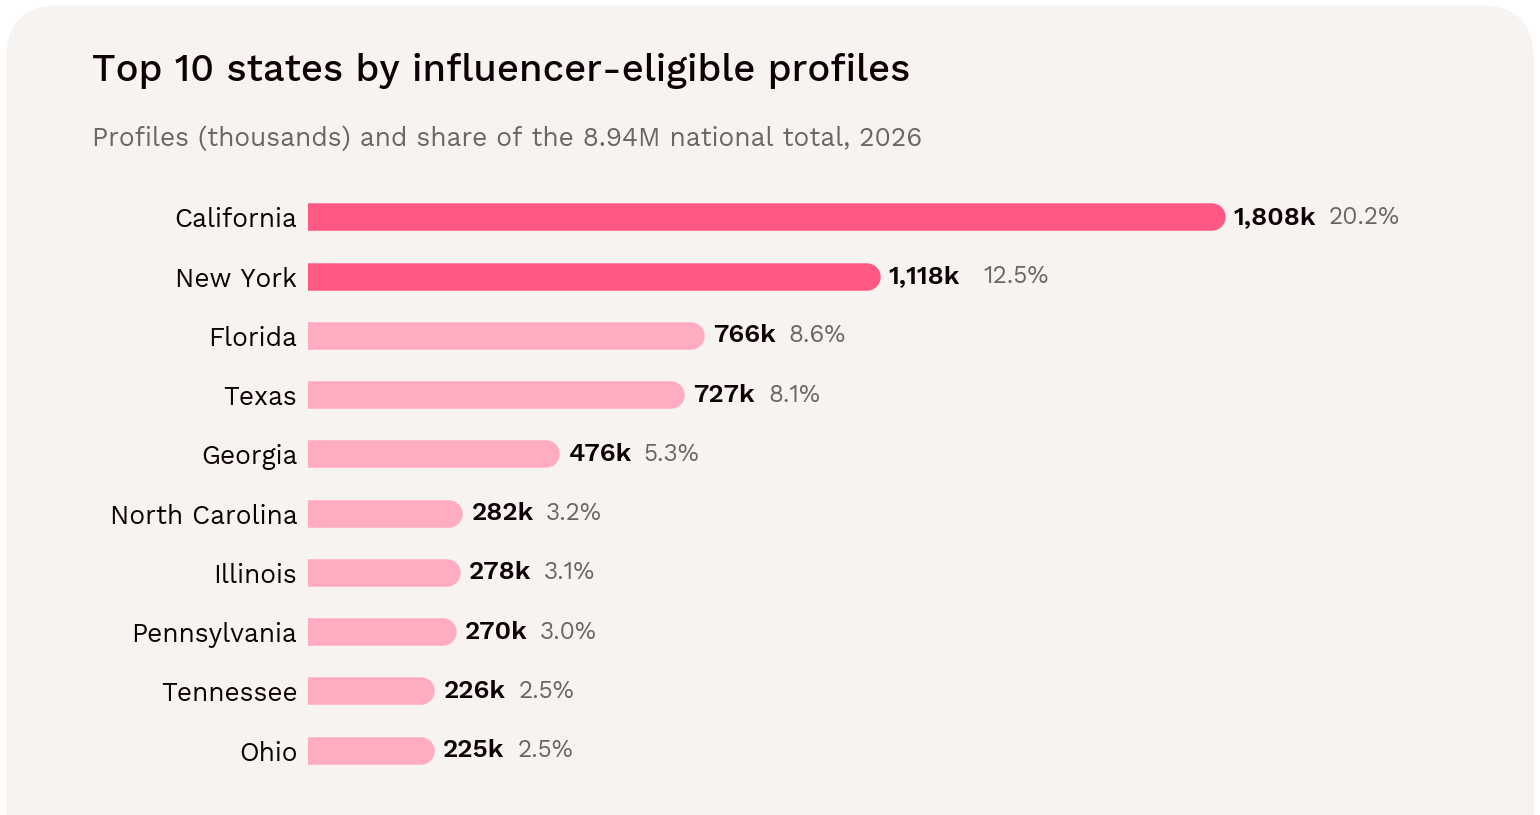
California ranks first with 1,808,298 influencer-eligible profiles, followed by New York with 1,117,842. Florida and Texas complete a top four that contains almost half (49.4%) of the recorded US creator pool. These counts describe the size of the discovery universe before any audience, category or quality filters are applied. [1]

Rank

State

Eligible profiles

Share of US total

Creator density

1

California

1,808,298

20.2%

7.79%

2

New York

1,117,842

12.5%

9.80%

3

Florida

766,282

8.6%

5.44%

4

Texas

726,574

8.1%

3.68%

5

Georgia

476,441

5.3%

7.65%

6

North Carolina

282,087

3.2%

4.25%

7

Illinois

277,980

3.1%

3.93%

8

Pennsylvania

269,909

3.0%

3.97%

9

Tennessee

226,231

2.5%

5.38%

10

Ohio

225,230

2.5%

3.70%

Source: Influencity proprietary 2026 data [1] Calculations use unrounded values.

Figure 02 → California and New York are the largest recorded Instagram creator markets. State shares use the 8,943,596-profile national total. Source: [1].

Population Sets the Broad Order

The biggest influencer markets are mostly the biggest states. Across all 50 states, a state's rank by population and its rank by eligible profiles are closely aligned (Spearman rank correlation of 0.94). California is first on both measures, and Florida is third on both. [1]

Population does not explain everything, though. The ten largest creator states hold 53.4% of the US population and 54.8% of estimated Instagram users, but 69.1% of eligible profiles. Several states rank well above or below their population size:

State

Population rank

Profile Rank

Creator density

Profiles at national density

Difference

California

1

1

7.79%

1,077,937

+730,361

New York

4

2

9.80%

529,446

+588,396

Florida

3

3

5.44%

653,671

+112,611

Texas

2

4

3.68%

916,720

−190,146

Georgia

8

5

7.65%

289,369

+187,072

North Carolina

9

6

4.25%

308,148

−26,061

Illinois

6

7

3.93%

328,157

−50,177

Pennsylvania

5

8

3.97%

315,663

−45,754

Tennessee

15

9

5.38%

195,302

+30,929

Ohio

7

10

3.70%

282,769

−57,539

Source: [1]. "Profiles at national density" applies the US ratio of 4.64% to each state's estimated Instagram users; "Difference" is recorded profiles minus that figure. Population ranks use the data source's population field.

Influencer Density, Not Instagram Adoption, Explains the Gaps

A state's creator count is the product of three things: its population, the share of residents using Instagram, and the number of creators per user (creator density). Of these, density varies far more between states, and it explains why some states punch above or below their population.

Across the 50 states, estimated Instagram use relative to population ranges only from about 47% to 62%. Influencer density ranges from 1.58% to 9.80%. Breaking down the differences in profiles per resident between states, roughly nine-tenths of the variation comes from creator density and very little from audience size. [1]

The clearest examples:

  • New York is the fourth-largest state by population and by estimated Instagram users, but second for creators. At the national density it would record about 529,000 profiles; it records 1.12M, an excess of about 588,000.
  • Texas is the second-largest state by population and has the highest estimated Instagram use relative to population (62.3%). Yet it ranks fourth for creators, because its 3.68% density is below the national figure. At the national density it would record about 190,000 more profiles.
  • Georgia and Tennessee rise well above their population ranks (8th to 5th, and 15th to 9th), while Pennsylvania, Illinois and Ohio fall below theirs.

Why Might Density Differ?

While data alone does not explain why some states have more creators per Instagram user there are three explanations worth testing.

  1. Media and creative industries. The states with the largest positive gaps include major entertainment, media and fashion centres (Los Angeles and New York City), plus Atlanta's music and screen-production scene in Georgia. Creator activity may cluster where those industries, agencies and brands are based. Section 09's niche analysis and state industry data tests this.
  2. Age profile. States with younger populations may have more creators per resident. Section 06 tests this, and finds no link
  3. How profiles are assigned to states. A creator's state reflects the location recorded for the profile, which may favour well-known hubs. Some creators may list New York or Los Angeles while living elsewhere, which would inflate those states' counts.  

What this means for campaign planning

Start broad influencer discovery in the largest states, but don't assume population size predicts creator supply. Texas has a large audience but relatively fewer creators per user. New York and Georgia offer more creator supply than their size suggests. Where a brief targets a specific state, check that state's density as well as its rank. Then confirm that shortlisted creators' followers actually live where the campaign needs them. [1]

03 → CONCENTRATION

How Concentrated Is the US Instagram Influencer Market?

California and New York together account for 32.7% of eligible profiles but only 18.0% of estimated Instagram users. The top five states hold 54.7% of profiles; the top ten hold 69.1%. The remaining 40 states still contribute 2.77M profiles, or 30.9% of supply. [1]
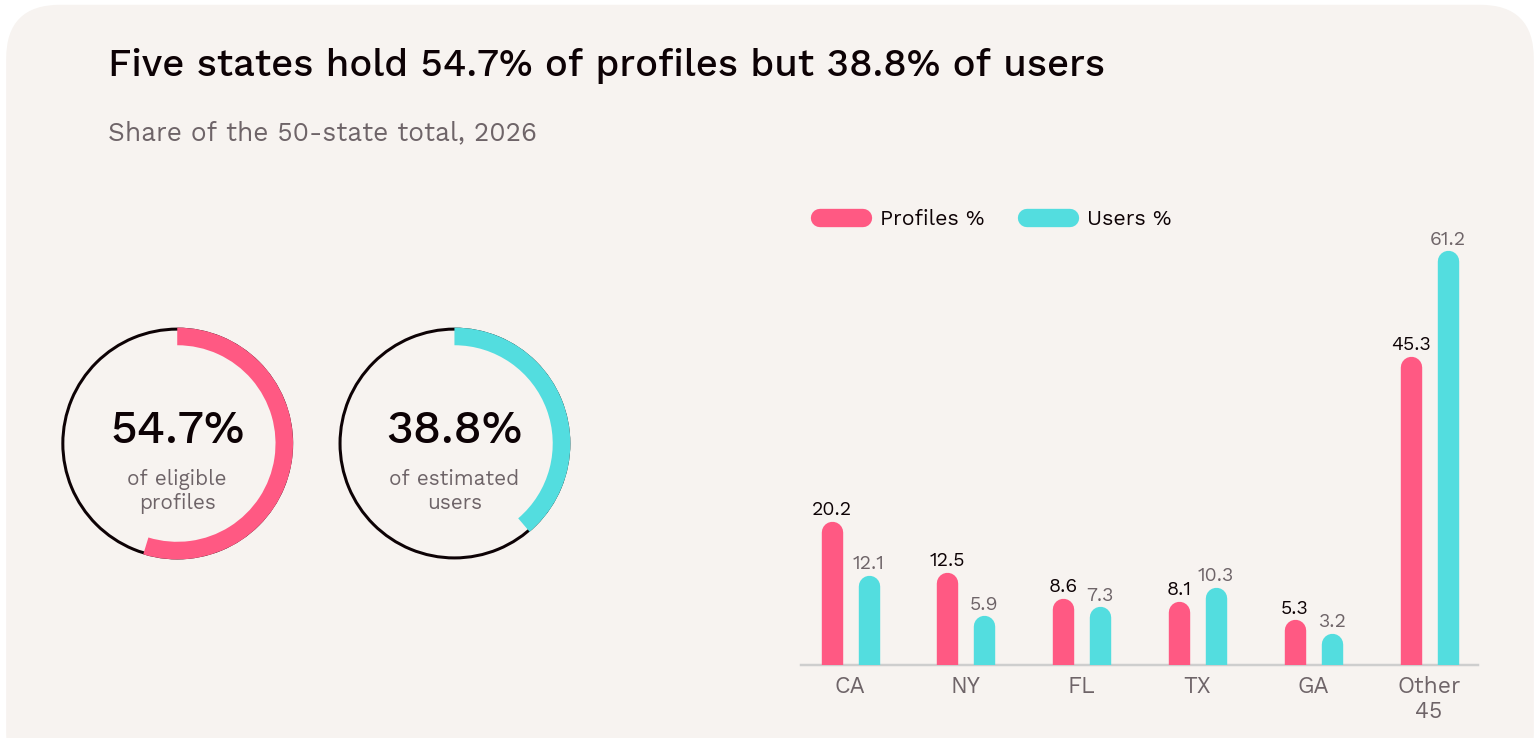
Figure 03 → Recorded creator supply is more concentrated than the estimated Instagram audience. Texas is the only top-five state whose share of users exceeds its share of profiles. Source: [1].

Instagram Influencers Are More Concentrated Than Audiences or Population

Influencer supply is clustered in fewer states than either the Instagram audience or the population. Five states account for more than half of all eligible profiles, and 17 states account for 81.0%.

The same five states hold 38.8% of estimated users and 36.9% of residents. The 25 smallest creator states contribute 9.8% of profiles but 17.3% of estimated users. [1]


Group of states (ranked by profiles)

Share of profiles

Share of estimated users

Share of population

Top 2 (California, New York)

32.7%

18.0%

17.4%

Top 5

54.7%

38.8%

36.9%

Top 10

69.1%

54.8%

53.4%

Top 20

84.8%

74.9%

73.8%

Remaining 30

15.2%

25.1%

26.2%

Source: [1] Population and user shares follow the same state ranking as profiles.

Two Standard Concentration Measures

We've used the Herfindahl–Hirschman Index, 812 for eligible profiles, against 478 for estimated users and 447 for population and effective number of states. Creator supply behaves like it is spread evenly across about 12 states. Users behave like 21 states, and population like 22.
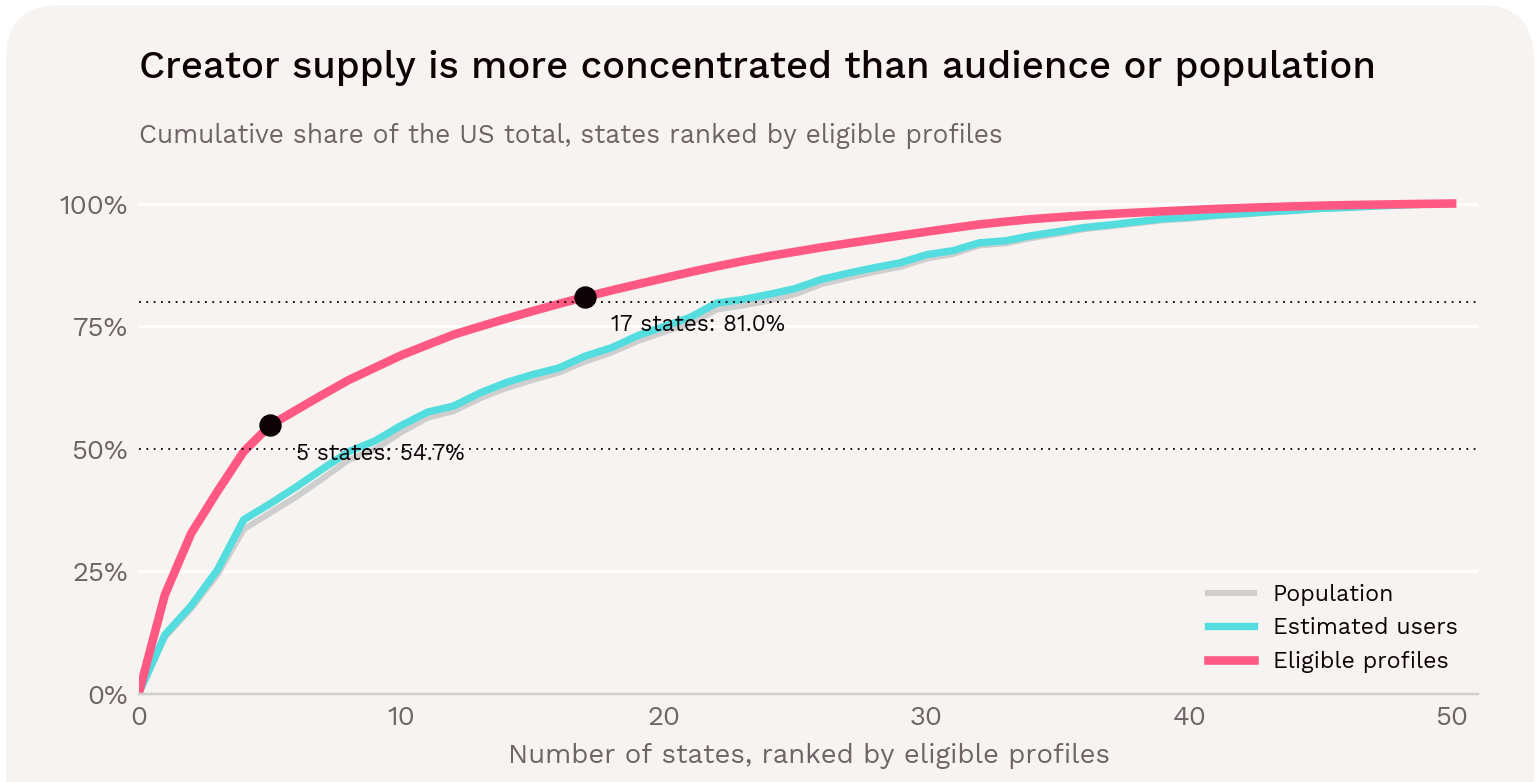
Figure 04 → Cumulative share of eligible profiles, estimated users and population, with states ranked by eligible profiles. Source: [1].

Concentration Comes from a Handful of High-Density States

Only nine states hold a larger share of creators than of users: California, New York, Florida, Georgia, Tennessee, Louisiana, Alabama, Mississippi and Hawaii. They are the same nine states whose creator density exceeds the national 4.64% benchmark.

So concentration comes from a group of states with more influencers per Instagram user than elsewhere. Section 02 sets out possible reasons, from media industries to how profiles are assigned to states. [1]

Larger Creators Are Even More Concentrated

Concentration rises with follower size. California and New York hold 32.7% of all eligible profiles, but 50.4% of micro, 67.6% of macro and 79.2% of mega profiles (section 08).

A brand looking for creators with large followings will find most of them in two states. A brand looking for smaller creators will find a far wider spread. [1]

The US Instagram Influencer Market Is Moderately Concentrated by International Standards

The top five markets hold 54.7% of US creator supply. That compares with 69.7% across Influencity's 30 European markets and 89.9% across 20 Latin American markets, where Brazil alone holds 66.1%. US supply is concentrated, but less so than in either other region (section 13). [1, 9, 10]
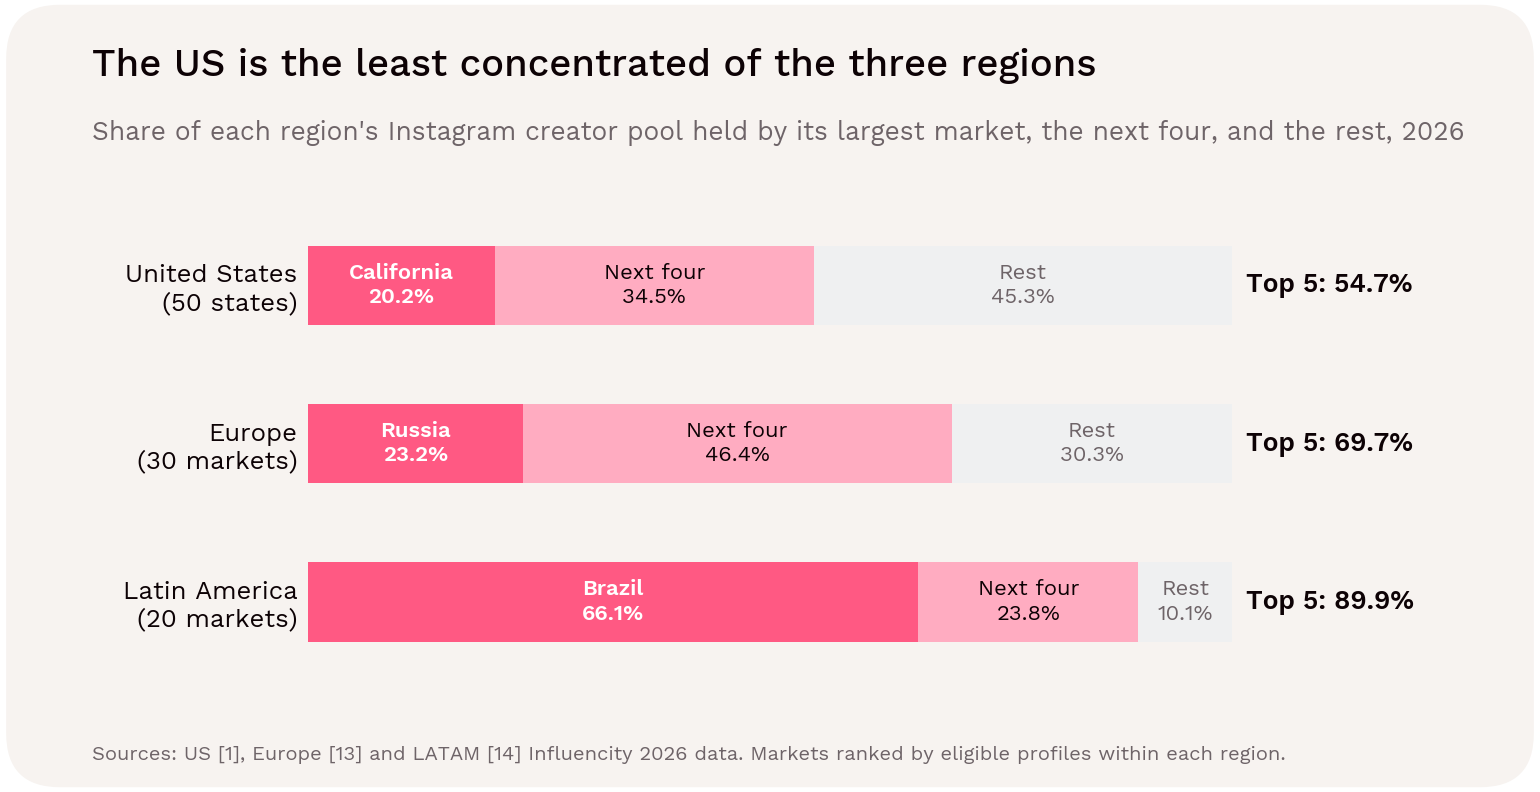
Figure 05 → Share of each region's Instagram creator pool held by its largest market, the next four markets and the rest. The US is the least concentrated of the three regions. Sources: [1, 9, 10].
 

What this means for recruitment

Use a two-track approach. Build a broad influencer roster for the major markets, then expand into additional states to test audience fit and reduce dependence on a narrow roster.

Don't let supply set the plan. A roster built only from where creators are most plentiful would over-represent five states relative to where Instagram users live. If the campaign targets a national audience, check the roster's combined follower geography rather than assuming creators' home states mirror it.

Look beyond the top states. The other 45 states hold 45.3% of creators and 61.2% of estimated users. They are where local relevance and less contested recruitment are most likely to be found, though the data doesn't measure competition or fees.

Concentration is not evidence that creators in those markets are better performers. [1]

04 → AUDIENCE CONTEXT

Where is Instagram's Estimated Audience Largest Relative to Population?

Texas has the highest estimated Instagram-users-to-population ratio according to Influencity’s data, at 62.3%. Nevada follows at 61.5%, then Arizona at 61.0%. The national ratio across the covered states is 56.5%. These are ratios of supplied estimates, not independently measured adoption rates or verified unique-user penetration. [1]


State

Estimated users

Users / population

Creator density

Texas

19,742,154

62.3%

3.68%

Nevada

2,019,608

61.5%

4.44%

Arizona

4,653,683

61.0%

2.72%

Idaho

1,224,864

60.3%

2.02%

Colorado

3,621,972

60.0%

3.04%

Florida

14,077,223

60.0%

5.44%

Washington

4,763,708

59.5%

2.37%

North Carolina

6,636,167

59.3%

4.25%

Source: Influencity proprietary 2026 data, [1]

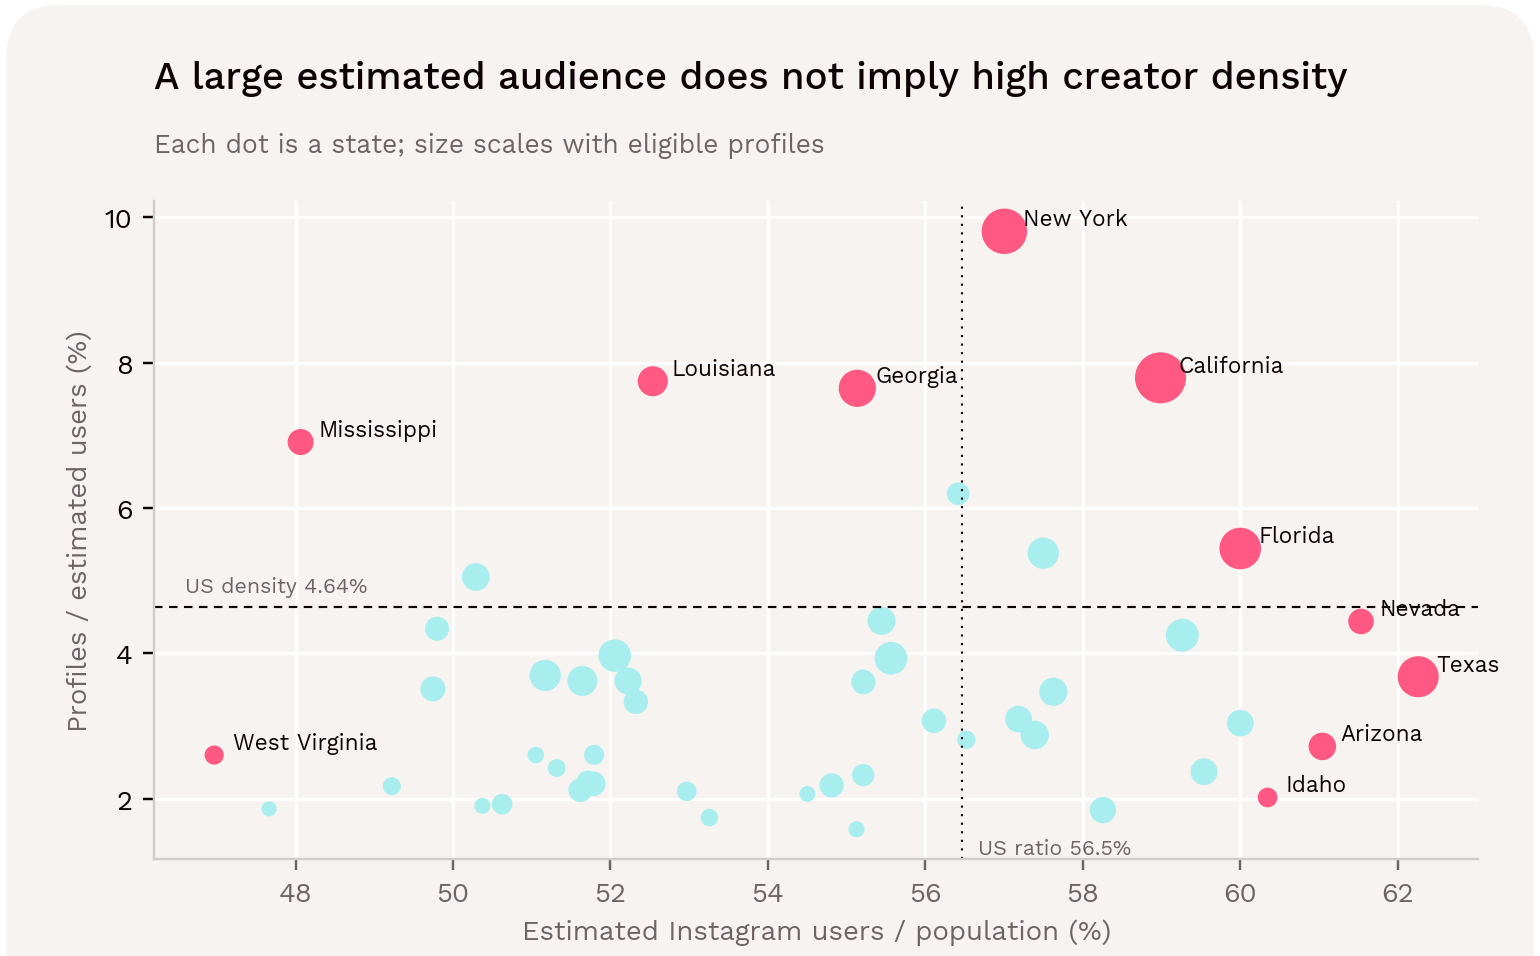
Figure 06 → A relatively large estimated Instagram audience does not automatically imply a high density of eligible creators. Source: [1].

The Highest-Reach States Are Concentrated in the South and West

The eight states with the highest estimated reach are Texas, Nevada, Arizona, Idaho, Colorado, Florida, Washington and North Carolina, all in the South or West. California (59.0%) and New Jersey (58.3%) come next. At the other end are West Virginia (47.0%), Wyoming (47.7%), Mississippi (48.1%), Maine (49.2%) and Kentucky (49.7%). These are mostly smaller, more rural states. [1]

Larger states also tend to have higher estimated reach. The rank correlation between population and the users-to-population ratio is 0.47. One possible reason is that the audience estimates reflect urban concentration and age structure. Large, fast-growing metro areas have younger populations that use social platforms more, while older, rural states sit lower. The data contains no age or urbanization fields, so this is a hypothesis to test.

Audience Reach Varies Little but Instagram Influencer Density Varies a Lot

Estimated reach is a narrow measure. Every state falls between 47.0% and 62.3%, and the spread relative to the average is about 7%. Creator density ranges from 1.58% to 9.80%, with a relative spread of about 51%, roughly seven times wider.

This is why section 02 found that creator density, not audience reach, explains most of the difference between states' creator counts. [1]

High Reach and High Influencer Density Rarely Coincide

Across the 50 states the two measures are only weakly related (rank correlation 0.22). Of the eight highest-reach states, only Florida is above the national creator-density benchmark. Taken together, those eight states have a density of 3.95%, below the national 4.64%.

Several of the densest creator markets have below-average reach. Mississippi (48.1% reach, 6.91% density), Louisiana (52.5%, 7.74%), Alabama (50.3%, 5.05%) and Georgia (55.1%, 7.65%) are all below the national reach ratio. [1]
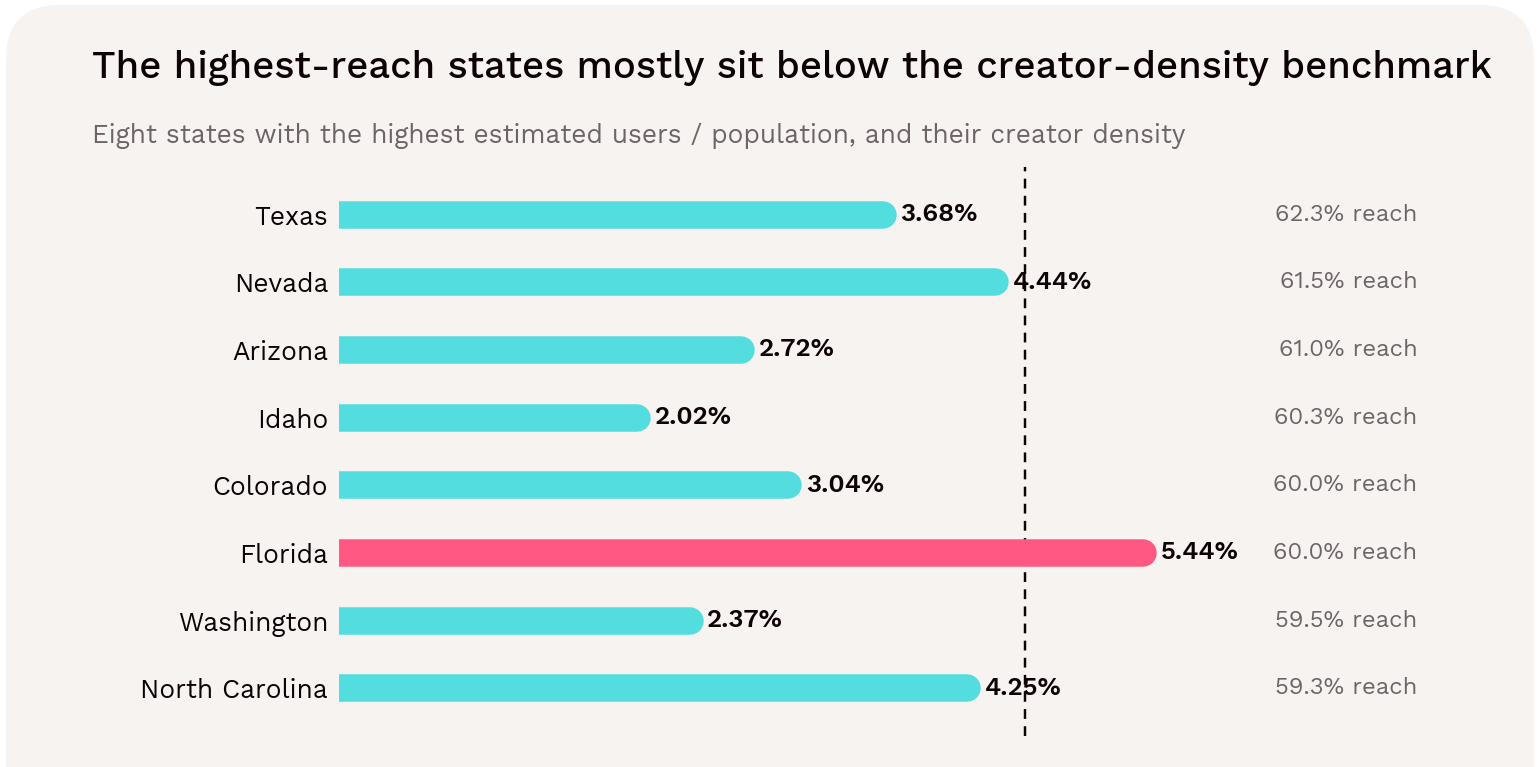
Figure 07 → The eight states with the highest estimated users-to-population ratio, and their creator density. Only Florida exceeds the 4.64% national benchmark. Source: [1].

Texas is the clearest example. It has 1.84M more estimated Instagram users than its population share would suggest, and 8.3M more estimated users than New York. Yet it records fewer eligible profiles than New York (726,574 against 1,117,842). At the national density, Texas would record about 917,000 profiles. [1]

What Does the Contrast Tell a Campaign Planner?

Texas leads the audience-ratio ranking but sits below the national creator-density benchmark. New York's audience ratio is 57.0%, close to the national figure, while its influencer density is more than twice as high. Louisiana and Mississippi have lower audience ratios but much higher creator density. [1]

In practice, the two measures point to different opportunities:
  • High reach, lower creator density (Texas, Arizona, Idaho, Colorado, Washington): A large audience relative to the number of local creators. Recruiting may require a wider search, including creators based elsewhere whose followers are in these states.
  • High creator density, lower reach (Mississippi, Louisiana, Alabama, Georgia): Plenty of local creators relative to the audience. Locally relevant creators should be easier to find, but each state's audience is smaller.
  • High on both (Florida, California, New York): The broadest recruitment pools against sizable audiences. 

Use audience estimates to frame market scale and creator counts to frame discovery capacity. Neither establishes reachable campaign impressions. That requires creator-level audience location, recent content performance and overlap analysis. The population and user-estimation methods should be confirmed before describing these ratios as adoption.

05 → SUPPLY RELATIVE TO AUDIENCE

Which States Have the Highest Instagram Influencer Density?

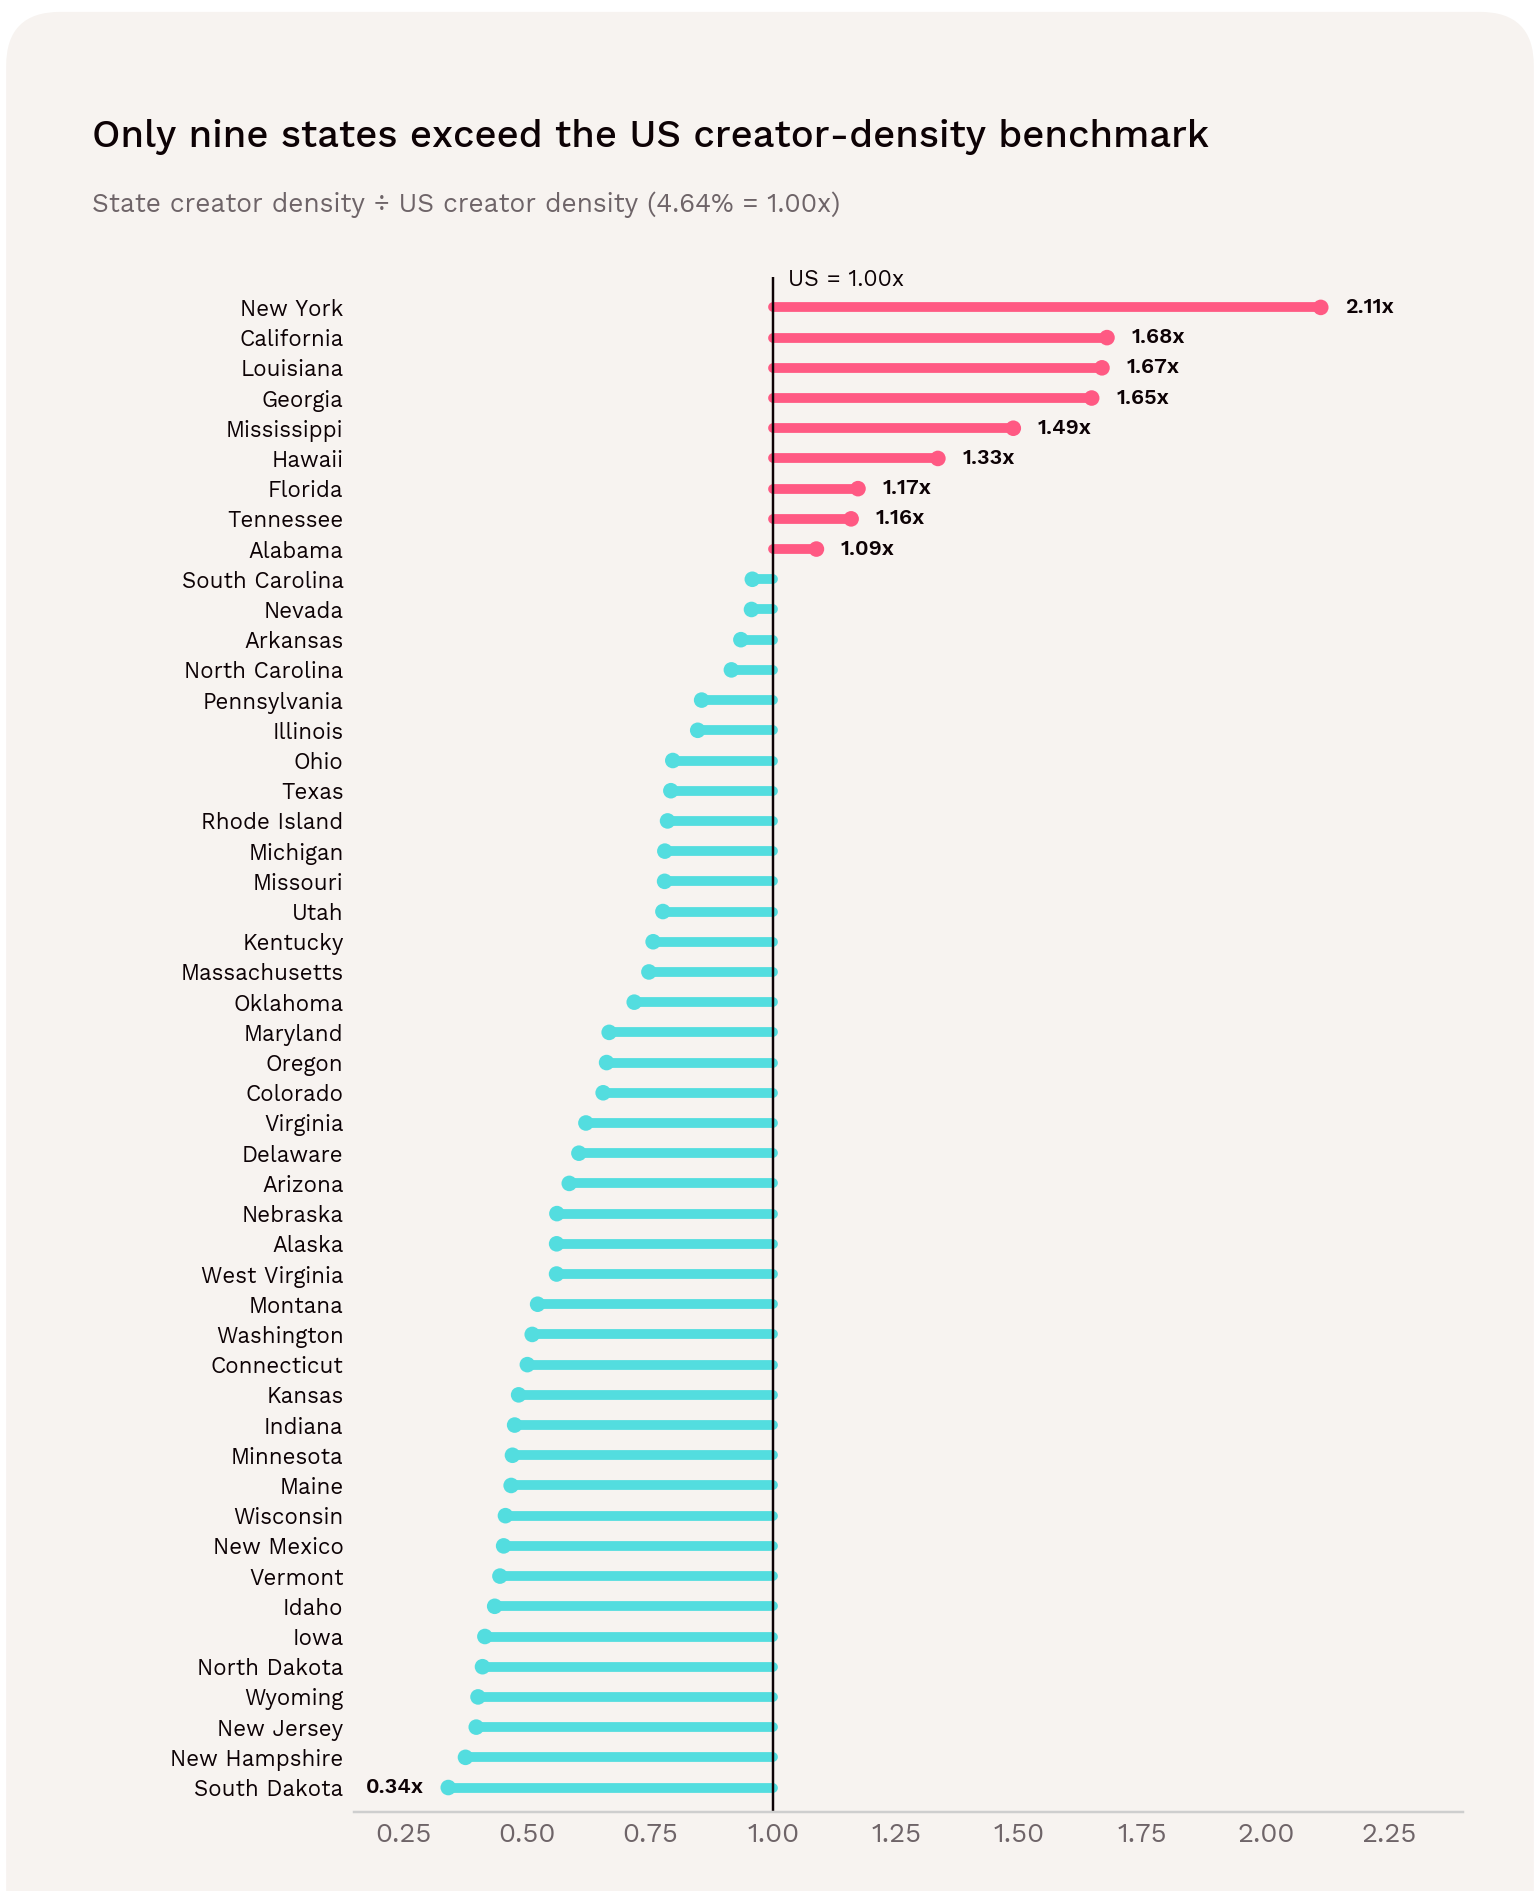
New York leads all 50 states with 9.80 influencer-eligible profiles per 100 estimated Instagram users. California, Louisiana and Georgia form the next group, each above 7.6%. Density is a relative supply measure: it is not the proportion of unique residents who earn a living as influencers. [1]

State

Eligible profiles

Density

Index vs US

New York

1,117,842

9.80%

2.11x

California

1,808,298

7.79%

1.68x

Louisiana

187,854

7.74%

1.67x

Georgia

476,441

7.65%

1.65x

Mississippi

98,071

6.91%

1.49x

Hawaii

50,087

6.20%

1.33x

Florida

766,282

5.44%

1.17x

Tennessee

226,231

5.38%

1.16x

Alabama

131,930

5.05%

1.09x

US benchmark

8,943,596

4.64%

1.00x

Source: Influencity proprietary 2026 data. [1] Calculations use unrounded values.

Figure 08 → Only nine states exceed the US weighted creator-density benchmark. The index divides each state's density by the national ratio. Source: [1].

Nine States, More than Half of All Instagram Influencers

The nine states in the table above show that the benchmark holds 54.4% of eligible profiles but only 34.5% of estimated Instagram users. Their combined density is 7.32%, more than twice the 3.23% across the other 41 states.

Most states sit well below the national figure. The median state density is 3.09%, and 23 states are below 3%. The national 4.64% is pulled up by California and New York; without them, the remaining 48 states have a combined density of 3.81%. [1]

A Southeastern Cluster

Six of the nine high-density states are in the Southeast: Louisiana, Georgia, Mississippi, Florida, Tennessee and Alabama. Together they hold 21.1% of eligible profiles against 16.1% of estimated users, a combined density of 6.09%.

Their neighbours sit just below the benchmark: South Carolina (4.45%), Arkansas (4.34%) and North Carolina (4.25%). The region as a whole leans towards higher creator density. That makes it more likely a regional pattern than a scatter of unrelated outliers. [1]

Two Types of High-Density State

Splitting density by follower size shows the nine states are not all dense for the same reason.
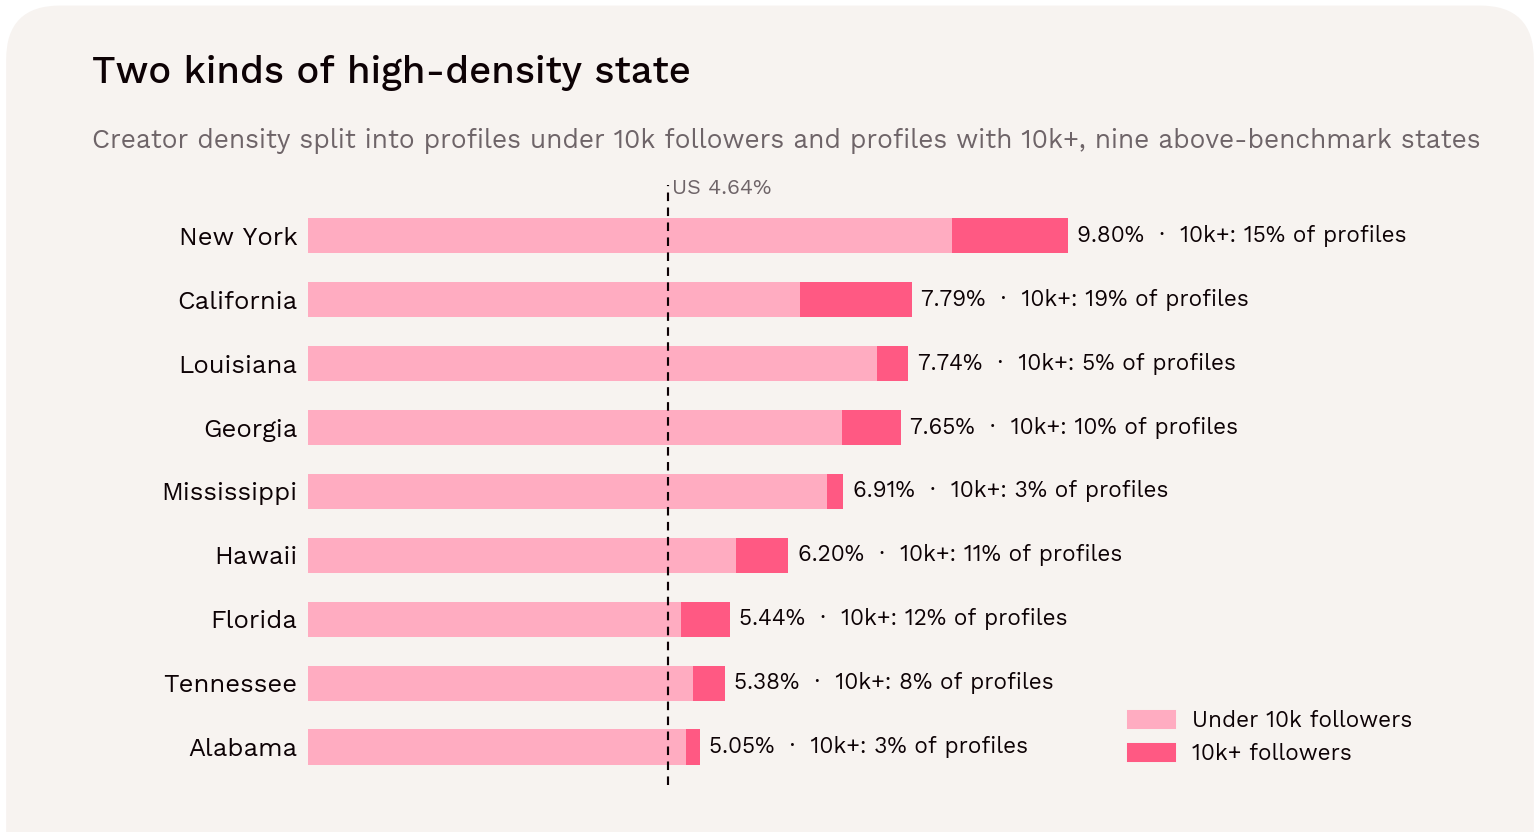
  • Large-creator hubs (New York and California): They have the most creators of every size. Profiles with 10,000+ followers make up 15% and 19% of their pools, against 10.8% nationally. Per 100 estimated users, they record about 1.5 creators with 10k+ followers, three times the national 0.50. Georgia, Hawaii and Florida follow the same pattern on a smaller scale.
  • Small-creator states (Louisiana, Mississippi and Alabama): Their density comes almost entirely from nano profiles. Only 5%, 3% and 3% of their creators have 10,000+ followers. Louisiana's density of 10k+ creators (0.40 per 100 users) is below the national figure, even though its overall density is the third-highest in the country.

Figure 09 → Creator density split into profiles under 10k followers and profiles with 10k+, for the nine above-benchmark states. Source: [1].

This distinction matters for planning. New York and California offer depth across every tier. Louisiana, Mississippi and Alabama offer large numbers of smaller, local creators, but relatively few large accounts. [1]

Why Might These States Be Denser?

The data shows where density is high, not why. Several explanations fit the patterns above and could be tested.

  • Creative and media industries may explain the large-creator hubs. New York and Los Angeles concentrate on entertainment, fashion, media and the agencies and brands that work with creators. Atlanta has a large music and screen-production sector.
  • Community and local-culture content may explain the small-creator states. A high share of nano influencers fits strong local content scenes (food, music, faith and community events).
  • How profiles are assigned to states may shift creators towards well-known hubs. New Jersey has one of the lowest densities (1.85%) despite bordering New York, which has the highest. Some creators living in New Jersey or Connecticut may list New York as their location. Even combined, New York, New Jersey and Connecticut have a density of 6.67%, still well above the benchmark, so this would explain part of the gap, not all of it.

Where Is the Lowest Instagram Influencer Density Recorded?

South Dakota has the lowest recorded density, at 1.58%, followed by New Hampshire at 1.75%, New Jersey at 1.85%, Wyoming at 1.86% and North Dakota at 1.91%. Most are small, rural states, and New Jersey's position may partly reflect the state-assignment issue above.

A low ratio does not prove an untapped opportunity or lower competition: demand, fees and creator quality are not measured here. [1]
What this means for campaign planning

For large creators, start in New York and California, where 10k+ creators are three times as dense as nationally.

For many smaller, local voices, the Southeast offers dense nano pools, especially Louisiana, Mississippi and Alabama.

For a national plan, remember the national benchmark is pulled up by two states. For a typical state, the median of 3.09% is a better reference.

The US benchmark is calculated from the sum of profiles divided by the sum of estimated users. It is not a simple average of the 50 state percentages, which would be 3.60%.

06 → CREATORS AND THE AGE PROFILE OF EACH STATE

Do Younger US States Have More Instagram Influencers per Resident?

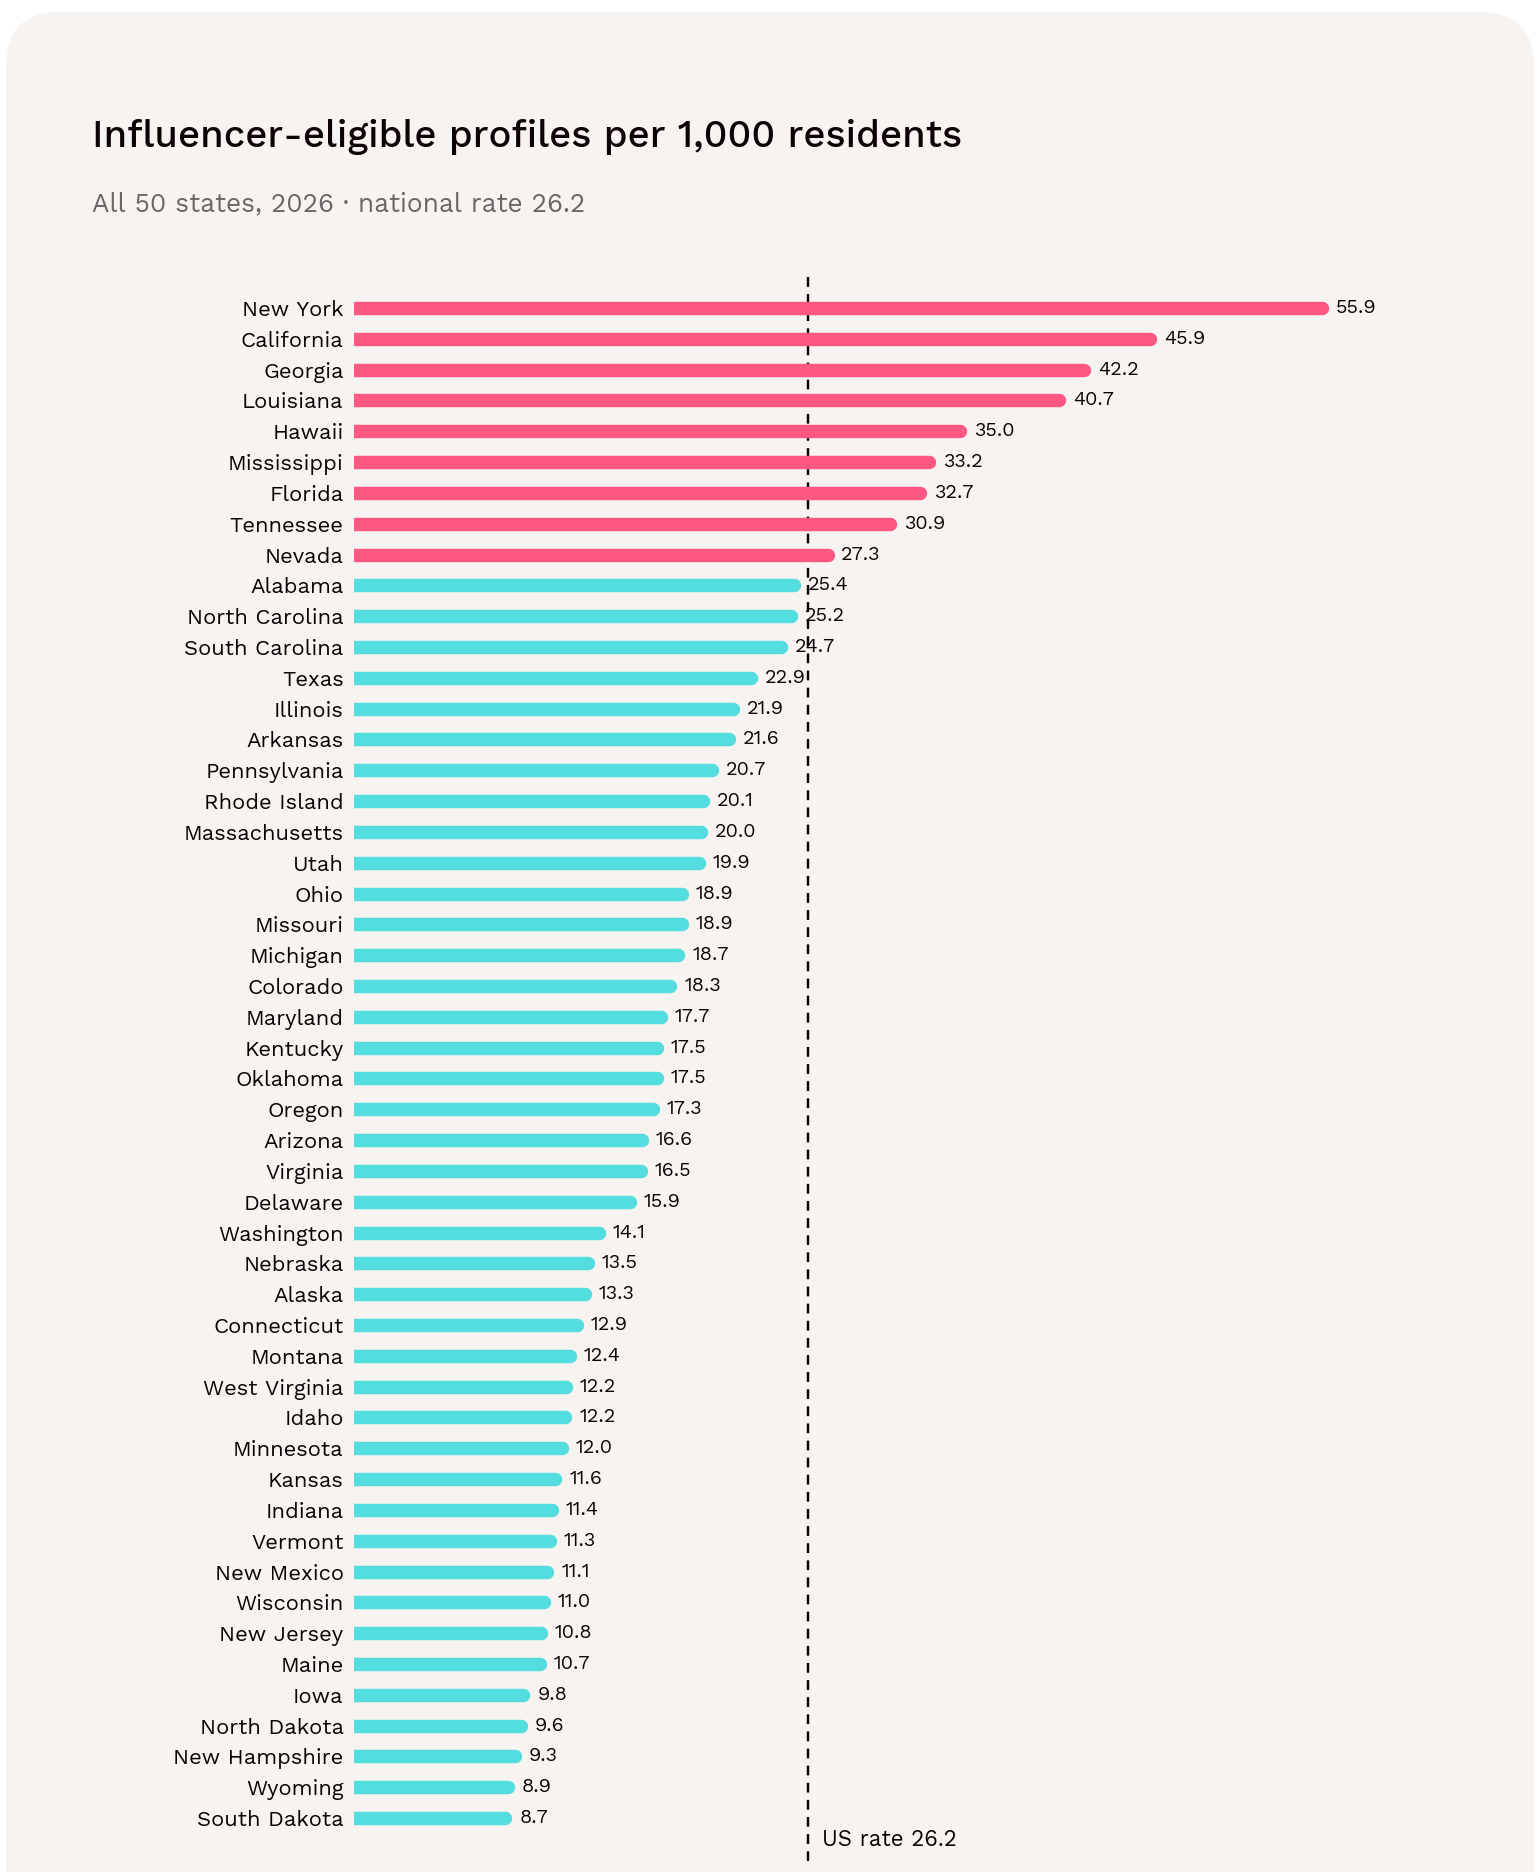
New York has the most influencer-eligible profiles per resident: 55.9 per 1,000 people, more than twice the national rate of 26.2. California (45.9), Georgia (42.2) and Louisiana (40.7) follow. At the other end, South Dakota records 8.7 per 1,000 residents, a 6.4-fold gap with New York. [1]

This measure complements creator density (section 05). Density compares creators with the estimated Instagram audience; this compares them with everyone who lives in the state. It answers a simpler question: how big is the local creator community relative to the population?

State

Eligible profiles

Residents

Per 1,000 residents

Median age (Census)

New York

1,117,842

20,002,427

55.9

39.4

California

1,808,298

39,355,309

45.9

37.3

Georgia

476,441

11,302,748

42.2

37.3

Louisiana

187,854

4,618,189

40.7

37.8

Hawaii

50,087

1,432,820

35.0

40

Mississippi

98,071

2,954,160

33.2

38.3

Florida

766,282

23,462,518

32.7

42.7

Tennessee

226,231

7,315,076

30.9

39.1

Nevada

89,674

3,282,188

27.3

38.5

Iowa

31,608

3,238,387

9.8

38.6

North Dakota

7,673

799,358

9.6

35.4

New Hampshire

13,154

1,415,342

9.3

43.1

Wyoming

5,229

588,753

8.9

38.7

South Dakota

8,160

935,094

8.7

37.6

Influencity proprietary 2026 data, per 1,000 = eligible profiles ÷ population × 1,000 [1]. Median age of residents: US Census Bureau estimates [6]. The full 50-state series is in Appendix A.

Figure 10 → Influencer-eligible profiles per 1,000 residents, 50 states. This is the y-axis of the age comparison. Residents = data population field. Source: [1].

Most States Sit Below the National Rate

Only nine states are above the national rate of 26.2 per 1,000 residents. The typical (median) state has 17.5, and the national figure is pulled up by New York and California. For a state-level brief, the median is a more realistic reference than the national average. [1]

Instagram Influencers Density Drives the Differences

Profiles per resident combine two things: how many residents use Instagram (section 04) and how many creators there are per Instagram user (section 05). Creator density does almost all the work.

A state's per-resident ranking almost exactly mirrors its density ranking (rank correlation 0.99). Its link with estimated Instagram reach is weak (0.34). Breaking down the differences between states, about 92% of the variation in profiles per resident comes from creator density, around 2% from audience reach, and the rest from the two combined. [1]

This is why the above-average list is almost identical to section 05's density list. The one change: Nevada (27.3) enters because its high estimated reach (61.5%) lifts a slightly below-average density, while Alabama (25.4) drops just below the line because its reach is among the lowest (50.3%).

Do Younger States Have More Influencers per Resident?

No. A natural explanation for these differences would be age: states with younger populations might have more residents creating content. Comparing each state's profiles per resident with the median age of its residents shows no meaningful relationship.

  • The overall link is close to zero. Across the 50 states, the rank correlation is −0.07, and age explains about 1% of the variation between states. Excluding the two largest outliers, New York and California, makes no difference (−0.05). [1,6]
  • The youngest states are not creator hotspots. Utah, the youngest state (median age 31.5), has 19.9 profiles per 1,000 residents, below the national rate. Texas (35.2) has 22.9, and North Dakota (35.4) has only 9.6, the fourth-lowest in the country.
  • The oldest states are mixed. Maine (45.0), New Hampshire (43.1), Vermont (43.0) and West Virginia (43.0) all have few creators per resident. Yet Florida, the fifth-oldest state (42.7), ranks seventh with 32.7.
  • The leaders are middle-aged states. The four states with the most creators per resident have median ages between 37.3 and 39.4, close to the middle of the range (31.5 to 45.0).

Grouping states into thirds by age tells the same story. The typical state has 16.6 profiles per 1,000 residents in the youngest third, 18.9 in the middle third and 15.9 in the oldest. There is no steady decline with age.

Age is also unrelated to influencer density (−0.03) and to estimated Instagram reach (−0.11). Whatever makes New York, California, Georgia or Louisiana unusual, it is not that their residents are younger. [1, 6]
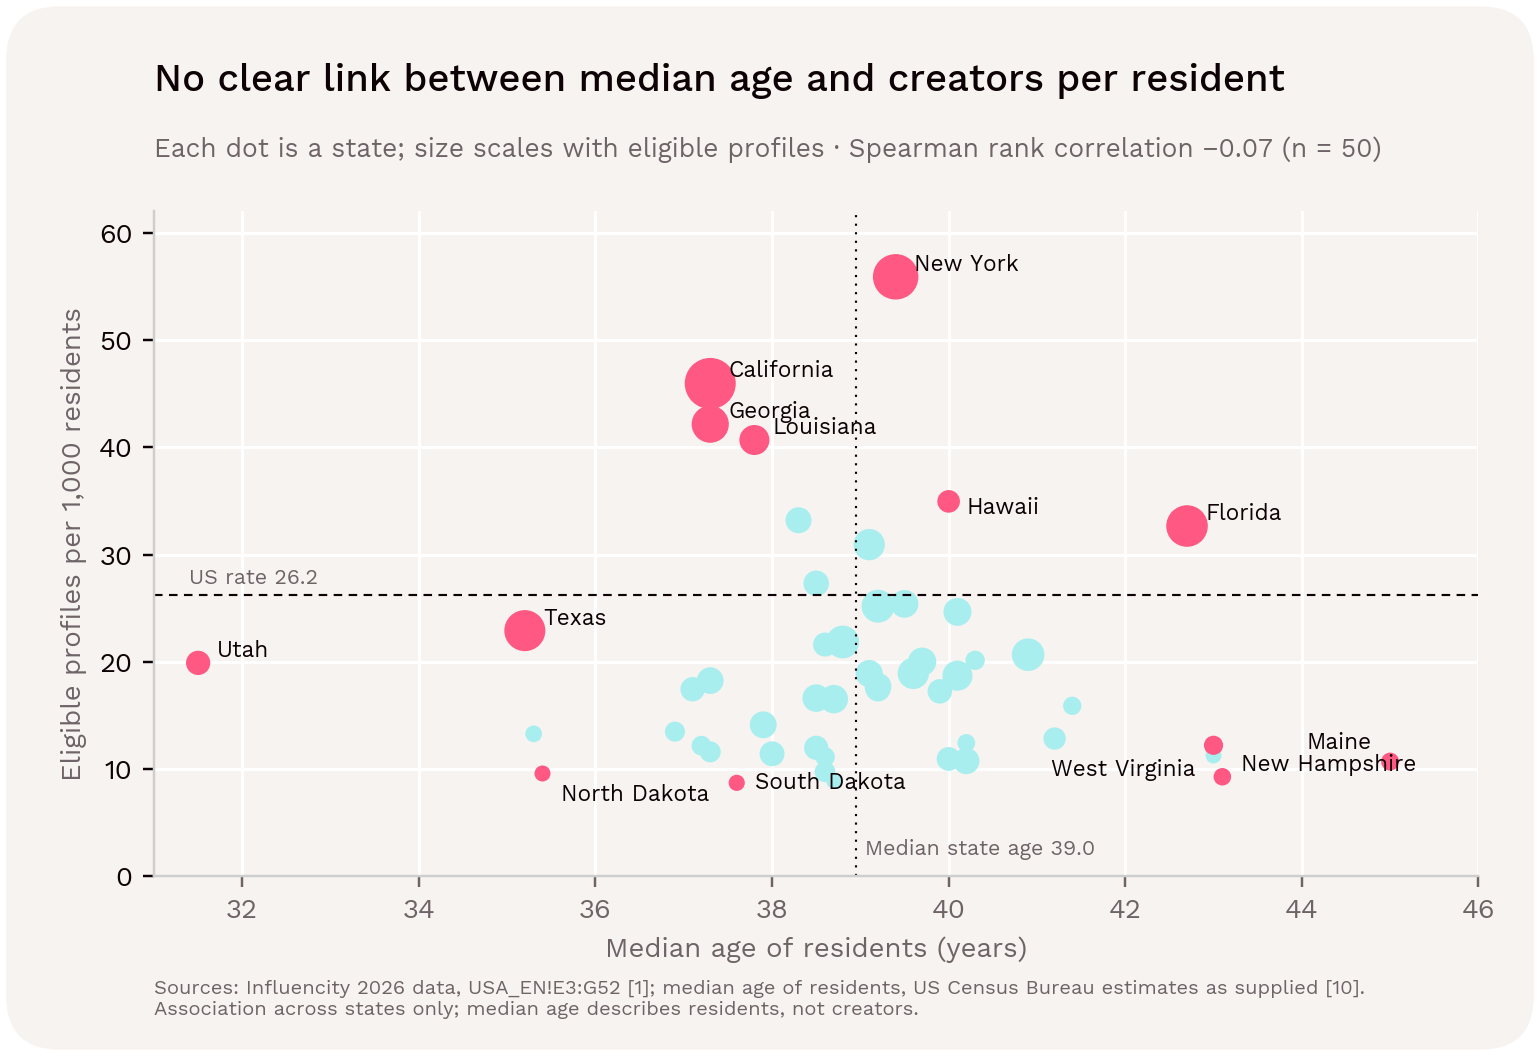
Figure 11→ Eligible profiles per 1,000 residents against residents' median age, 50 states. Sources: [1, 6].

What Explains this Pattern?

Ruling out age narrows the field. The explanations that remain fit the evidence in sections 02 and 05 better:

  • Media and creative industries. New York and Los Angeles are home to large concentrations of entertainment, fashion and media businesses, and Atlanta to a major music and screen-production sector. These states also lead on large creators.
  • Local creator scenes. Louisiana, Mississippi and Alabama are dense mainly in nano creators, which suggests strong local or community content.
  • How profiles are assigned to states. Some creators may list well-known hubs such as New York as their location.

The finding is that, across states, age does not predict how many creators a state has per resident.
What this means for campaign planning

Don't use a state's age profile as a shortcut for creator supply. A young state such as Utah or Texas will not necessarily offer more local creators than an older one such as Florida. Use the per-resident and density figures directly.

For community-led or local campaigns, profiles per resident is a useful guide to how visible creators are in everyday life. In New York, Georgia or Louisiana, a brand is more likely to find several creators in a given community. In the Dakotas, Wyoming or New Hampshire, local rosters will be thinner, and wider or cross-state searches may be needed. As with every measure in this study, the count describes supply, not creator quality, fees or results. [1]

07 → PROFILE CLASSIFICATION

What Is the Gender Distribution of US Instagram Influencers?

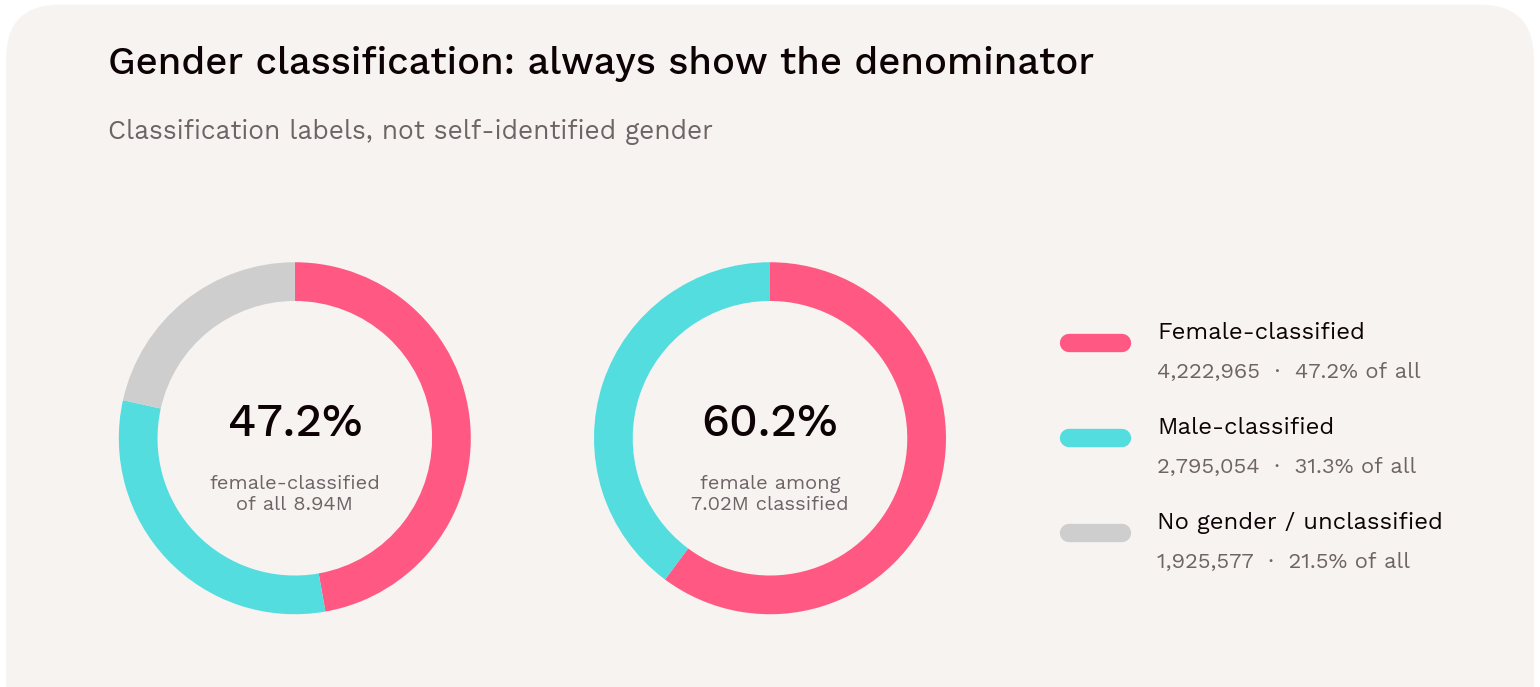
Female-classified profiles represent 60.2% of the 7,018,019 profiles classified as male or female. Male-classified profiles account for 39.8%. Across all 8,943,596 eligible profiles, however, 21.5% have no gender classification. Reporting that third category is essential to understanding the denominator. [1]

Recorded category

Profiles

Share of all profiles

Share of classified

Female

4,222,965

47.2%

60.2%

Male

2,795,054

31.3%

39.8%

No gender / unclassified

1,925,577

21.5%

Excluded

Total

8,943,596

100.0%

7,018,019 classified

Source: Influencity proprietary 2026.[1] Calculations use unrounded values.

Figure 12 → The 60.2% female share excludes 1.93M unclassified profiles. Classification is not equivalent to self-identified gender. Source: [1].

There are about 1.5 female-classified profiles for every male-classified one. The two ways of stating the result tell different stories: 60.2% of classified profiles are female, but only 47.2% of all eligible profiles. Any published figure should name its denominator. [1]

A Female Majority in Every State-Level Total

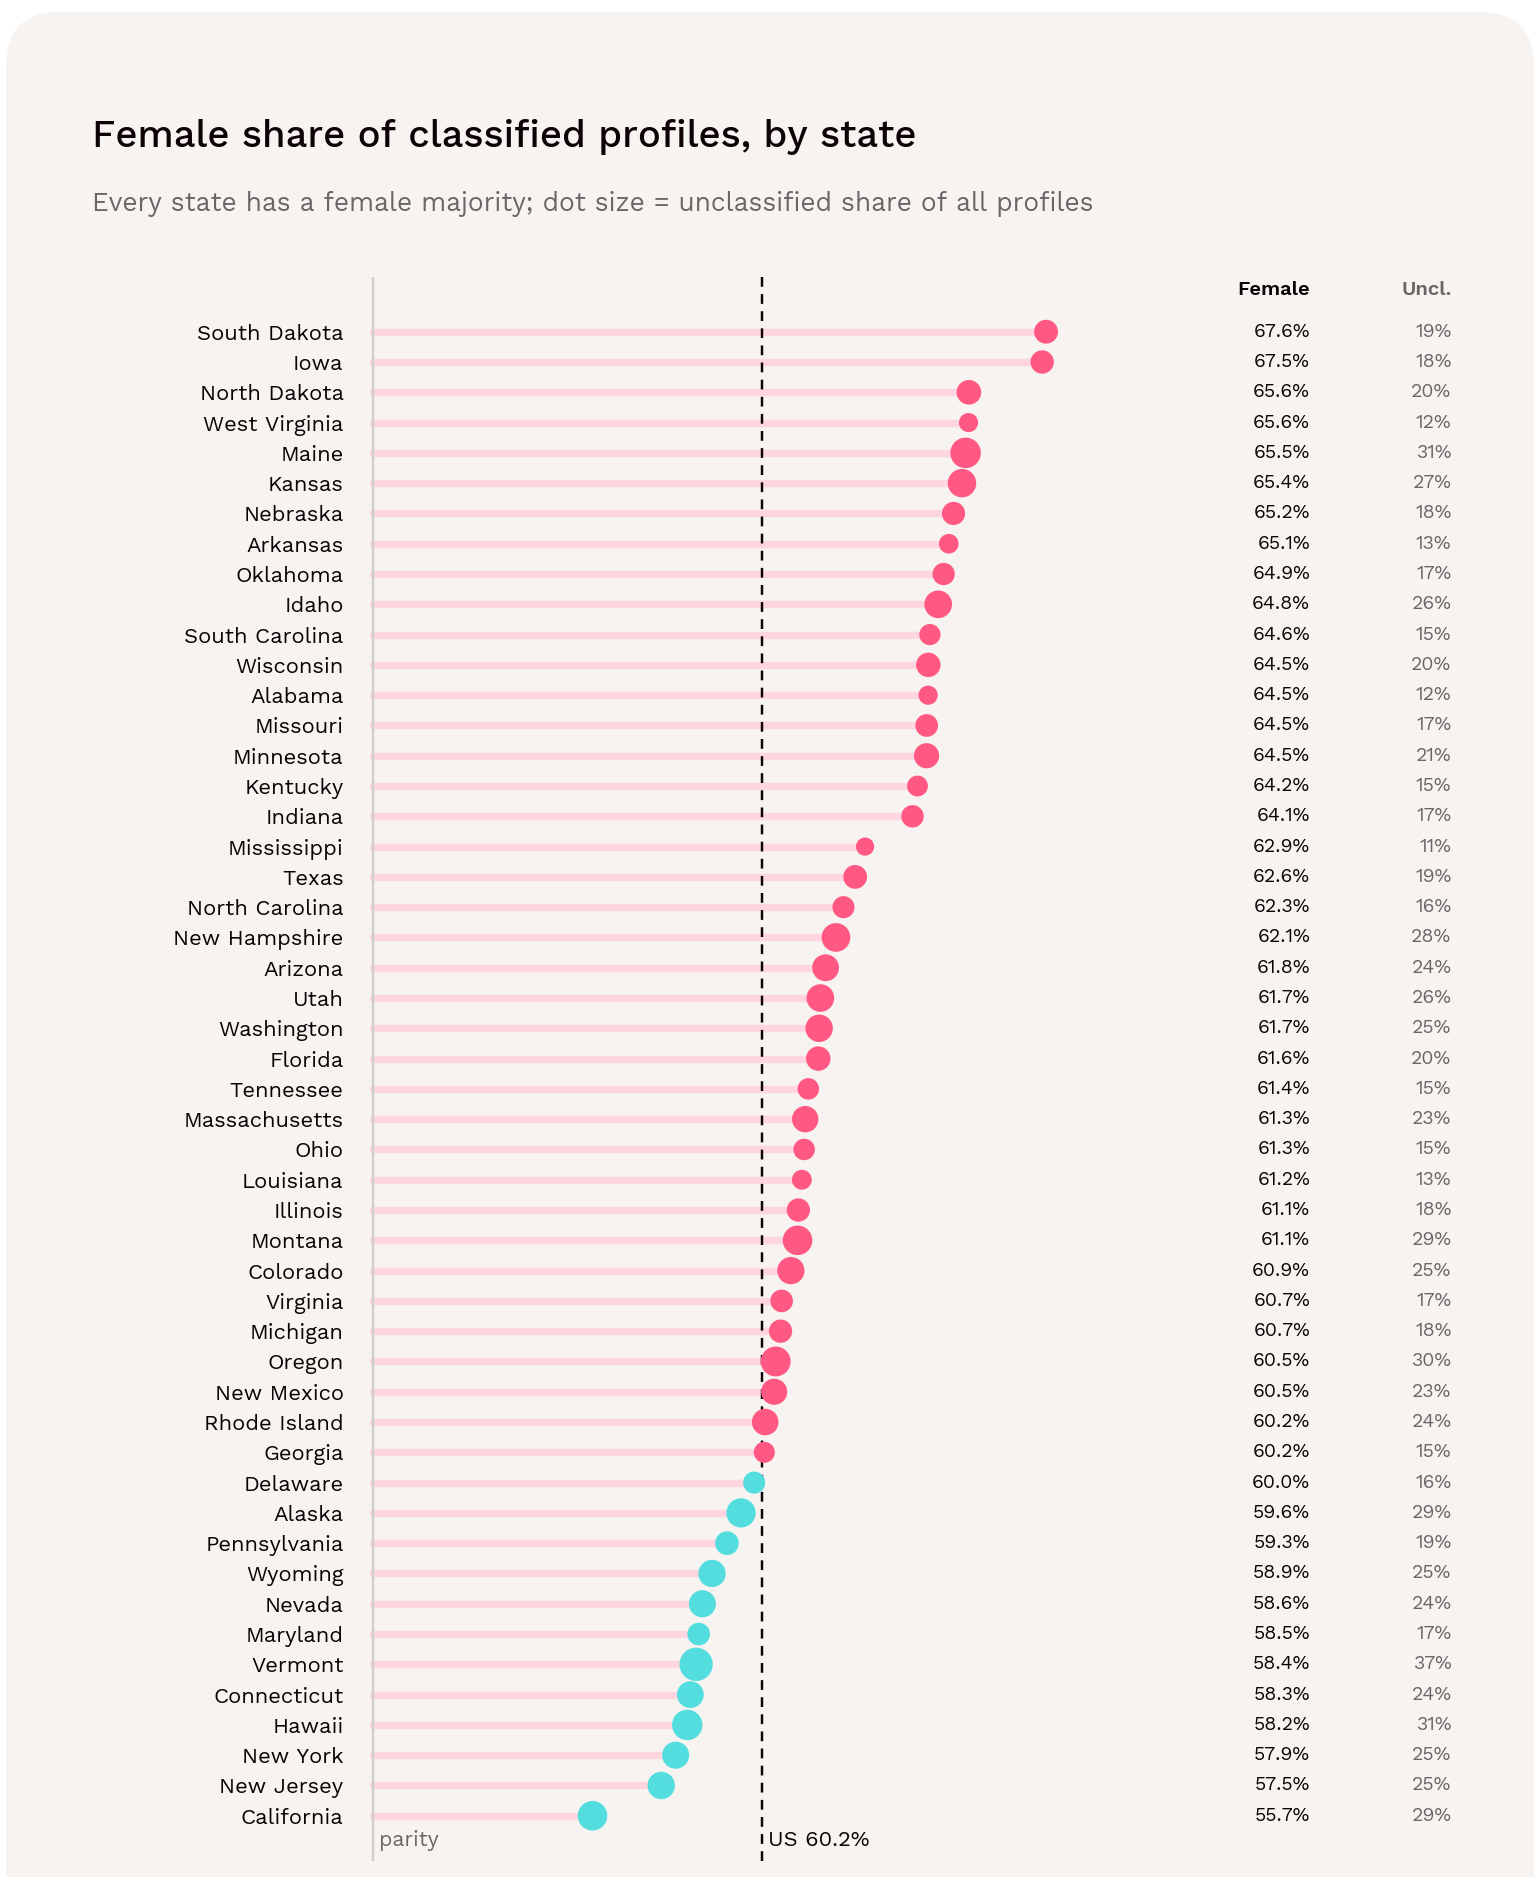
Female-classified profiles outnumber male-classified profiles in all 50 states. The female share of classified profiles ranges from 55.7% in California to 67.6% in South Dakota. [1] 
Selected state

Female share of classified

Unclassified share of all

South Dakota

67.6%

19.1%

Iowa

67.5%

18.2%

California

55.7%

29.2%

New York

57.9%

24.5%

Hawaii

58.2%

30.9%

Source: Influencity proprietary 2026.[1] Calculations use unrounded values.

Unclassified does not mean non-binary, low-quality or commercially unsuitable. The dataset does not establish self-identified gender, and these creator classifications do not describe follower demographics. They also cannot establish pay equity, decision-making power or category preference.

Figure 13 → Female share of classified profiles in all 50 states, with each state's unclassified share. Source: [1].

Rural States Lean More Female; Large Coastal Markets Are More Balanced

The states with the highest female shares are mostly rural, plains or southern. South Dakota (67.6%), Iowa (67.5%), North Dakota and West Virginia (both 65.6%), Maine (65.5%), Kansas (65.4%) and Nebraska (65.2%).

The most balanced are large, mostly coastal markets, like California (55.7%), New Jersey (57.5%), New York (57.9%), Hawaii (58.2%) and Connecticut (58.3%).

By region, the female share is 62.5% in the Midwest and 62.0% in the South, against 58.5% in the Northeast and 57.2% in the West. California and New York together are 56.6% female. The other 48 states combined are 61.7%. [1]

Why Are the Big Influencer Hubs More Balanced? Larger Influencers Are

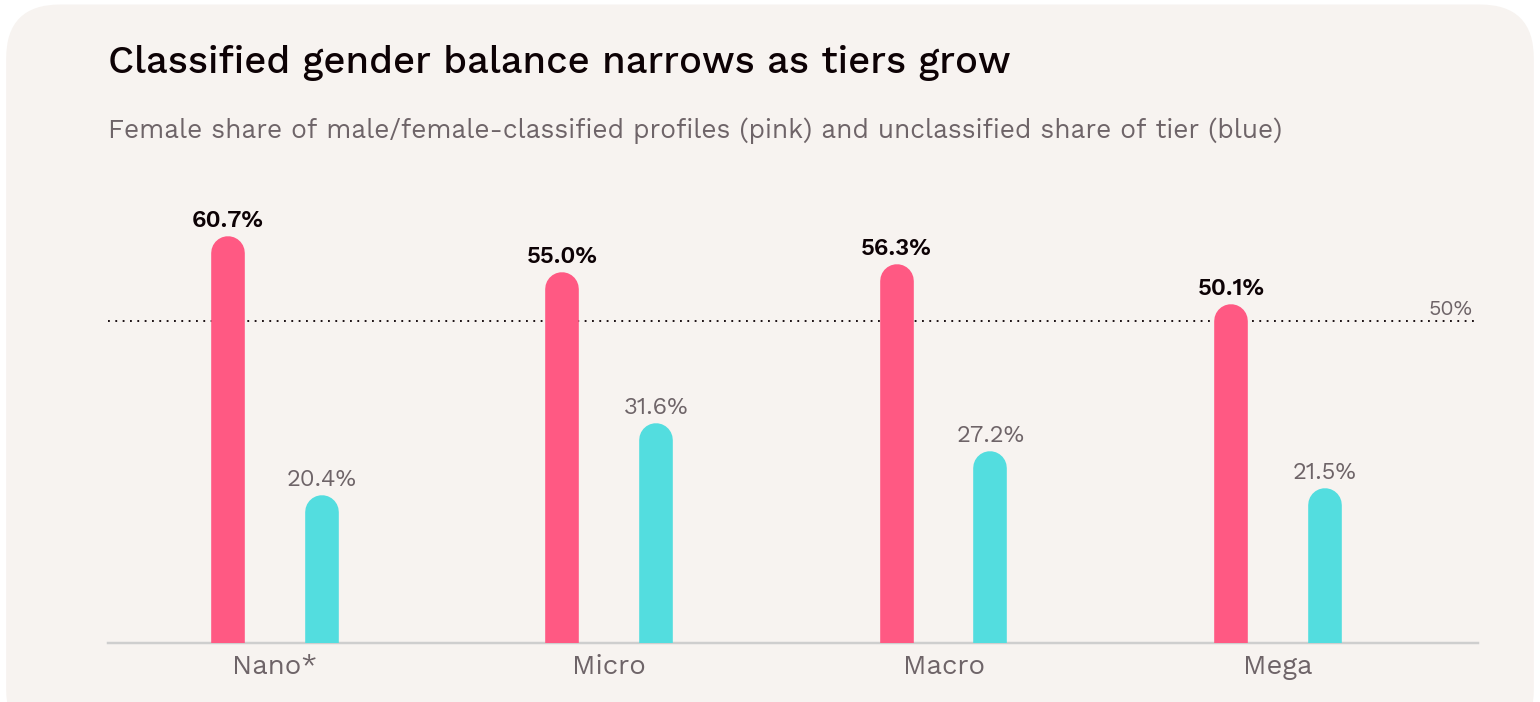
Part of the explanation is follower size. The female majority narrows as influencers grow: 60.7% of classified nano profiles are female, falling to 55.0% in micro and 50.1% in mega (section 08).

States with more macro-influencers therefore tend to be more balanced overall. Across the 50 states, the share of profiles with 10,000+ followers is clearly linked to a lower female share (rank correlation −0.47). California and New York have the most large creators (19% and 15% of their profiles have 10k+ followers, against 10.8% nationally), and they are among the most balanced states.
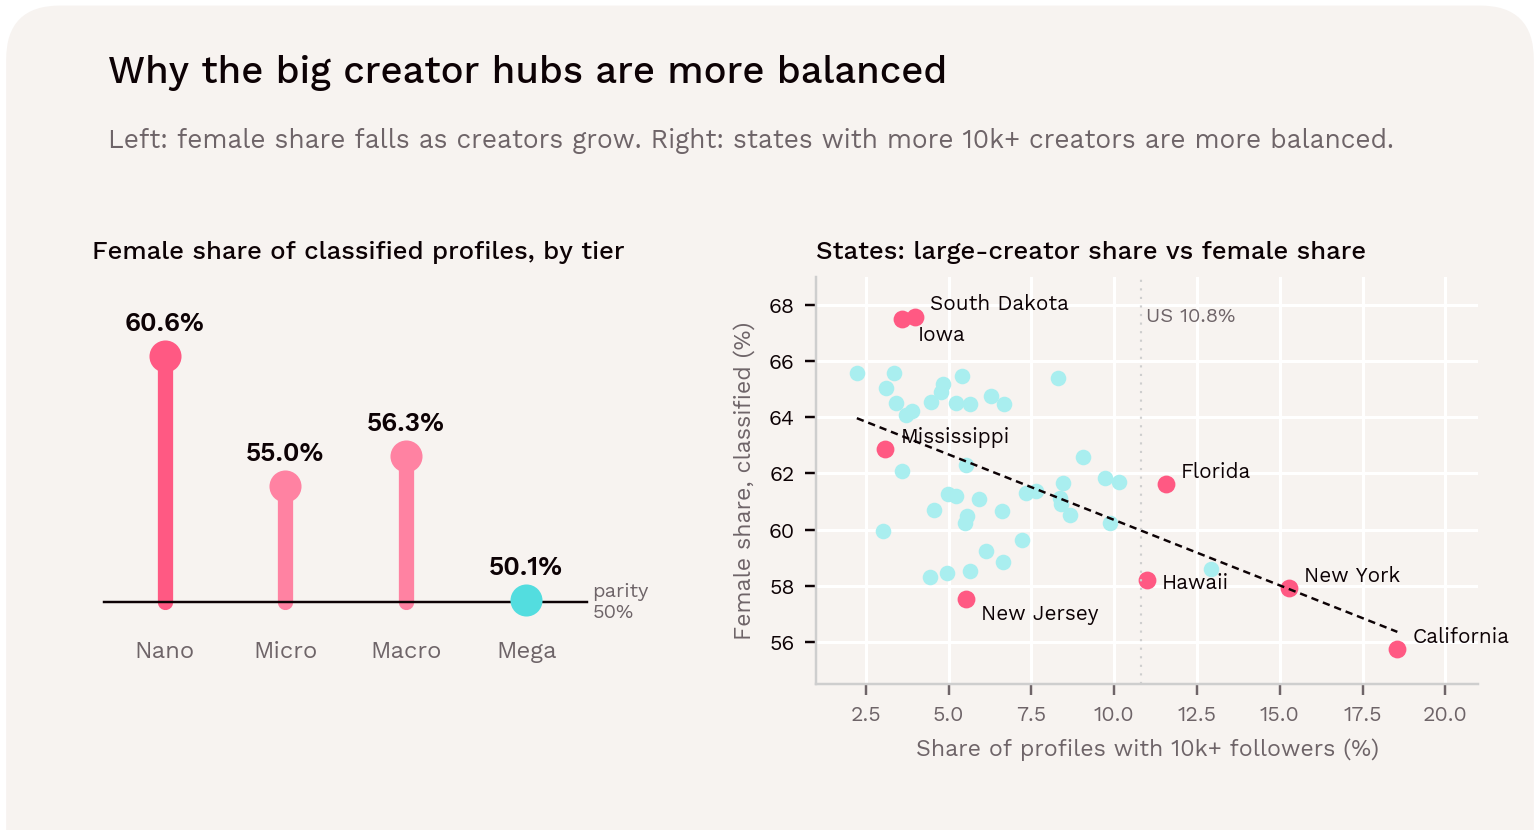
Figure 14 → Female share of classified profiles by follower tier (left), and by state against the share of profiles with 10k+ followers (right). States with more large creators are more gender-balanced (rank correlation −0.47). Source: [1].

That accounts for some of the geography, not all of it. Industry mix, the types of content made in each state, and differences in how profiles are classified could also play a part, and the data can't separate them. Age does not appear to be the driver. Female share has only a weak, statistically unclear link with residents' median age (−0.25). [1, 6]

The Unclassified Share Varies More Than the Gender Split

Unclassified profiles range from 11.1% of all profiles in Mississippi to 37.1% in Vermont; the typical state is at 20.0%. Coverage is lowest in the West (28.3% unclassified) and highest in the South (16.8%). The states with the highest unclassified shares are:

  • Vermont (37.1%)
  • Maine (31.1%)
  • Hawaii (30.9%)
  • Oregon (29.9%)
  • Montana (29.3%)
  • California (29.2%)

States with more macro-influencers also have more unclassified profiles (rank correlation 0.51). Within the tiers, the micro tier has the highest unclassified share (31.6%).

One possible reason is that larger accounts more often represent brands, organizations, publications or collaborative projects, which have no individual gender to classify. This angle matters for comparisons, where more profiles are unclassified, the classified split describes a smaller and possibly different part of the pool. [1]

How the US Instagram Influencers Compare

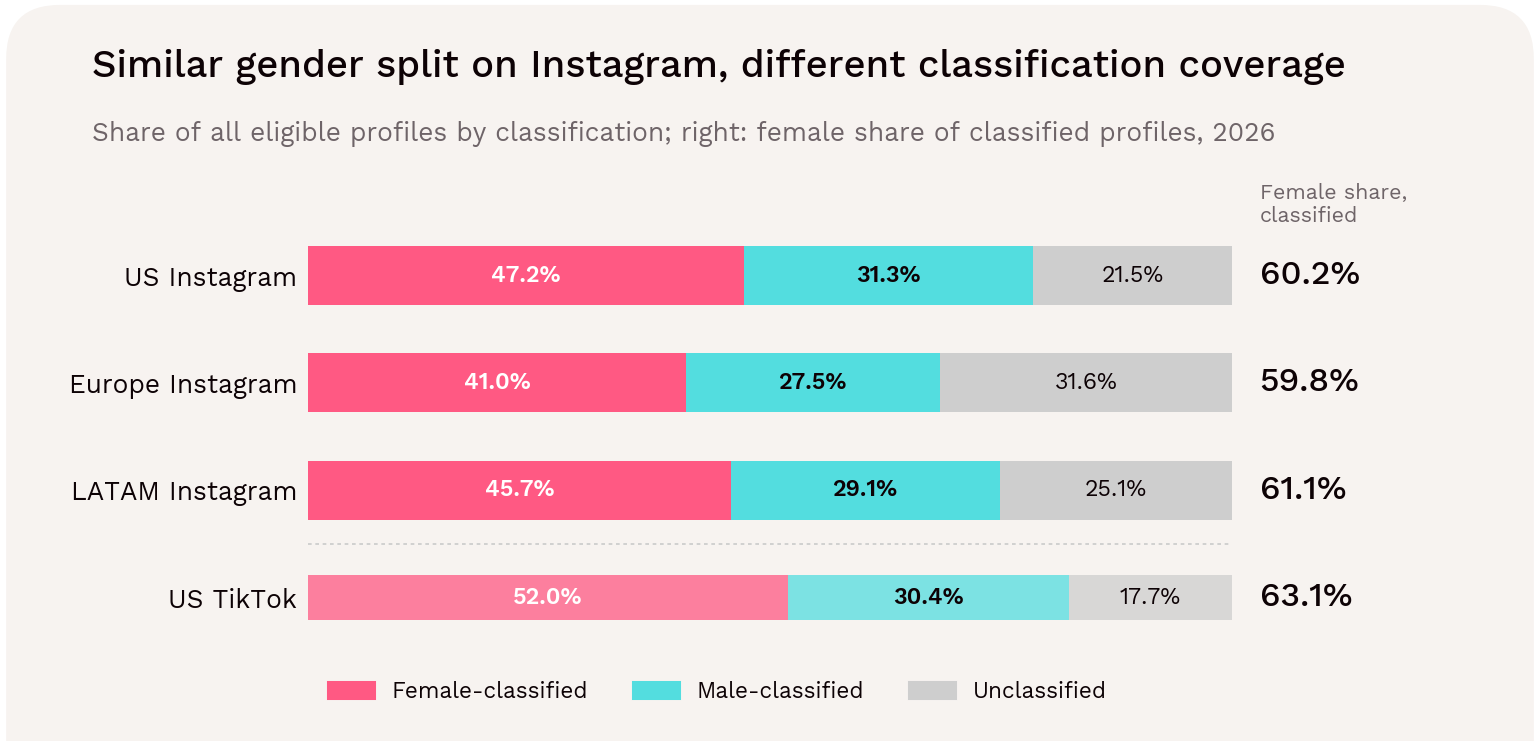
The US female share of classified profiles (60.2%) is almost identical to Influencity's 2026 Instagram data for Europe (59.8%) and Latin America (61.1%). The US has the smallest unclassified share of the three (21.5%, against 31.6% in Europe and 25.1% in Latin America), so its classified figures describe more of its pool. On TikTok, US creators are more female-skewed, at 63.1% of classified profiles. [4,9,10]
Dataset

Female

Male

Unclassified

Female share classified

US Instagram

47.2%

31.3%

21.5%

60.2%

Europe Instagram

41.0%

27.5%

31.6%

59.8%

LATAM Instagram

45.7%

29.1%

25.1%

61.1%

US TikTok

52.0%

30.4%

17.7%

63.1%

Source: Influencity proprietary 2026.[1] Calculations use unrounded values.

Figure 15 →Gender classification of all eligible profiles in Influencity's 2026 Instagram data for the US, Europe and Latin America, with US TikTok for reference. The female share of classified profiles is similar across regions; the unclassified share is not. Sources: [1, 4, 9, 10]

As a contrast, on TikTok, US creators are more female-skewed, at 63.1% of classified profiles, with only 17.7% unclassified.
What this means for campaign planning

For campaign planning, use the classification as a description of supply. A brief that needs a balanced or specific roster will find a wider choice of female-classified creators in every state. It will find the most balanced pools, and the most large creators of either gender, in California and New York. Audience gender must be checked at creator level, not inferred from the creator's classification. [1]

08 → FOLLOWER TIERS

How Is the Instagram Influencer Pool Distributed by Follower Tier in the US?

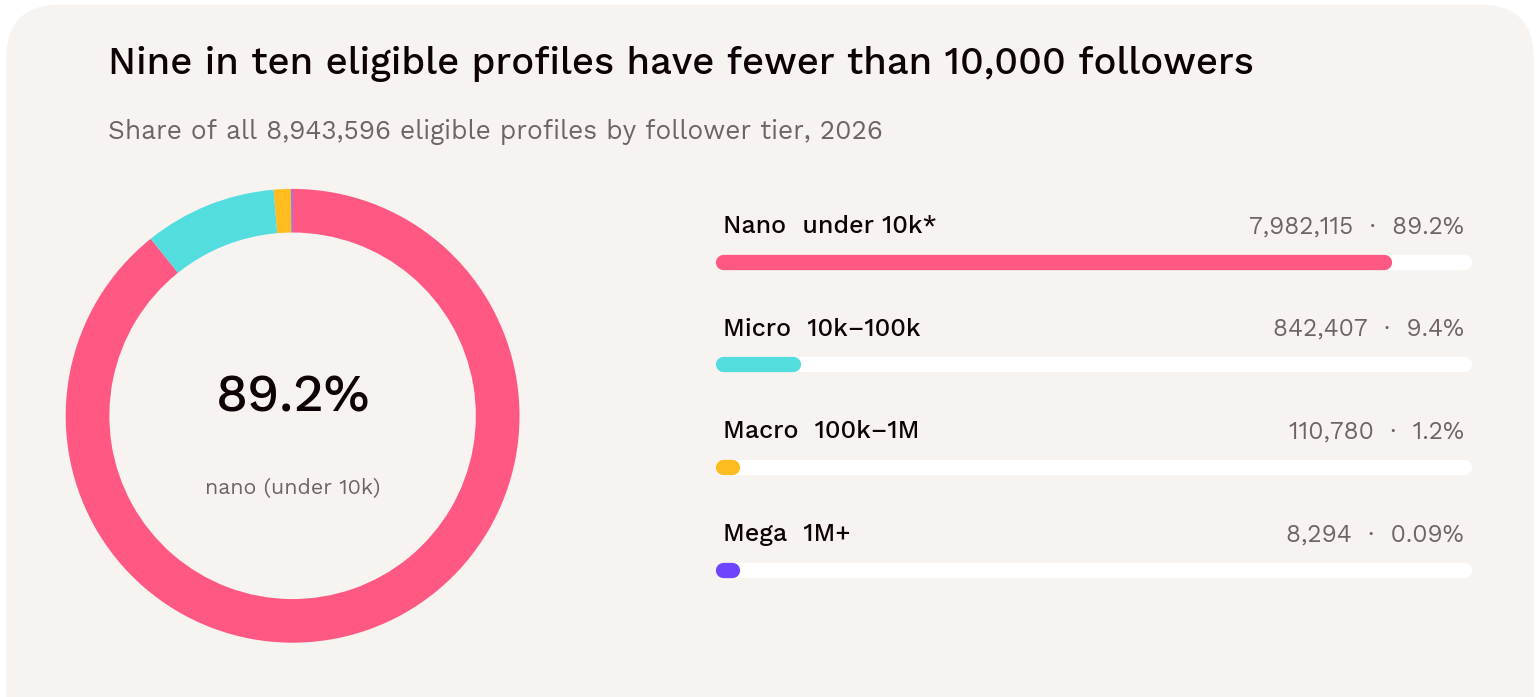
About 89% of the 8,943,596 eligible profiles have fewer than 10,000 followers. Micro-influencers (10k–100k) account for 9.4%, macro-influencers (100k–1M) for 1.2% and mega-influencers (1M+) for 0.09%. In total, 961,481 profiles, or 10.8%, have 10,000 followers or more. [1]

Tier

Follower band

Profiles

Share of all eligible profiles

Nano *

Under 10k

7,982,115

89.2%

Micro

10k–100k

842,407

9.4%

Macro

100k–1M

110,780

1.2%

Mega

1M+

8,294

0.09%

Total


8,943,596

100.0%

Source: Influencity proprietary 2026 * Derived as eligible profiles minus the three larger tiers, so it includes the ~0.2% of profiles not assigned to any tier. [1]

Figure 16 → Follower-tier mix of all eligible profiles. Every share uses the same 8,943,596 denominator. Source: [1].

A Steep Pyramid

Each step up the follower ladder is much smaller than the one below:

  • There are about 9.5 nano profiles for every micro profile.
  • There are 7.6 micro profiles for every macro profile.
  • There are 13.4 macro profiles for every mega profile.

Put another way, for every 100,000 estimated Instagram users there are about 437 micro, 58 macro and 4 mega profiles. A brand looking for large accounts is choosing from a pool of a few thousand nationally; a brand working with smaller creators has hundreds of thousands to choose from. [1]

Larger Tiers Are Concentrated in California & New York

California and New York hold 32.7% of all eligible profiles, but 50.4% of micro, 67.6% of macro and 79.2% of mega profiles. California alone accounts for 4,510 of the 8,294 mega profiles (54.4%); New York contributes another 2,056 (24.8%). [1]
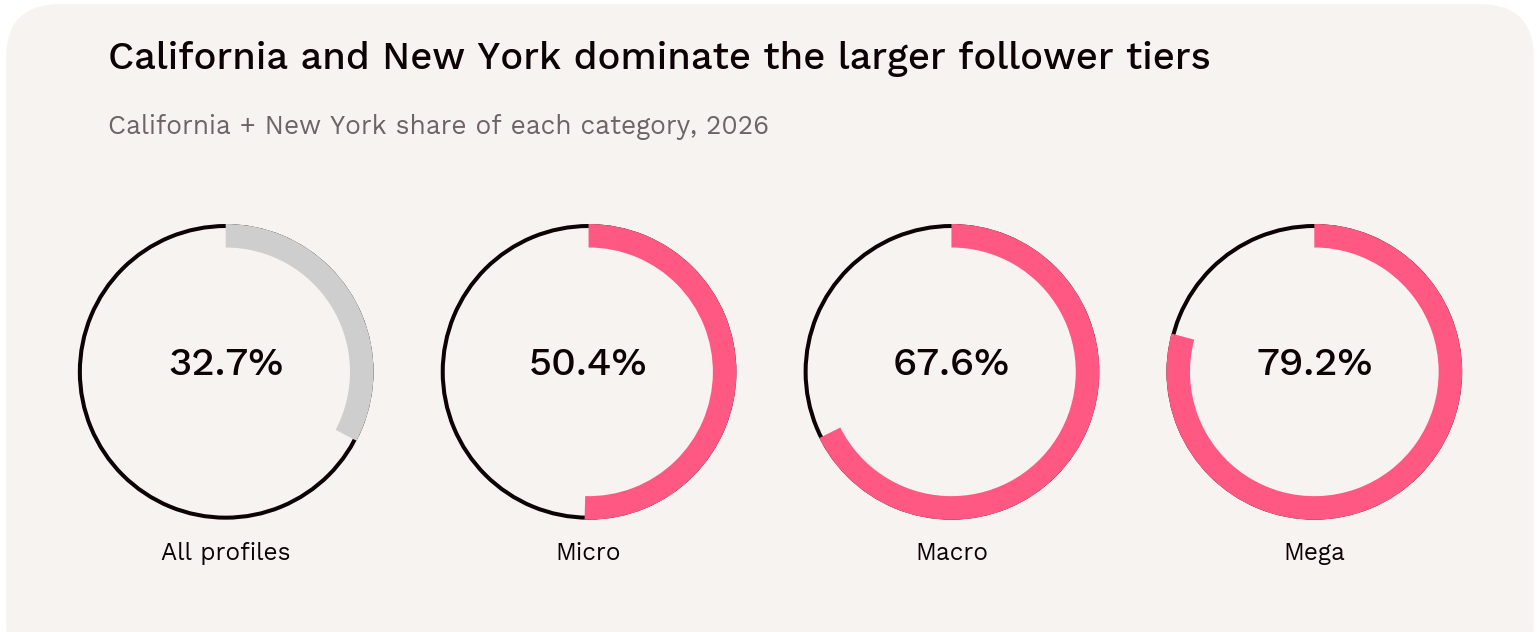
Figure 17 → California + New York share by category. These tier columns reconcile in all 50 states. Source: [1].

The concentration rises steadily with size. The five states with the most creators in each tier hold:

  • 52.5% of nano profiles
  • 72.0% of micro profiles
  • 84.6% of macro profiles
  • 92.0% of mega profiles

Six states (Iowa, Maine, Rhode Island, Vermont, West Virginia and Wyoming) record no mega profiles at all. Per 100,000 estimated users, California and New York have about 19 and 18 mega profiles, against 4.3 nationally and 1.1 across the other 48 states. [1]
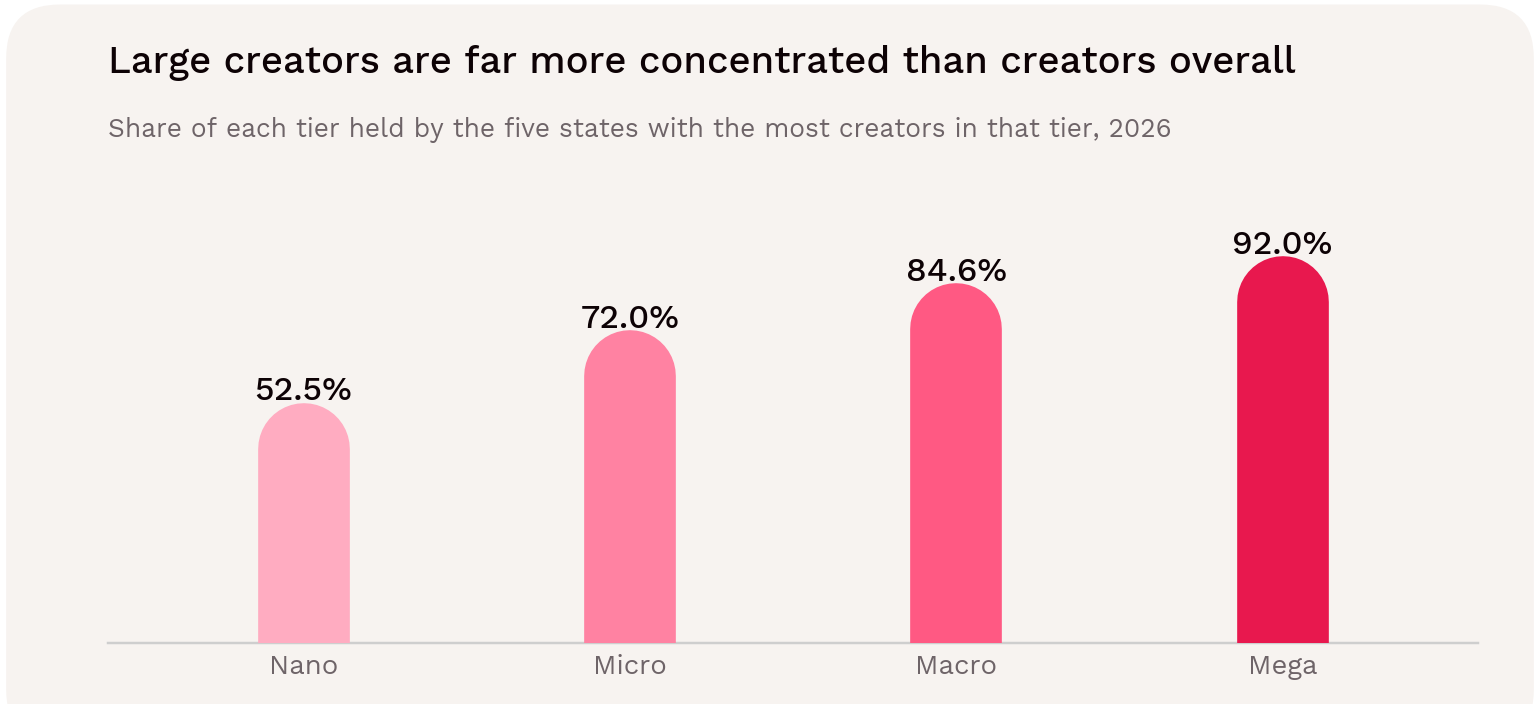
Figure 18 → Share of each tier held by the five states with the most creators in that tier. Source: [1].

The share of profiles with 10,000+ followers varies widely by state. It is highest in California (18.6%), New York (15.3%), Nevada (12.9%), Florida (11.6%) and Hawaii (11.0%), and lowest in West Virginia (2.2%), Delaware (3.0%), Mississippi and Arkansas (both 3.1%). Outside California and New York, only 7.6% of profiles have 10k+ followers. Section 05 shows that the states dense in small creators, such as Louisiana and Mississippi, are a different kind of market from the large-creator hubs. [1]

A national brand seeking large profiles should therefore distinguish where creators are based from where their audiences can be reached. A mega creator based in Los Angeles may have followers across the country, or concentrated somewhere else entirely.
The Gender Split Narrows As Instagram Influencers Grow

Tier

Female share of classified

Unclassified share of tier

Basis

Nano 

60.7%

20.4%

47 consistent states

Micro

55.0%

31.6%

50 states

Macro

56.3%

27.2%

50 states

Mega

50.1%

21.5%

50 states

Source: Influencity proprietary 2026 data,[1]

Figure 19 → Female share among classified profiles falls from 60.7% in the nano tier to 50.1% in the mega tier. Source: [1].

The mega records contain 3,261 female-classified and 3,247 male-classified profiles: a difference of just 14. Another 1,786 are unclassified.

The micro tier has the largest unclassified share, at 31.6%. One possible reason is that mid-sized accounts more often represent brands, organisations or publications, which have no individual gender to classify. The data has no account-type field, so this remains a hypothesis. These patterns describe classification coverage, not the gender identities of every creator or their audiences.

Because larger creators are more balanced and are concentrated in California and New York, those two states are also the most gender-balanced overall (section 07). [1]

How the US Instagram Influencers Compare

The tier shape is similar across Influencity's 2026 Instagram data:
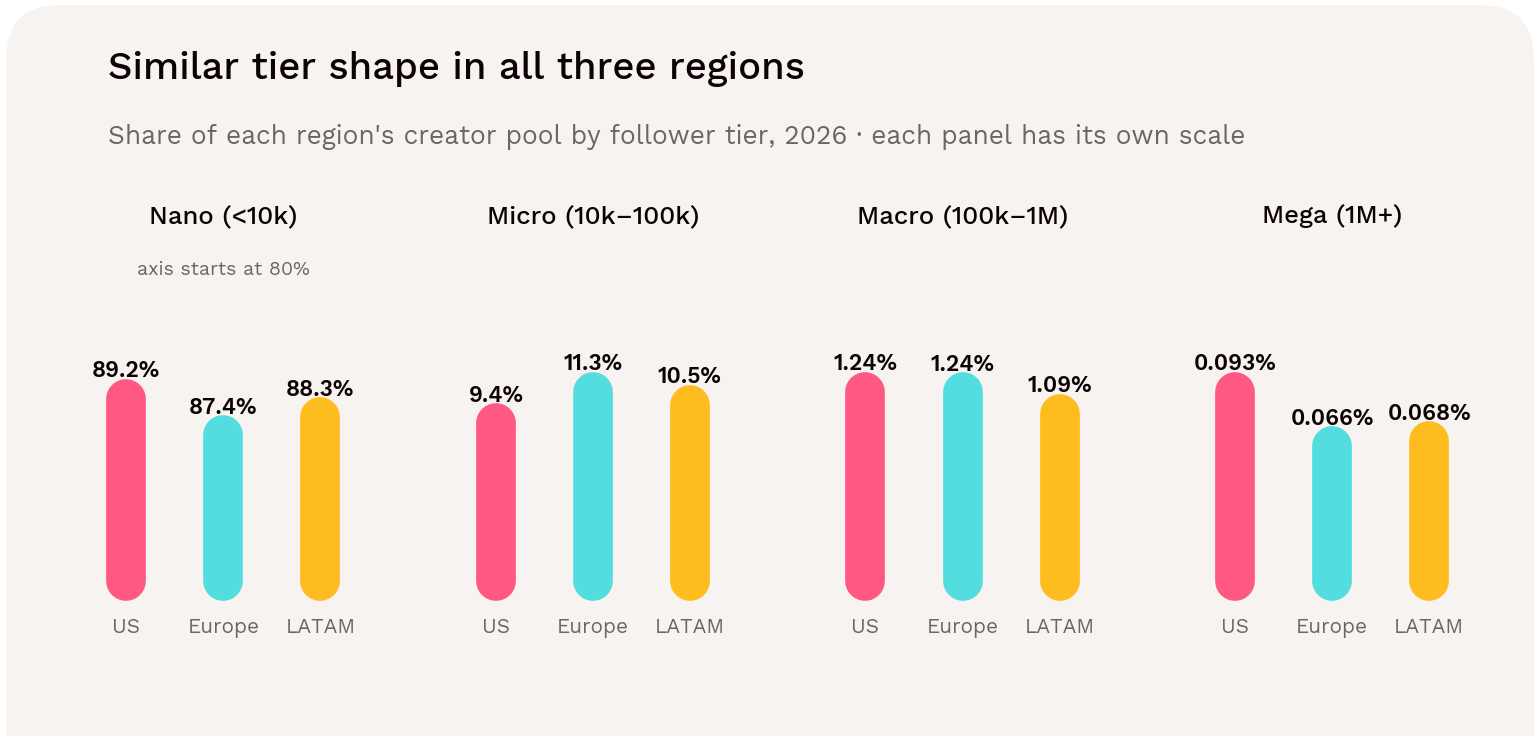
  • Nano makes up about 87–89% in all three regions.
  • The US has a slightly smaller micro share (9.4%) than Europe (11.3%) or Latin America (10.5%).
  • It has a slightly larger mega share (0.09%, against 0.07% in both).

Tier

US

Europe

LATAM

Nano (<10k)

89.2%

87.4%

88.3%

Micro (10k–100k)

9.4%

11.3%

10.5%

Macro (100k–1M)

1.24%

1.24%

1.09%

Mega (1M+)

0.093%

0.066%

0.068%

Source: Share of each region's Instagram creator pool by follower tier, 2026. US shares use all eligible profiles; Europe and Latin America use reported tier entries, so differences are indicative. Sources: [1, 9, 10].

Figure 20 → Share of each region's Instagram creator pool by follower tier, 2026. US shares use all eligible profiles; Europe and Latin America use reported tier entries, so differences are indicative. Sources: [1, 9, 10]

The denominators differ in that European and Latin American shares use reported tier entries, so treat these as indicative rather than exact differences. [1, 9, 10]

Category evidence on tier performance

Two other Influencity studies measured what this dataset did not. In the supplements study, average engagement fell from a reported 57% for creators under 100k followers to 24% above 1M. In food, micro-creators accounted for more than half of tagged posts in 10,568 social mentions. See section 13 for samples and caveats. [11, 12]

What Can Marketers Reasonably Take from This?

The distribution supports testing a portfolio of smaller creators rather than assuming that campaign planning begins with celebrity accounts. Smaller creators are everywhere, large creators are scarce and clustered in two states. The distribution does not establish superior conversion, authenticity or affordability for any tier. Those questions need performance and commercial data.

09 → CREATOR NICHES AND STATE WEALTH

Do Richer States Have More Instagram Influencers in the U.S.?

No. A state's wealth does not predict how many creators it has. Across the 50 states, median household income shows no meaningful link with eligible profiles per 1,000 residents (rank correlation −0.05) or with influencer density (−0.15). The same is true using GDP per capita (−0.05 and −0.12). [1, 12,13]

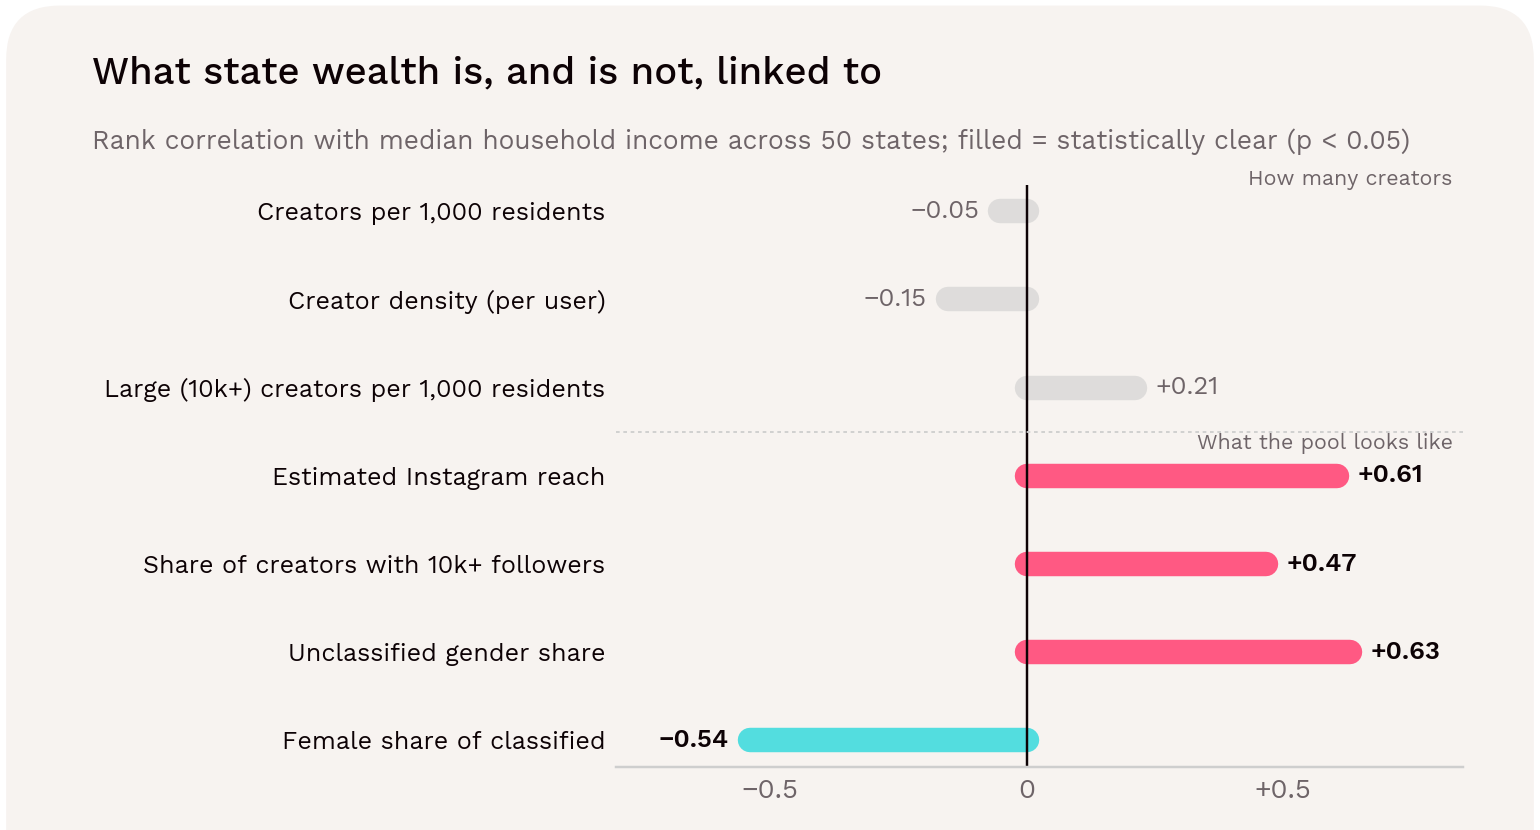
Wealth is, however, clearly linked to the kind of creator pool a state has. Richer states have more of their creators in the larger follower tiers, more gender-balanced pools, more unclassified profiles and a higher estimated Instagram reach. [1, 12]
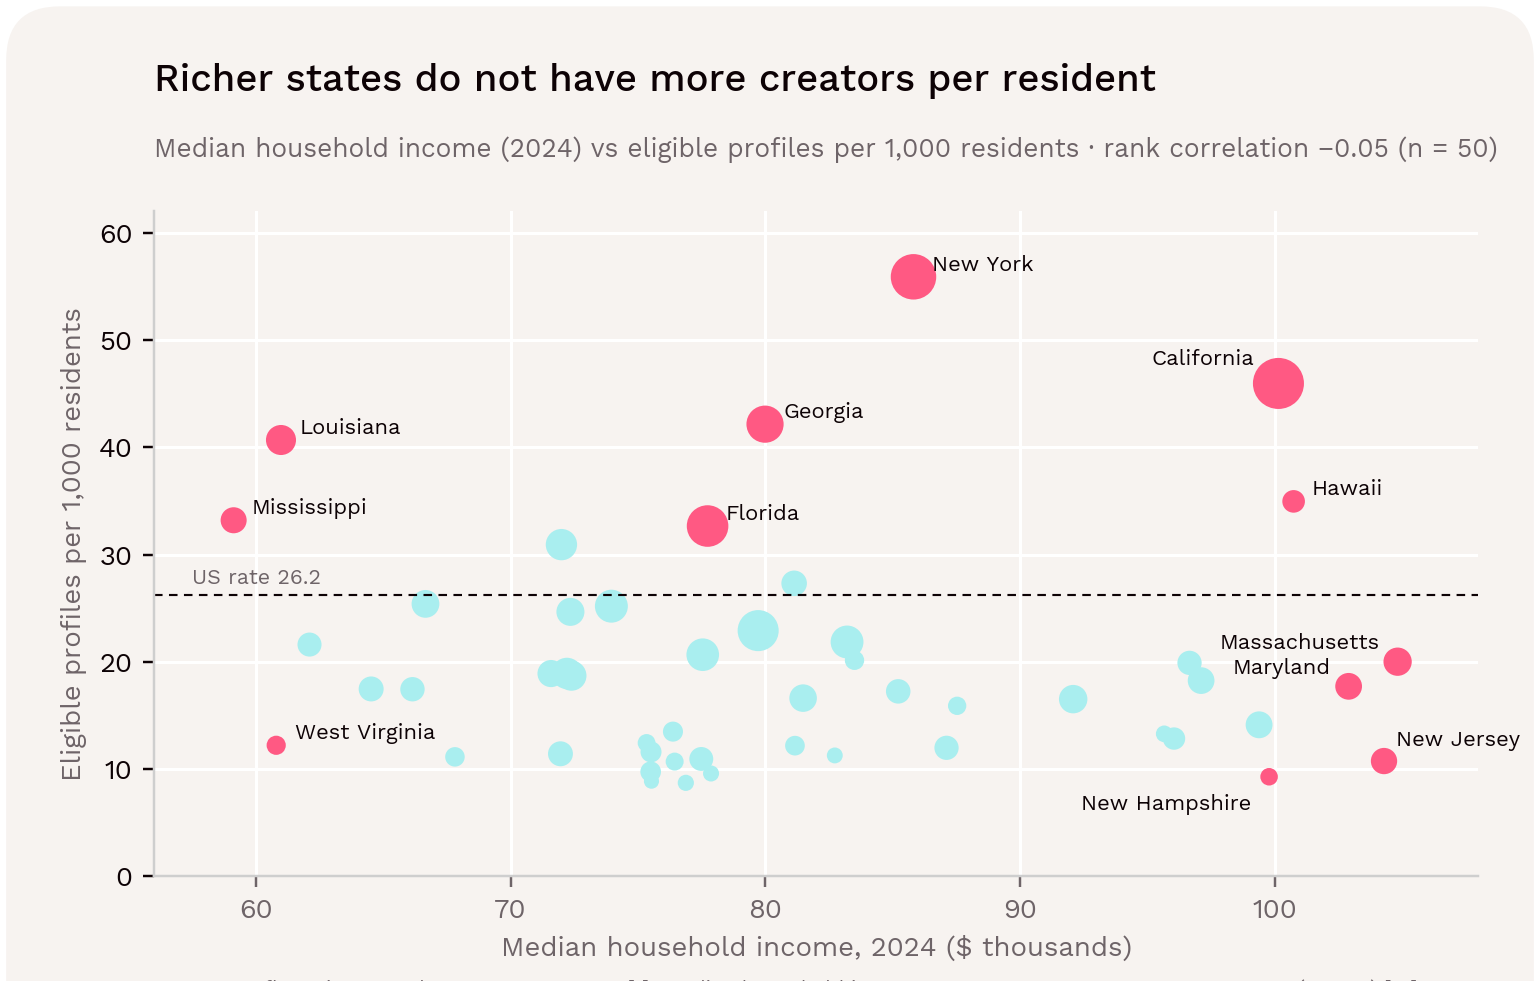
Figure 21 → Median household income (2025) against eligible profiles per 1,000 residents, 50 states. Sources: [1, 12].

How Instagram Influencer Supply Relates to State Wealth

The comparison in these sections uses two standard wealth measures:
  • Median household income from the US Census Bureau's American Community Survey (2024, 1-year estimates) [12].
  • Real GDP per capita from the US Bureau of Economic Analysis (2024) [13].

Creator measure

Rank correlation with median household income

Statistically clear?

With GDP per capita

Eligible profiles per 1,000 residents

−0.05

No

−0.05

Creator density (profiles per user)

−0.15

No

−0.12

Large (10k+) creators per 1,000 residents

+0.21

No

+0.15

Estimated Instagram reach (users / population)

+0.61

Yes

+0.43

Share of creators with 10k+ followers

+0.47

Yes

+0.37

Unclassified gender share

+0.63

Yes

+0.37

Female share of classified profiles

−0.54

Yes

−0.40

Sources: Influencity proprietary 2026 data [1]; median household income, ACS 2025 1-year [12]; GDP per capita, BEA 2025 [13]. "Statistically clear" means p < 0.05 across 50 states. Excluding New York and California does not change any conclusion

Figure 22 → Rank correlation between median household income and each creator measure across the 50 states. Sources: [1, 12].

Wealth Doesn't Determine How Many Instagram Influencers a State Has

The states with the most creators per resident include some of the richest and some of the poorest. California ($100,149 median household income) and New York ($85,820) are high-income states. Mississippi ($59,127, the lowest of any state) and Louisiana ($60,986) also rank among the top six for creators per resident.

At the other end, three of the richest states have few creators relative to their population:

  • New Jersey ($104,294): 10.8 per 1,000
  • New Hampshire ($99,782): 9.3 per 1,000
  • Massachusetts ($104,828): 20.0 per 1,000

Grouping states into thirds by income shows no gradient. The typical state has:

  • 18.9 creators per 1,000 residents in the lower-income third
  • 12.8 in the middle third
  • 17.3 in the higher-income third

Like age (section 06), wealth can be ruled out as the main reason some states have more influencers. That leaves the explanations in sections 02 and 05: creative and media industries, local creator scenes, and how profiles are assigned to states. [1, 12]

Wealth Shapes the Type of Instagram Influencer Pool

Richer states differ in what their creator pools look like:

  • More macro-influencers, proportionally. In richer states, a higher share of creators have 10,000+ followers (+0.47). The typical state has 7.2% of its creators at 10k+ in the higher-income third, against 4.8% in the lower-income third. Mississippi, Arkansas and West Virginia, all lower-income states, have among the smallest shares of large creators (3.1%, 3.1% and 2.2%).
  • But not more large creators per resident. The number of 10k+ creators per 1,000 residents is only weakly linked to income (+0.21, not statistically clear). Richer states don't have many more large creators; they have fewer small ones relative to their population. Their pools lean larger.
  • More gender-balanced pools. Female share falls as income rises (−0.54). This follows from the tier pattern in sections 07 and 08: larger creators are more balanced, and richer states have proportionally more of them.
  • More unclassified profiles. Richer states have higher unclassified shares (+0.63), consistent with larger accounts more often being brands or organizations (section 07).
  • Higher estimated Instagram reach. Richer states have more estimated Instagram users relative to population (+0.61). That reach does not turn into more creators per user (section 04).

The overall picture is that lower-income states, especially in the Southeast, tend to have dense pools of small, local influencers. Higher-income states tend to have pools that lean towards larger, more professional-looking accounts. Neither pattern says which delivers better campaign results. [1, 12]
How to read this finding

These are associations across 50 states, not causes. State wealth describes residents, not creators, and cannot be applied to individual creators.

09b → CREATOR NICHES AND STATE WEALTH

Which Niches Do US Instagram Influencers Work in?

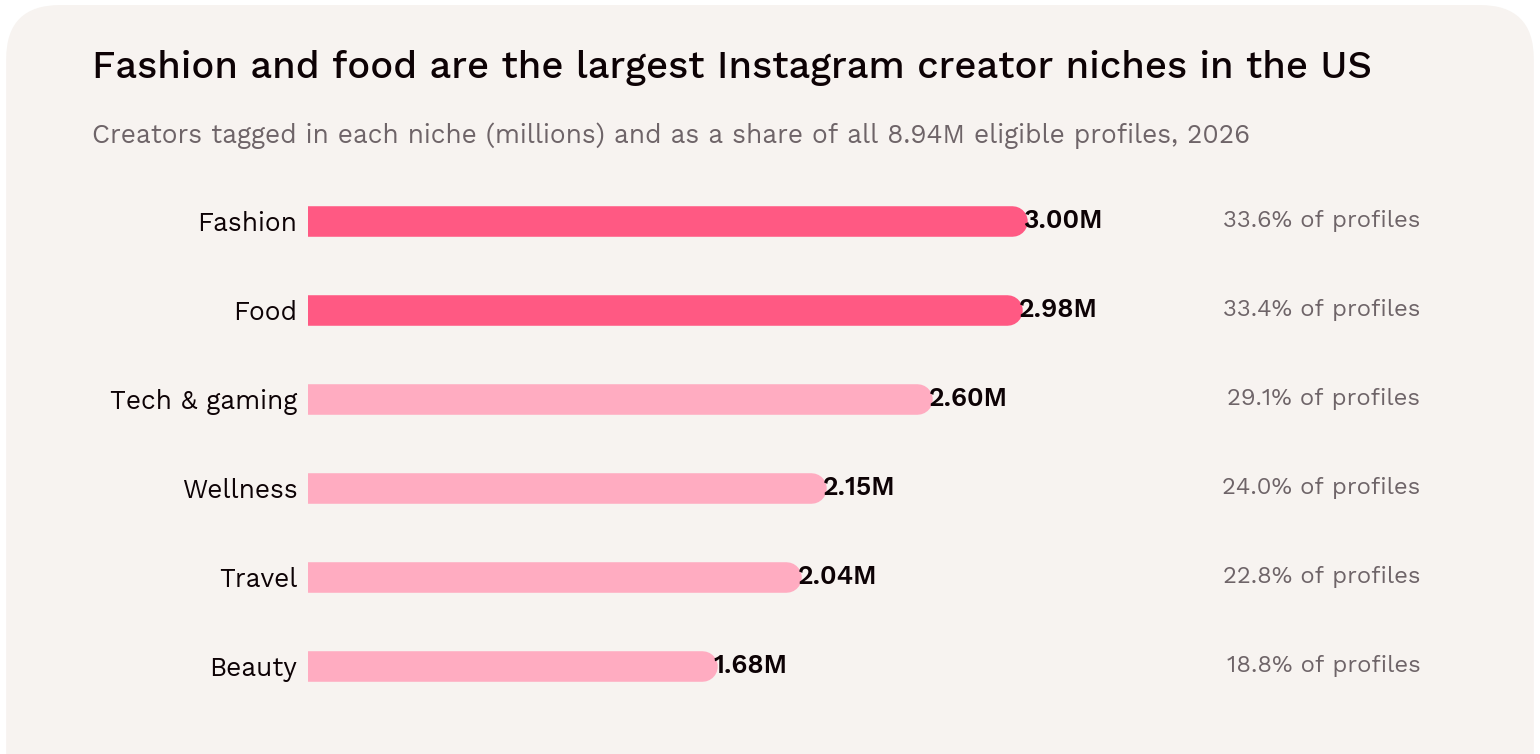
Fashion and food are the largest influencer niches on US Instagram. About 3.0 million eligible profiles are tagged in each, roughly a third of the 8.94M pool. Tech and gaming is third (2.60M), followed by wellness (2.15M), travel (2.04M) and beauty (1.68M). [11]

Creator niche

Female

Male

Gender neutral

Total

Share of all eligible profiles

Retail & fashion

1,509,427

788,071

706,644

3,004,142

33.6%

Food & drink

1,234,426

877,331

872,777

2,984,534

33.4%

Tech & gaming

1,054,920

891,629

653,600

2,600,149

29.1%

Wellness

965,291

652,355

531,491

2,149,137

24.0%

Travel & hospitality

979,937

652,768

408,868

2,041,573

22.8%

Beauty

1,065,641

318,926

298,056

1,682,623

18.8%

Sum of niches

6,809,642

4,181,080

3,471,436

14,462,158

161.7%

Source: Influencity 2026 niche data, US Instagram [11]. Creators can be tagged in more than one niche, so niche totals sum to 1.62 times the 8,943,596 eligible profiles and shares do not add to 100%. "Gender neutral" = no gender classification.

Figure 23 → Creators tagged in each niche, and as a share of all eligible profiles. Source: [11].

Most Instagram Influencers Work across More than One Niche

On average, each eligible profile appears in about 1.6 of the six niches. Influencer content rarely fits a single category: fashion overlaps with beauty and travel, food with wellness and travel.

For brands, a creator found through a fashion search may also reach a food or travel audience. For campaign reporting, niche counts must never be added together to estimate a market size. [11]

Gender Varies Sharply by Niche

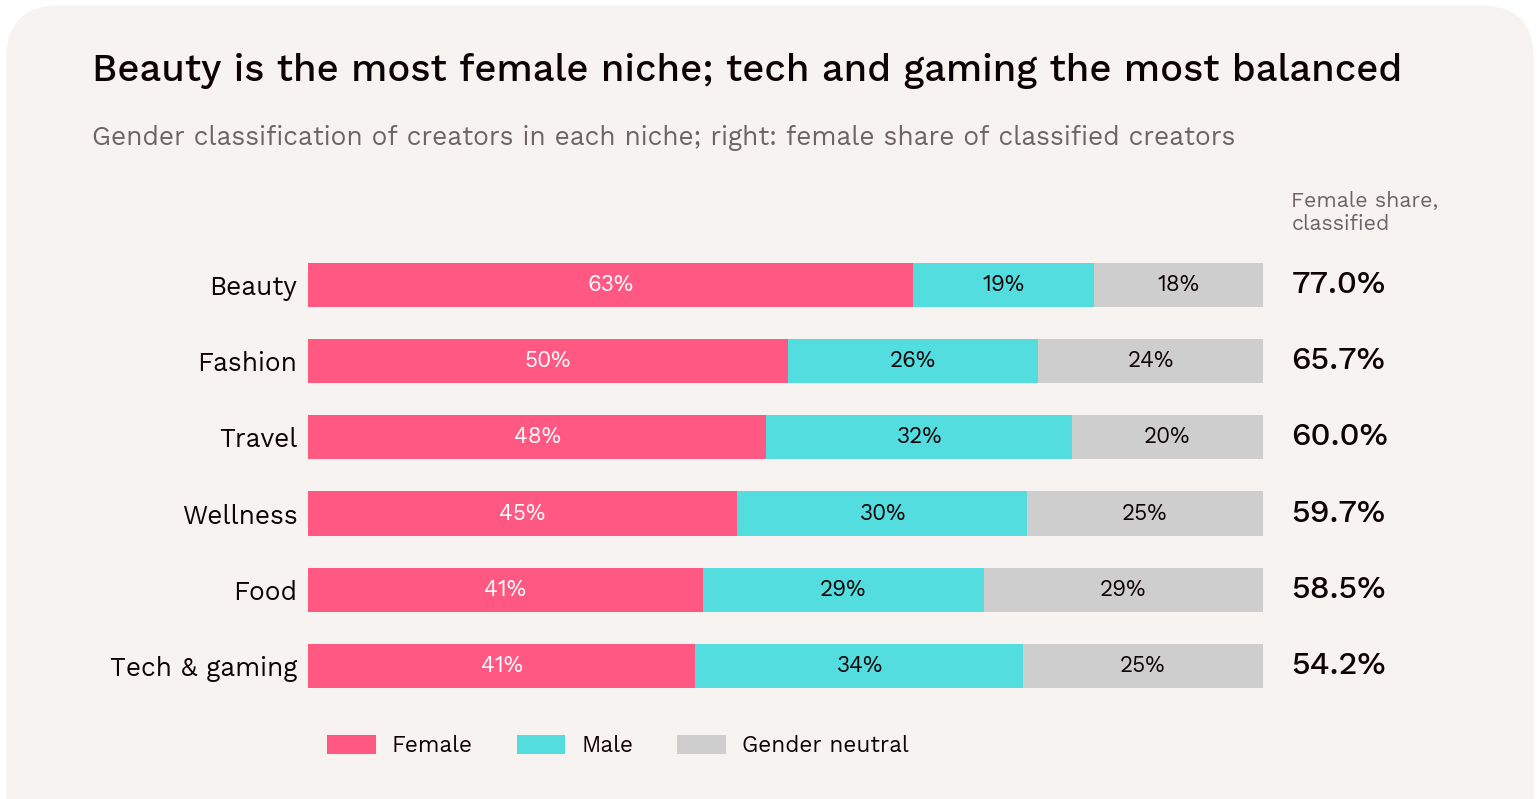
Across all eligible profiles, 60.2% of classified creators are female (section 07). Within niches, the figure ranges from 54.2% to 77.0%:
Creator niche

Female share of classified

Female : male ratio

Gender-neutral share

Beauty

77.0%

3.3 : 1

17.7%

Retail & Fashion

65.7%

1.9 : 1

23.5%

Travel

60.0%

1.5 : 1

20.0%

Wellness

59.7%

1.5 : 1

24.7%

Food

58.5%

1.4 : 1

29.2%

Tech & gaming

54.2%

1.2 : 1

25.1%

Source: [11]. Female share = female ÷ (female + male).

Figure 24 → Gender classification of creators in each niche. Source: [11].

Key Points

  • Beauty is the most female niche. Three in four classified beauty creators are female. Male creators are still a substantial group: almost 319,000 profiles, or 1 in 4 classified beauty influencers.
  • Fashion leans female too (65.7%), the only other niche clearly above the national figure.
  • Tech and gaming is the most balanced niche, but still has a female majority among classified creators (54.2%). This contrasts with the common view of tech and gaming as male-dominated content areas.
  • Travel, wellness and food sit close to the national average (58–60%).
  • Food has the highest gender-neutral share (29.2%), consistent with more restaurant, recipe and brand accounts, which have no individual gender. Beauty has the lowest (17.7%), consistent with personal, face-to-camera content.

These are classification labels, not self-identified gender, and they describe creators, not their audiences. [11]

What Niche Data Tells Brands

  • Every niche offers a deep national pool. Even beauty, the smallest of the six, has 1.68M tagged profiles, about one in five eligible creators.
  • Expect overlap. Searching across related niches will surface many of the same creators. Plan discovery by content fit, not niche label alone.
  • Don't assume niche stereotypes. Tech and gaming has a female majority among classified creators, and beauty has more than 300,000 male-classified creators. Briefs that need a specific creator profile should search on it directly.

10 → BEYOND THE RANKING

Six State-Level Insights Marketers Should Not Miss

The national figures hide very different state markets. These six spotlights show how size, creator density, audience reach and creator mix combine in practice, and why no single ranking is enough to plan a campaign. [1]
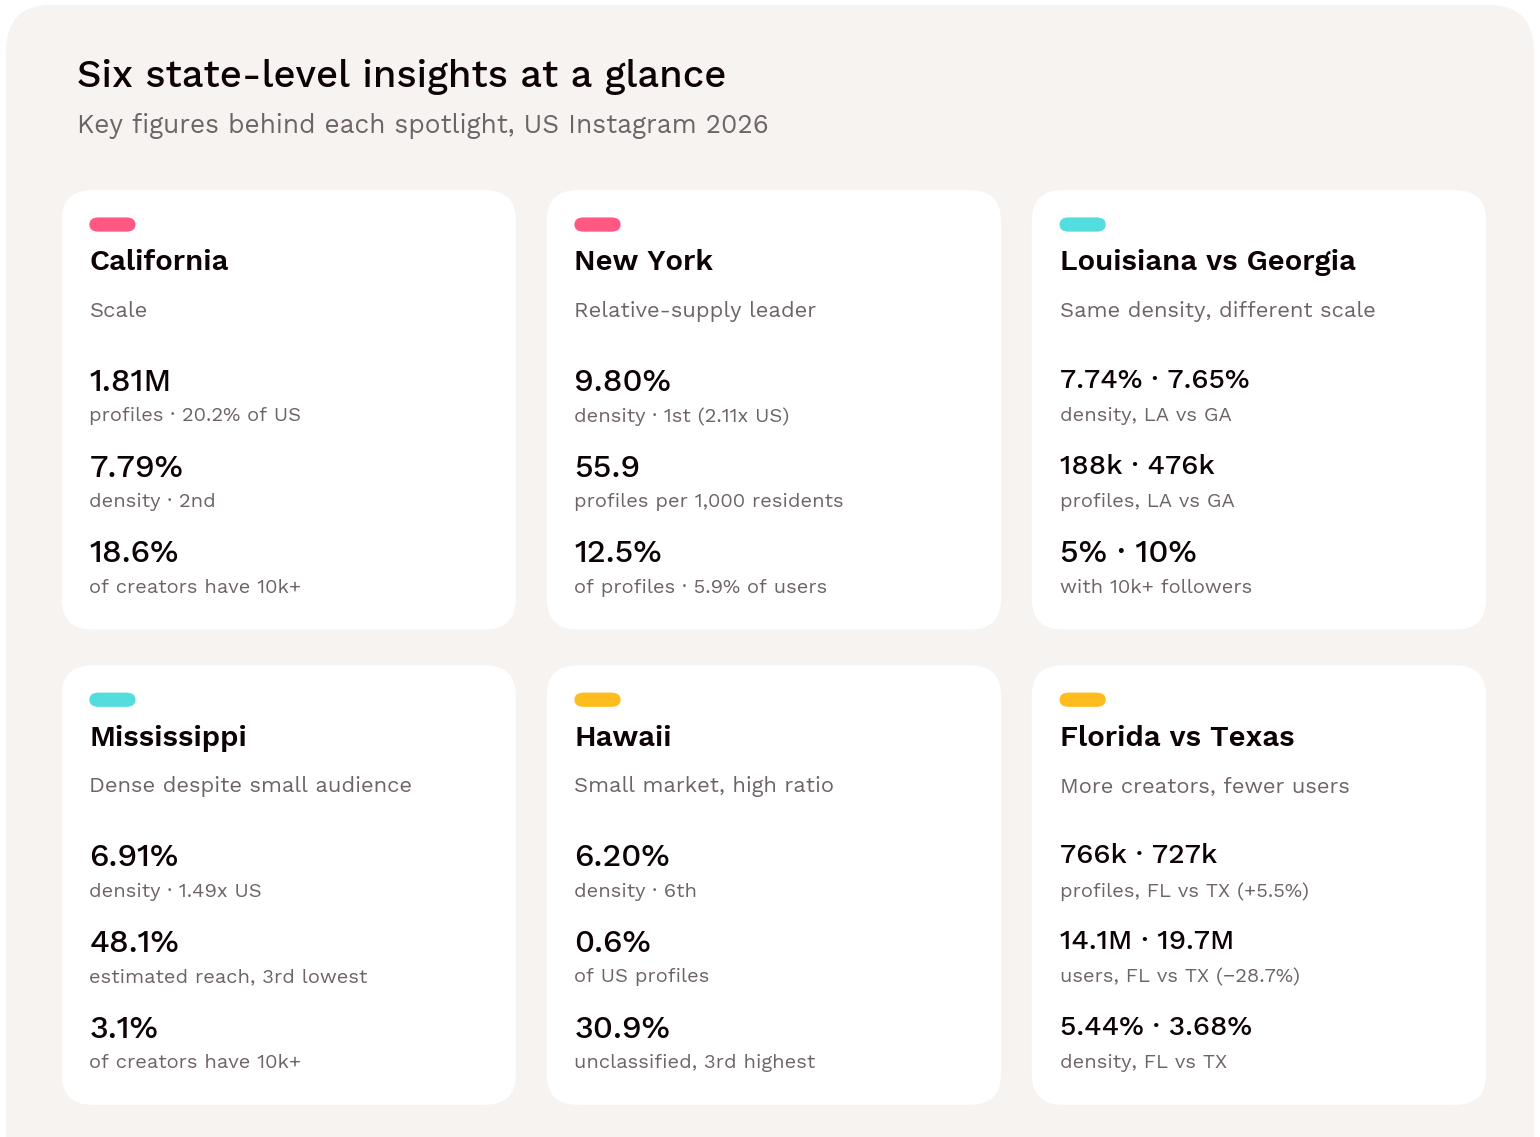
Figure 25 → Key figures behind each of the six state spotlights. Source: [1].

California: Scale, with a Disproportionate Share of Supply

California contributes 20.2% of recorded eligible profiles, compared with 12.1% of estimated Instagram users. Its 1.81M-profile universe makes it the largest starting point for broad discovery, but state location alone cannot identify the right audience or eliminate duplicate audience exposure. [1]

California is also where large creators are concentrated:

  • 18.6% of its creators have 10,000+ followers, the highest share of any state.
  • It holds 4,510 of the country's 8,294 mega profiles (54.4%).
  • It is the most gender-balanced state (55.7% female among classified profiles).
  • It has one of the highest unclassified shares (29.2%), consistent with more brand and organisation accounts among larger profiles (sections 07 and 08).

Highlight

For large creators, California is the national centre of gravity. For local relevance, its size means audience location must be checked creator by creator. [1]

New York: The Clearest Relative-Supply Outlier

New York has 12.5% of the eligible profile pool and 5.9% of estimated users. Its 9.80% density, 2.11 times the national benchmark, is roughly one eligible profile for every ten estimated users. This is a market-level ratio, not a claim that one in ten individual Instagram users is a professional creator. [1]

New York ranks first on both relative measures:

  • Creator density: 9.80%.
  • Creators per resident: 55.9 per 1,000, more than twice the national 26.2.

Its estimated Instagram reach (57.0%) is close to the national average, so the gap comes entirely from creator supply, not audience size. New Jersey, next door, has one of the lowest densities (1.85%). That contrast suggests some creators living in the wider New York area may be recorded in New York (section 05). [1]

Highlight

New York offers more creator choice relative to its audience than anywhere else in the country.

Louisiana & Georgia: Similar Density, Different Scale

Louisiana has 187,854 eligible profiles and 7.74% density; Georgia has 476,441 and 7.65%. Georgia offers more than twice the absolute supply, while Louisiana has a slightly higher profile-to-user ratio. The distinction matters when choosing between a broad recruitment pool and a smaller regional test. [1]

The two states reach their high density in different ways:
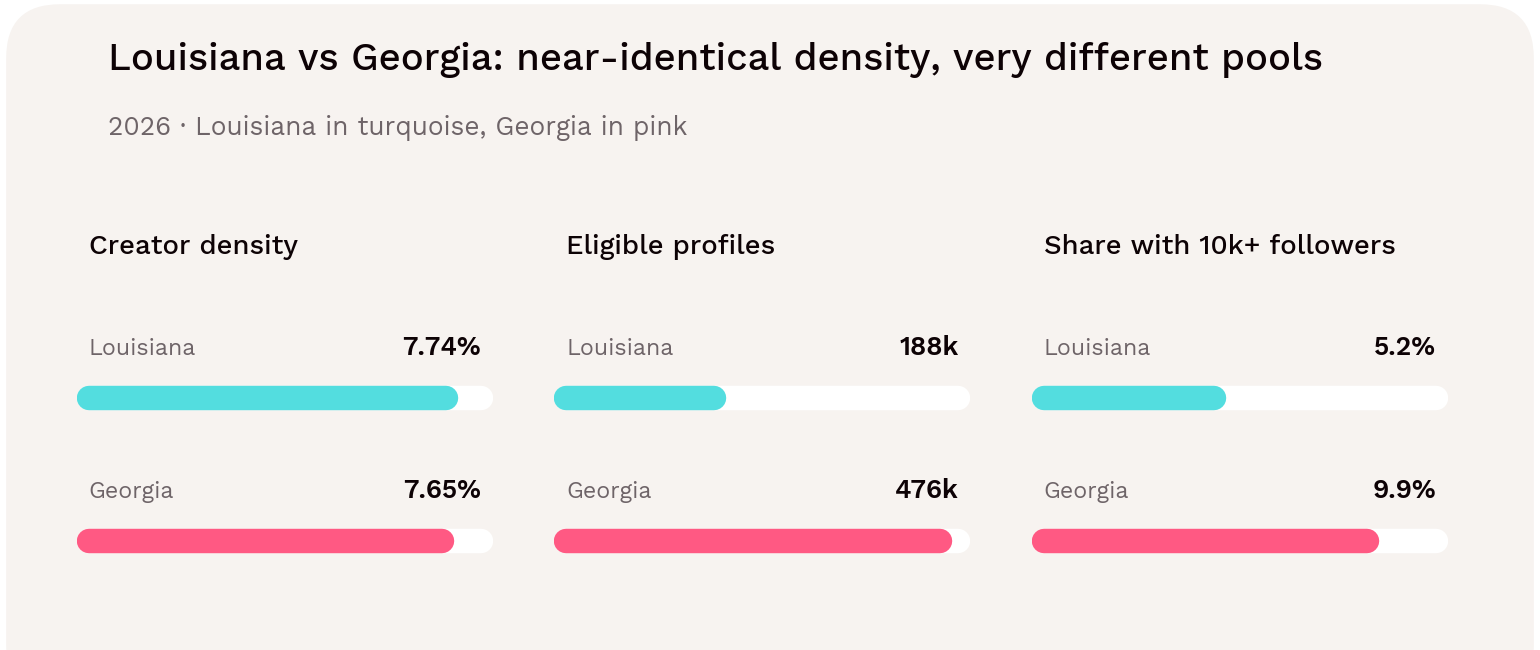
  • Georgia has a mixed pool: 9.9% of its creators have 10k+ followers, close to the national 10.8%, and it records 302 mega profiles.
  • Louisiana is dense almost entirely in small creators. Only 5.2% have 10k+ followers, and it has just 20 mega profiles.

Figure 26 → Louisiana and Georgia: near-identical creator density, very different pools. Source: [1].

Highlight

For large creators, Georgia; for many local, smaller voices, Louisiana. Both rank among the top four states for creators per resident (42.2 and 40.7 per 1,000).

Mississippi: High Density Despite a Smaller Estimated Audience

Mississippi records 98,071 profiles against 1.42M estimated users. Its 6.91% density is about 49% above the national benchmark, even though its estimated audience-to-population ratio is only 48.1%, the third-lowest of any state. Audience scale and relative creator supply clearly do not move in lockstep. [1]

Mississippi is the clearest case of a nano-creator state:

  • Only 3.1% of its creators have 10,000+ followers.
  • It has the lowest unclassified share in the country (11.1%), consistent with a pool of personal rather than brand accounts.
  • It has the lowest median household income of any state, at $59,127 in 2024, yet ranks sixth for creators per resident. Wealth does not predict creator supply (section 09). [1, 12]

Highlight

Dense, personal, local creator networks, but few large accounts.

Hawaii: Small Market with an Above-Average Ratio

Hawaii contributes just 0.6% of US eligible profiles, but its 6.20% density is sixth-highest among states, and it ranks fifth for creators per resident (35.0 per 1,000). That combination illustrates why a market can be strategically interesting without appearing in the top ten by volume. A local campaign still needs evidence that the creator's audience is local. [1]

Hawaii's pool leans towards larger creators (11.0% with 10k+ followers, above the national 10.8%). It also has the third-highest unclassified share (30.9%). Both patterns fit a tourism economy with many travel and hospitality accounts, a hypothesis that state-level niche data could test (section 09).

Highlight

Small but outward-facing creator market. Creators based in Hawaii may have audiences far beyond the islands.

Florida vs Texas: More Profiles, Fewer Estimated Users

Florida has 766,282 profiles versus Texas's 726,574: 5.5% more supply, despite an estimated user base that is 28.7% smaller. Their densities are 5.44% and 3.68% respectively. This is a useful contrast for roster planning, not evidence that Florida campaigns will be cheaper or more effective. [1]
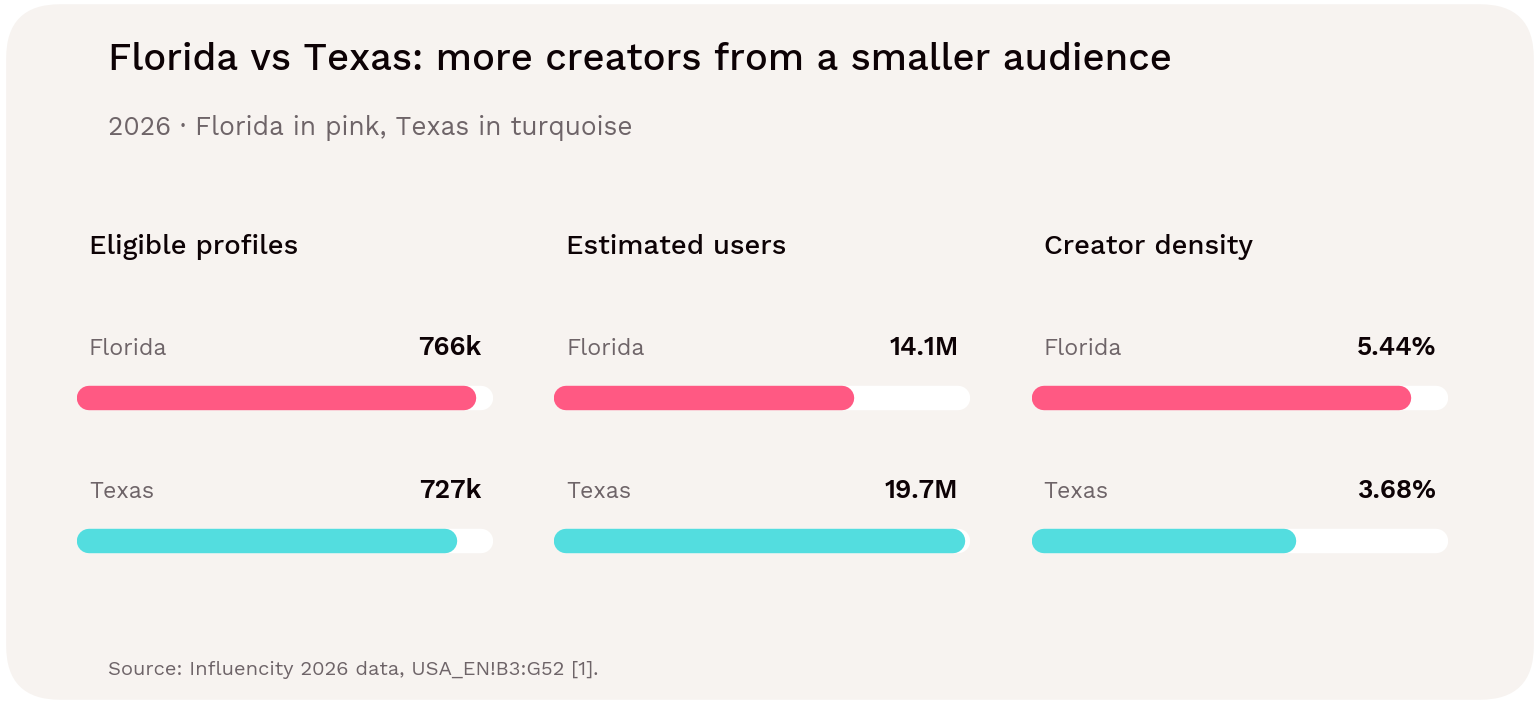
Figure 27 → Florida versus Texas: eligible profiles, estimated users and creator density. Source: [1].

The comparison also shows that age doesn't drive creator supply (section 06):

  • Texas is one of the youngest states (median age 35.2) and has the highest estimated Instagram reach (62.3%). Yet it ranks 17th for creator density.
  • Florida is one of the oldest (42.7) and ranks seventh.

Florida's pool also leans slightly larger: 11.6% of its creators have 10k+ followers against 9.1% in Texas, and it has more than twice as many mega profiles (526 against 240). [1, 6]
Highlight

Texas is an audience market; Florida is an influencer market.

11 → CROSS-PLATFORM CONTEXT

Instagram vs TikTok: What Does Influencer Density Tell Us?

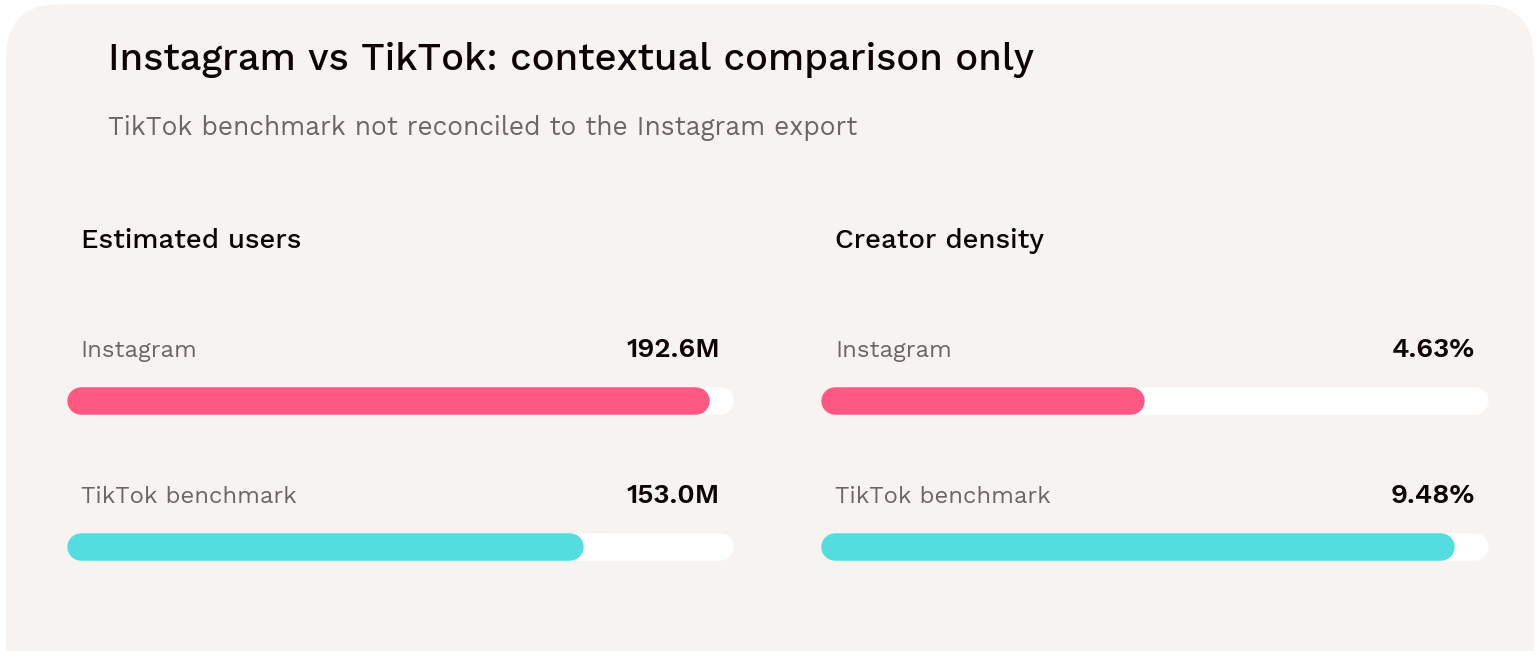
TikTok has about 9.5 influencer-eligible profiles per 100 estimated users, against Instagram's 4.64. On these inputs, TikTok's relative creator supply is roughly twice Instagram's. The comparison is contextual, the TikTok figures have not been reconciled with the Instagram export's geography, eligibility criteria or collection date. [1, 4]

At a glance

  • Instagram has a bigger audience. Its estimated 192.6M users are about 26% more than TikTok's 153.0M.
  • TikTok has a bigger creator pool. Its 14.5M eligible profiles are about 62% more than Instagram's 8.94M.
  • The two facts point in opposite directions. On Instagram there are about 21.5 estimated users for every eligible profile; on TikTok, about 10.6.
  • Category evidence favours Instagram on trust. In Influencity's supplements study, Instagram led TikTok on positive sentiment, disclosure and the study's trust index.

Platform

Estimated users

Eligible profiles

Creator density

Instagram

192.6M

8.94M

4.64%

TikTok benchmark

153.0M

14.5M

About 9.5%

Sources: Instagram data [1]. TikTok, supplied editorial benchmark [4], using rounded counts. Cross-platform methodological equivalence is not established.

Figure 28 → Contextual platform comparison, not a like-for-like census. Density is the profile count divided by the estimated user count. Sources: [1, 4].

A Larger User Base Is Not the Same as a Larger Influencer Pool

On these inputs, Instagram's estimated audience is about 26% larger, while TikTok's profile count is about 62% higher, so TikTok's density is roughly twice Instagram's. Put another way, each eligible Instagram profile is set against about 21.5 estimated users, compared with about 10.6 on TikTok. These are arithmetic comparisons of the supplied figures. They are not proof that one platform offers twice as many suitable or available partners, and "users per profile" is a market-level ratio, not the audience any individual creator can reach. [1, 4]
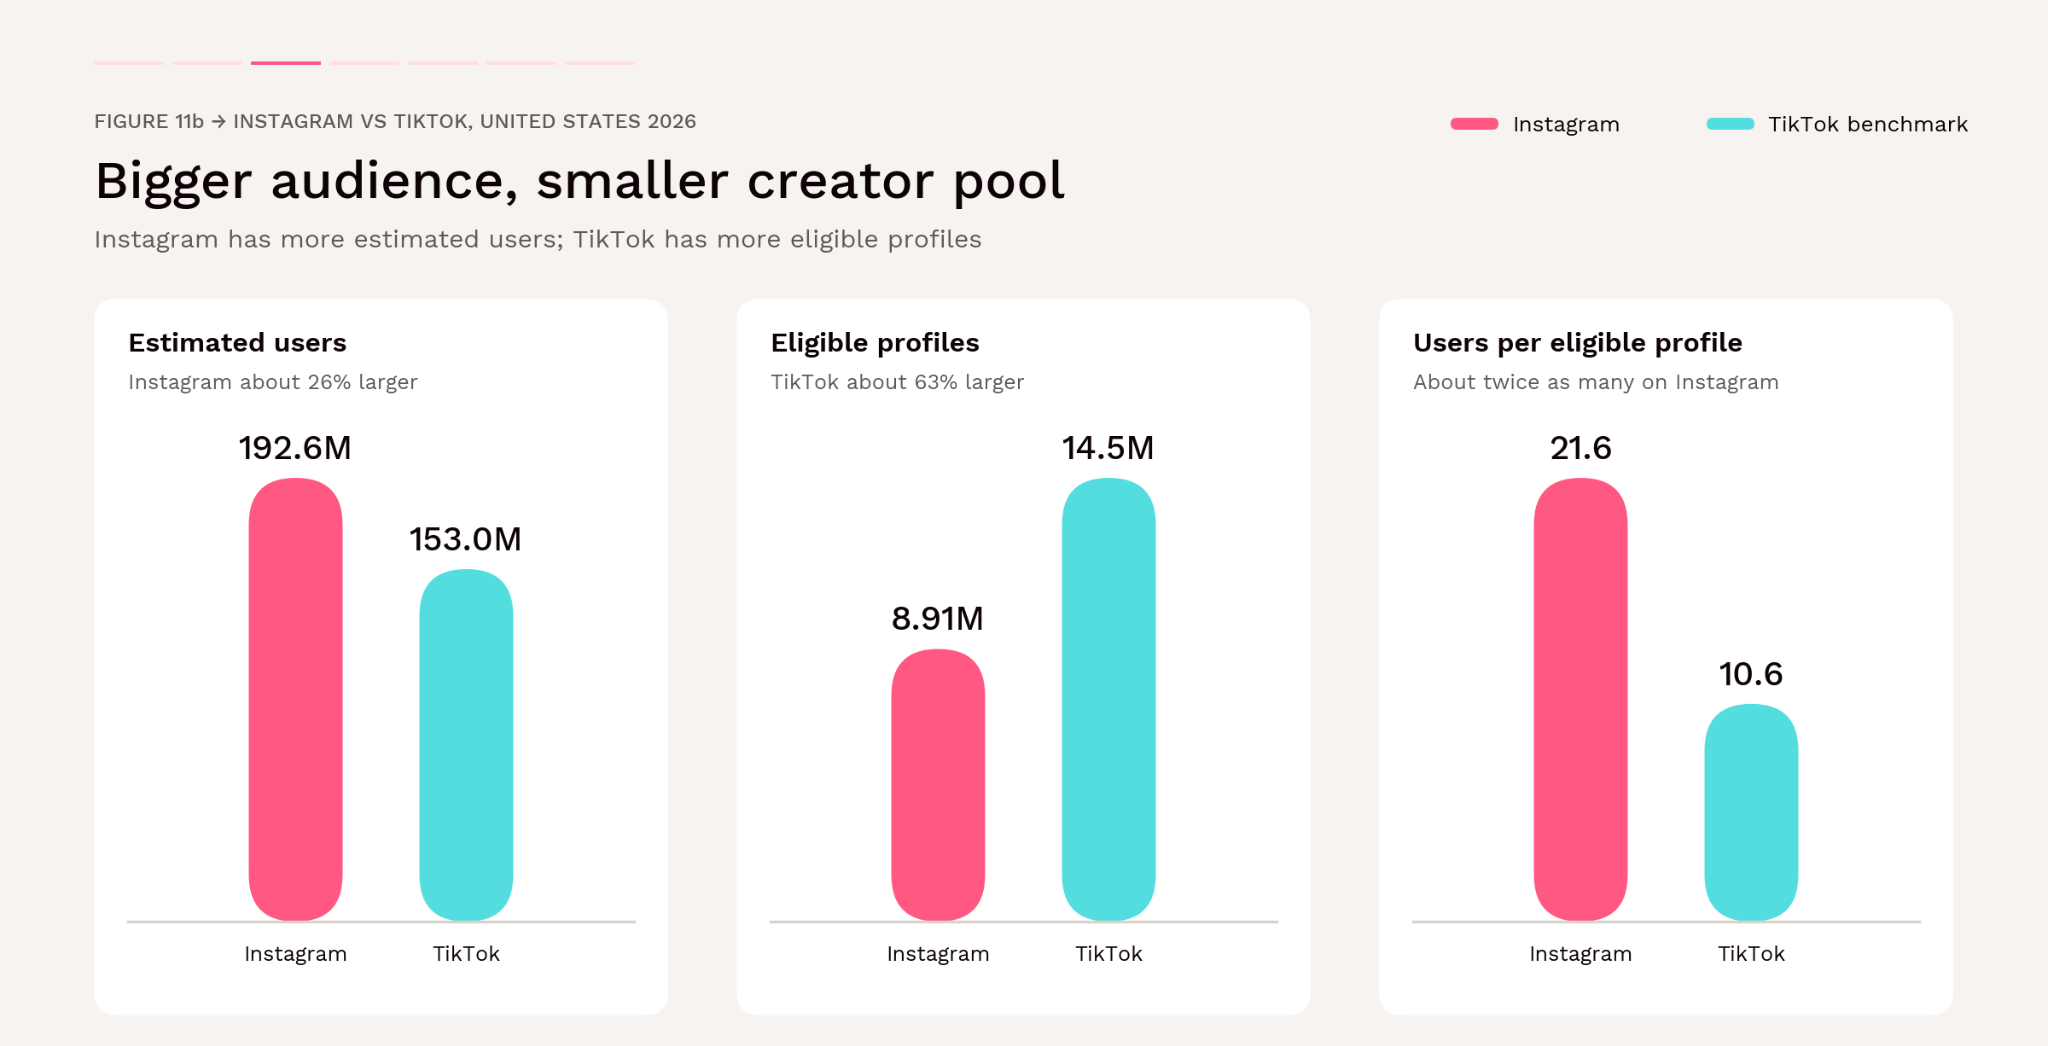
Figure 29 → Instagram has the larger estimated audience; TikTok has the larger creator pool. Each panel uses its own scale; users per eligible profile is a market-level ratio, not individual reach. Sources: [1, 4].

What the Density Gap Means for Brands

A denser influencer market gives brands more candidates to choose from, which can make TikTok a practical place to test many creators quickly, especially for campaign briefs that need volume or variety. A less dense market means each creator is competing with fewer peers for a larger estimated audience, which may help established Instagram creators hold attention.

What Our Supplements Study Adds on Platform Differences

In Influencity's supplements study (5,000+ sponsored posts, US and Mexico, January–June 2025), Instagram led TikTok on every trust and compliance measure reported: [7]
Measure (supplements study)

Instagram

TikTok

Gap

Positive comment sentiment

68%

58%

+10 pts

Explicit #ad or #sponsored disclosure

78%

66%

+12 pts

Proper disclosure placement

69%

58%

+11 pts

Posts avoiding disease or medical claims

89%

81%

+8 pts

Audience trust index (0–100)

69

23

3x higher

Sources: Influencity's supplements study [7].

YouTube sat between the two on sentiment (51% positive) and disclosure (70%), but the study did not report a trust score for it. Among the platforms the trust index scored, Instagram ranked highest. These results describe one regulated category in one six-month window, and they do not establish that Instagram outperforms TikTok in general. [7]

Bringing the Two Pictures Together

The density data and the category evidence suggest different strengths. TikTok offers more creators relative to its audience, which favours broad discovery and creative testing. In the supplements sample, Instagram showed stronger sentiment, disclosure and trust, which matters most for categories where credibility and compliance carry weight, such as health, beauty and finance. A reasonable starting hypothesis for a cross-platform campaign is to use TikTok to find and test creators at scale, and Instagram where trust and clear disclosure are central to the brief. Influencity's food study points the same way: its strongest California format was aesthetic TikTok video, while New York leaned on reviews and lists (section 14). [7, 8]

Key Takeaways

  1. TikTok's influencer pool is about twice as dense as Instagram's on the supplied figures, though Instagram's estimated audience is larger.
  2. Density measures choice, not quality: neither platform's count shows which creators will perform.
  3. Plan per platform, deduplicate creators across platforms, and never add the two totals together.

What this means for a cross-platform campaign

Build separate platform shortlists, then assess audience relevance, recent content performance, format suitability and commercial terms on each. A creator can have accounts on both platforms, so adding the two profile totals would overstate unique people, and adding the audience totals would ignore users who are on both. Compare platforms on the outcome the campaign is designed to produce, using consistent measurement windows, rather than on creator counts.

12 → HISTORICAL CONTEXT

How Has the US Instagram Influencer Marketing Scene Changed Since 2020?

Influencity's earlier US Instagram studies provide useful reference points. The US Influencer Marketing Study 2020 edition reported 8.3M influencers and 89.9M Instagram users. The US Influencer Marketing Study 2023 edition reported 10.2M influencers and 103.7M users, with 2022 as the underlying reference year. The 2026 figures come from the current 50-state data analysis.

Study edition

Reference year

Reported users

Reported profiles

Profiles / users

2020

2020

89,892,000

8,279,357

9.21%

2023

2022

103.7M

10.2M

9.84%

2026

2026

192,606,008

8,943,596

4.64%

Sources: [1–3]. 2020 values from the 2020 edition; 2023 values rounded as published. Ratios are recalculated on a consistent profiles / users denominator.

Key findings

  • More profiles than 2020, fewer than 2023. The 2026 count is 8.0% above the 2020 edition but 12.3% below the 2023 edition: there is no uninterrupted growth line.
  • The estimated audience has more than doubled since 2020 (+114.3%), so creator density has roughly halved, from 9.21% to 4.64%.
  • The creator pool is spreading out. California's share fell 5.78 points, and the top ten states now hold 69.1% of profiles, down from 72.3%.
  • Florida is the biggest winner, rising from fourth to third, with 35.3% more profiles and +1.72 points of share.
  • Against other regions, the US has the highest reach but a mid-table creator density. Without each region's largest market, the US becomes the most creator-dense of the three.

Reported Counts Don’t Show Uninterrupted Instagram Influencer Growth

The 2026 profile count is 8.0% above the 2020 edition's 8,279,357 but 12.3% below the 10.2M in the 2023 edition. Estimated users are 114.3% above the 2020 figure and 85.7% above the 2023 edition's. Because the audience estimate grew far faster than the profile count, the ratio of profiles to users fell from 9.21% to 4.64%. These are changes in reported counts, not independently established market growth or decline. [1–3]

Differences in database coverage, account eligibility, geographic assignment, estimated-user sources or collection timing could contribute to the gaps. The aggregate figures do not isolate those effects. In particular, a lower profile-to-user ratio does not show that creators left Instagram, it is at least as likely to reflect a larger audience estimate.

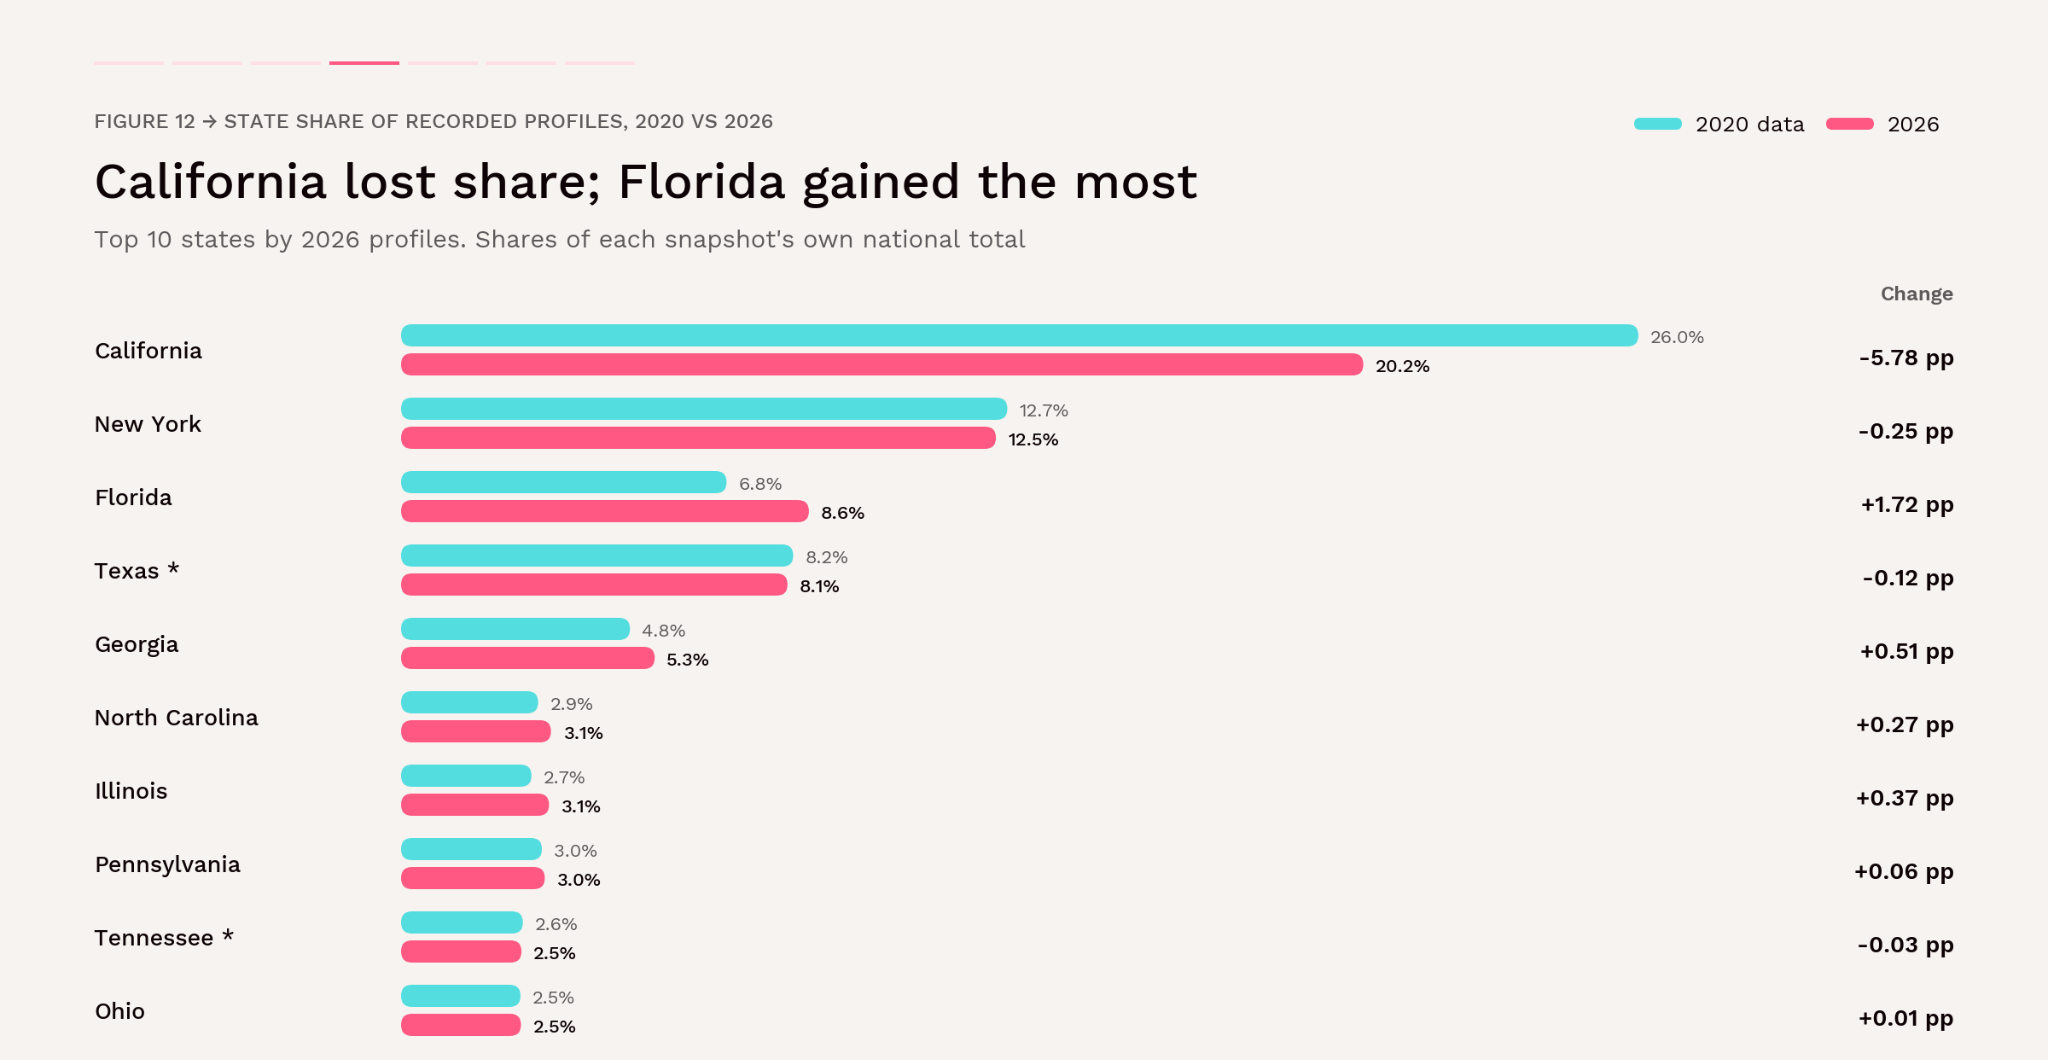
Which States Gained or Lost Share of the Recorded Pool?

California's share of recorded profiles fell from 26.0% to 20.2% (−5.78 percentage points), and it is the only state with fewer recorded profiles in 2026 than in the 2020 data. Florida gained the most share, +1.72 points, rising from fourth to third place. Share comparisons are less exposed to changes in total coverage than raw counts, but they still inherit method differences. [1, 2]

State

2020 profiles

2026 profiles

Change

2020 share

2026 share

Change (pp)

California

2,152,318

1,808,298

-16.0%

26.0%

20.2%

−5.78

New York

1,055,169

1,117,842

+5.9%

12.7%

12.5%

−0.25

Florida

566,566

766,282

+35.3%

6.8%

8.6%

+1.72

Texas

682,290

726,574

+6.5%

8.2%

8.1%

−0.12

Georgia

398,604

476,441

+19.5%

4.8%

5.3%

+0.51

North Carolina

238,825

282,087

+18.1%

2.9%

3.2%

+0.27

Illinois

226,923

277,980

+22.5%

2.7%

3.1%

+0.37

Pennsylvania

244,836

269,909

+10.2%

3.0%

3.0%

+0.06

Tennessee

212,114

226,231

+6.7%

2.6%

2.5%

−0.03

Ohio

207,755

225,230

+8.4%

2.5%

2.5%

+0.01

Source: Top 10 states by 2026 profiles. Instagram Influencer Marketing study 2020, rows 3–52. [1]

Figure 30 → State share of recorded profiles, 2020 data versus 2026. The chart shows reported shares, not creator migration.[1, 2].

Highlights

  • The market is less concentrated. California and New York together held 38.7% of 2020 profiles and 32.7% in 2026. Every other top-ten state held or gained share, except New York, Texas and Tennessee.
  • The middle of the ranking reshuffled. North Carolina rose from seventh to sixth and Illinois from eighth to seventh, while Pennsylvania slipped from sixth to eighth.
  • The fastest growth came from smaller states. New Jersey (+50.7%), Montana (+50.3%), New Hampshire (+43.8%), Nevada (+41.8%) and Rhode Island (+40.2%) recorded the largest percentage increases, from smaller bases.
  • Texas and Tennessee likely gained share. Both appear to lose share slightly. Texas grew about 20.8% and gained 0.77 points, and Tennessee grew about 22.5% and gained 0.27 points. The 2020 data's Texas and Tennessee unclassified totals equal their male totals, overstating 2020 by about 108,499 profiles.

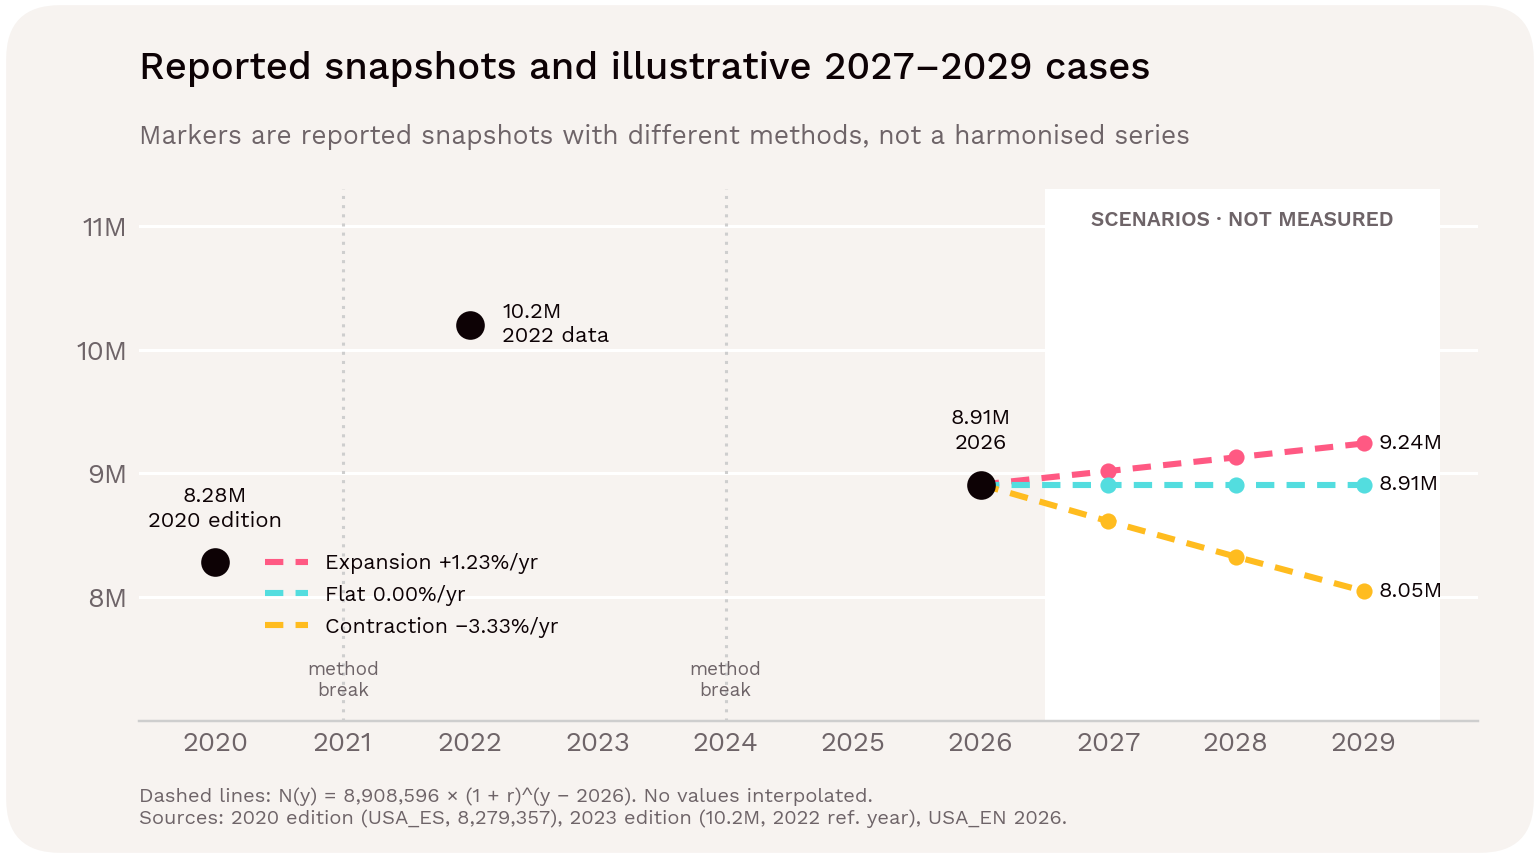
2027–2029: Exponential Scenarios, Not a Market Prediction

For planning sensitivity only, the table below applies N(y) = 8,943,596 × (1 + r)^(y − 2026). The contraction rate of −3.23% is the mechanical annualised change from 10.2M in 2022 to the current 2026 count; the expansion rate of +1.30% is the equivalent 2020–2026 calculation using the 2020 edition's 8,279,357. The flat case assumes no change. For reference, a log-linear fit across all three snapshots gives +0.64% a year; with three points and two method breaks it has no predictive weight.
Illustrative case

Annual rate

2027

2028

2029

Contraction case

−3.23%

8.65M

8.38M

8.10M

Flat case

0.00%

8.94M

8.94M

8.94M

Expansion case

+1.30%

9.06M

9.18M

9.30M

Figure 31 → Reported snapshots (markers) are not a harmonised time series; dashed lines are scenarios, not measured or interpolated values. Sources: [1–3].

These cases are deliberately not averaged into a central estimate and carry no probabilities or confidence intervals. The inputs are snapshots with changing definitions, not a harmonised time series; the 2020 value may also be overstated by about 108,499 profiles. The model does not establish exponential market growth. 

Creator counts must not be converted into industry revenue, spending or employment estimates without independent supporting data.
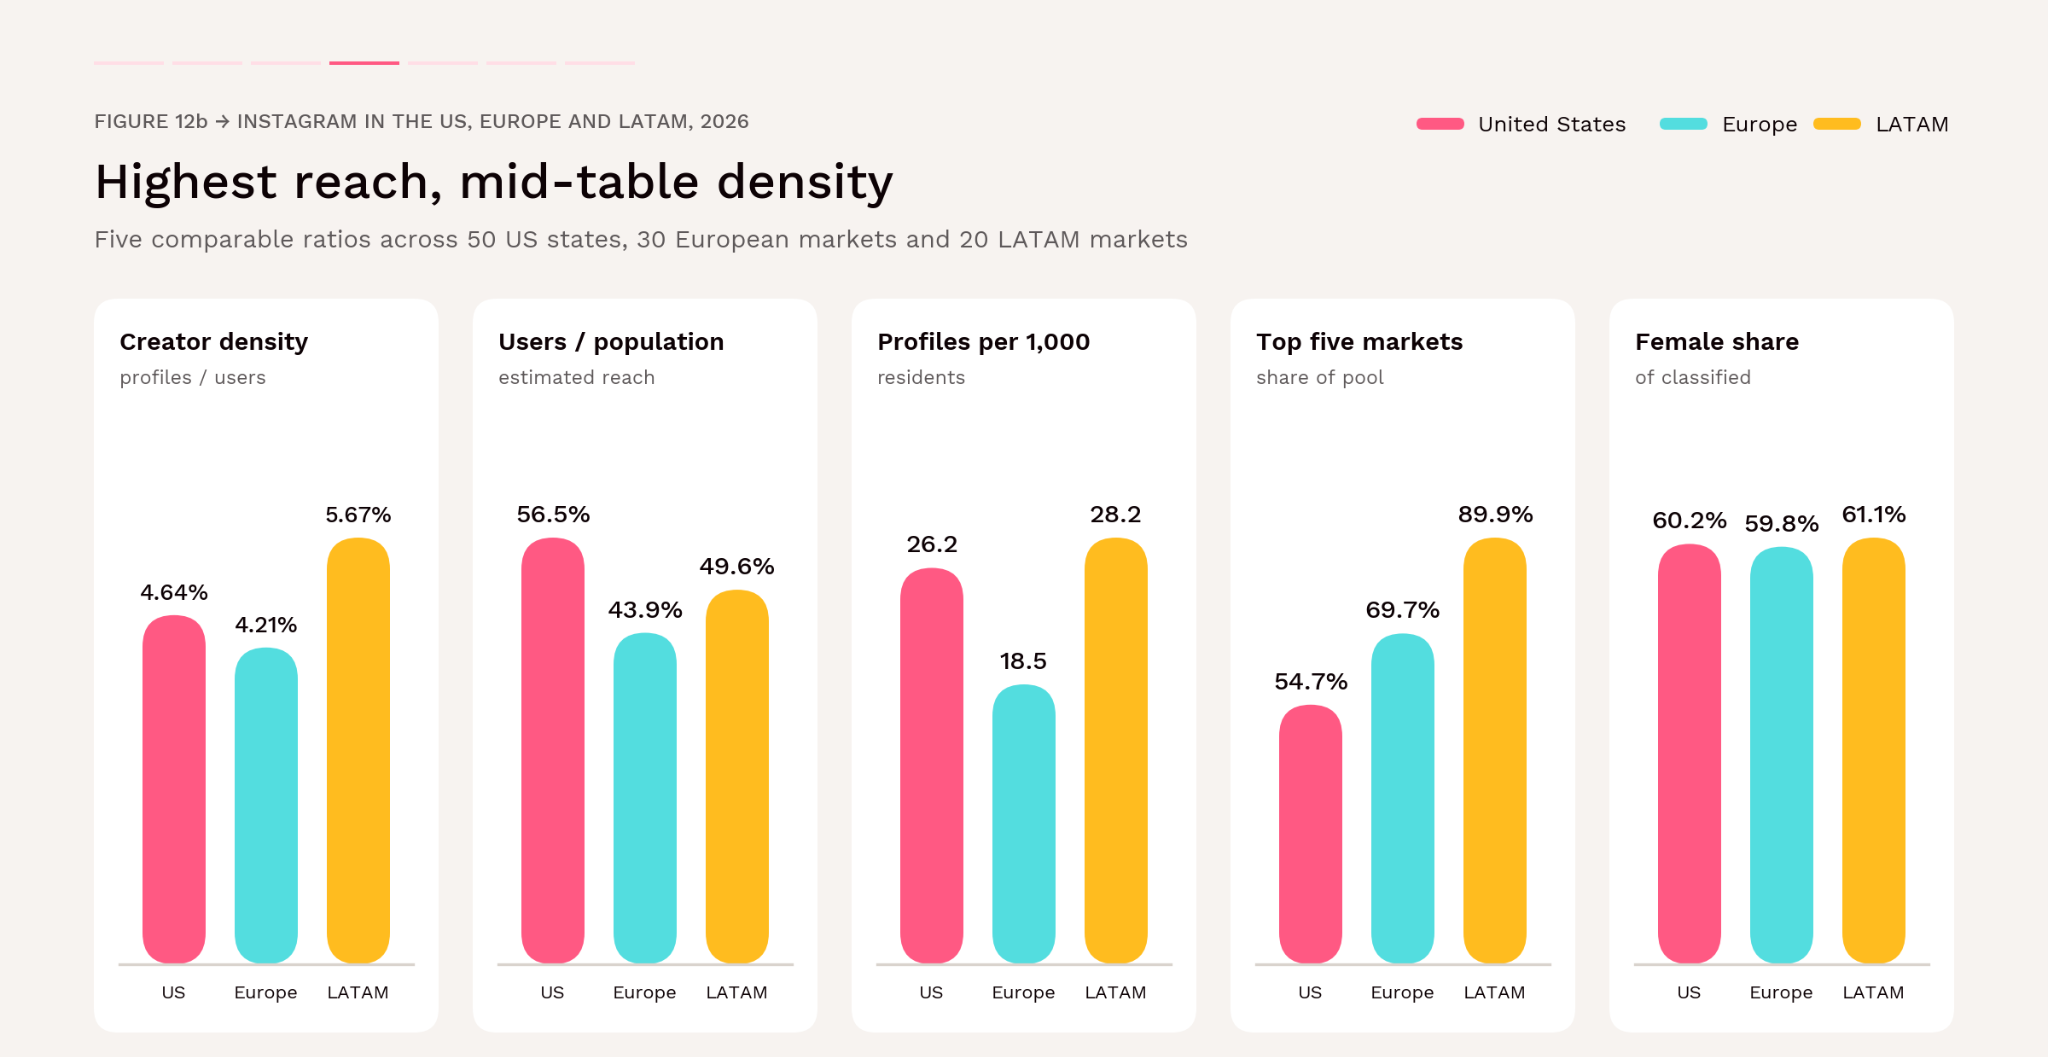
13 → US INSTAGRAM INFLUENCER MARKETS COMPARISONS

How Does the US Instagram Influencer Marketing compare with Europe and Latin America?

The US has the highest estimated Instagram reach relative to population of the three regions in Influencity's 2026 data, but the smallest recorded creator pool. Its 8.94M influencer-eligible profiles compare with 12.40M across 30 European markets and 18.35M across 20 LATAM markets.

On creator density, the US (4.64%) sits between Europe (4.21%) and LATAM (5.67%). That ranking changes once each region's largest market is removed: the US moves to first and LATAM to last. [1, 9, 10]

All three Influencity’s Instagram Influencer Marketing Studies share the same field structure and metric definitions, so the comparison is closer than most cross-region benchmarks.


Metric

United States (50 states) [1]

Europe (30 markets) [9]

LATAM (20 markets) [10]

Population reference

341.1M

670.2M

651.7M

Estimated Instagram users

192.6M

294.5M

323.5M

Influencer-eligible profiles

8.94M

12.40M

18.35M

Creator density

4.64%

4.21%

5.67%

Estimated users / population

56.5%

43.9%

49.6%

Profiles per 1,000 residents

26.2

18.5

28.2

Largest market (share of pool)

California (20.2%)

Russia (23.2%)

Brazil (66.1%)

Top five markets' share of pool

54.7%

69.7%

89.9%

Density excluding largest market

4.21%

4.13%

3.42%

Highest / lowest market density

9.80% / 1.58%

5.57% / 2.69%

8.57% / 0.58%

Markets above own benchmark

9 of 50

9 of 30

3 of 20

Median market density

3.09%

3.59%

3.11%

Female share, classified

60.2%

59.8%

61.1%

Unclassified share, all profiles

21.5%

31.6%

25.1%

Nano share

About 89% of profiles

87.4% of tier entries

88.3% of tier entries

Change vs 2023 edition

−12.3%

+17.8%

−2.9%

Sources: [1] Densities and ratios are recomputed from unrounded country and state rows. US Nano share is of eligible profiles; Europe and LATAM shares are of tier entries. On a tier-entry basis the US figure is 89.5%

Figure 33 →Five comparable ratios for the three regions. Each panel uses its own scale. Sources: [1, 9, 10]

The Highest Reach, a Mid-Table Influencer Density

The US has the highest ratio of estimated Instagram users to population: 56.5%, against 49.6% in LATAM and 43.9% in Europe. Relative to residents, its creator supply (26.2 profiles per 1,000) is close to LATAM's (28.2) and well above Europe's (18.5). Relative to the platform audience, US creator density is 4.64%: above Europe but below LATAM, whose lead comes almost entirely from Brazil (8.57%). [1, 9, 10]

Remove Each Region's Largest Market & the Ranking Changes

Excluding California, the remaining 49 states have a density of 4.21%. Europe falls to 4.13% without Russia, and LATAM drops to 3.42% without Brazil. On this basis, the US is the most creator-dense region of the three. The change is small for the US because California is a fifth of its profiles. Brazil, by contrast, is two-thirds of LATAM's pool. [1, 9, 10]
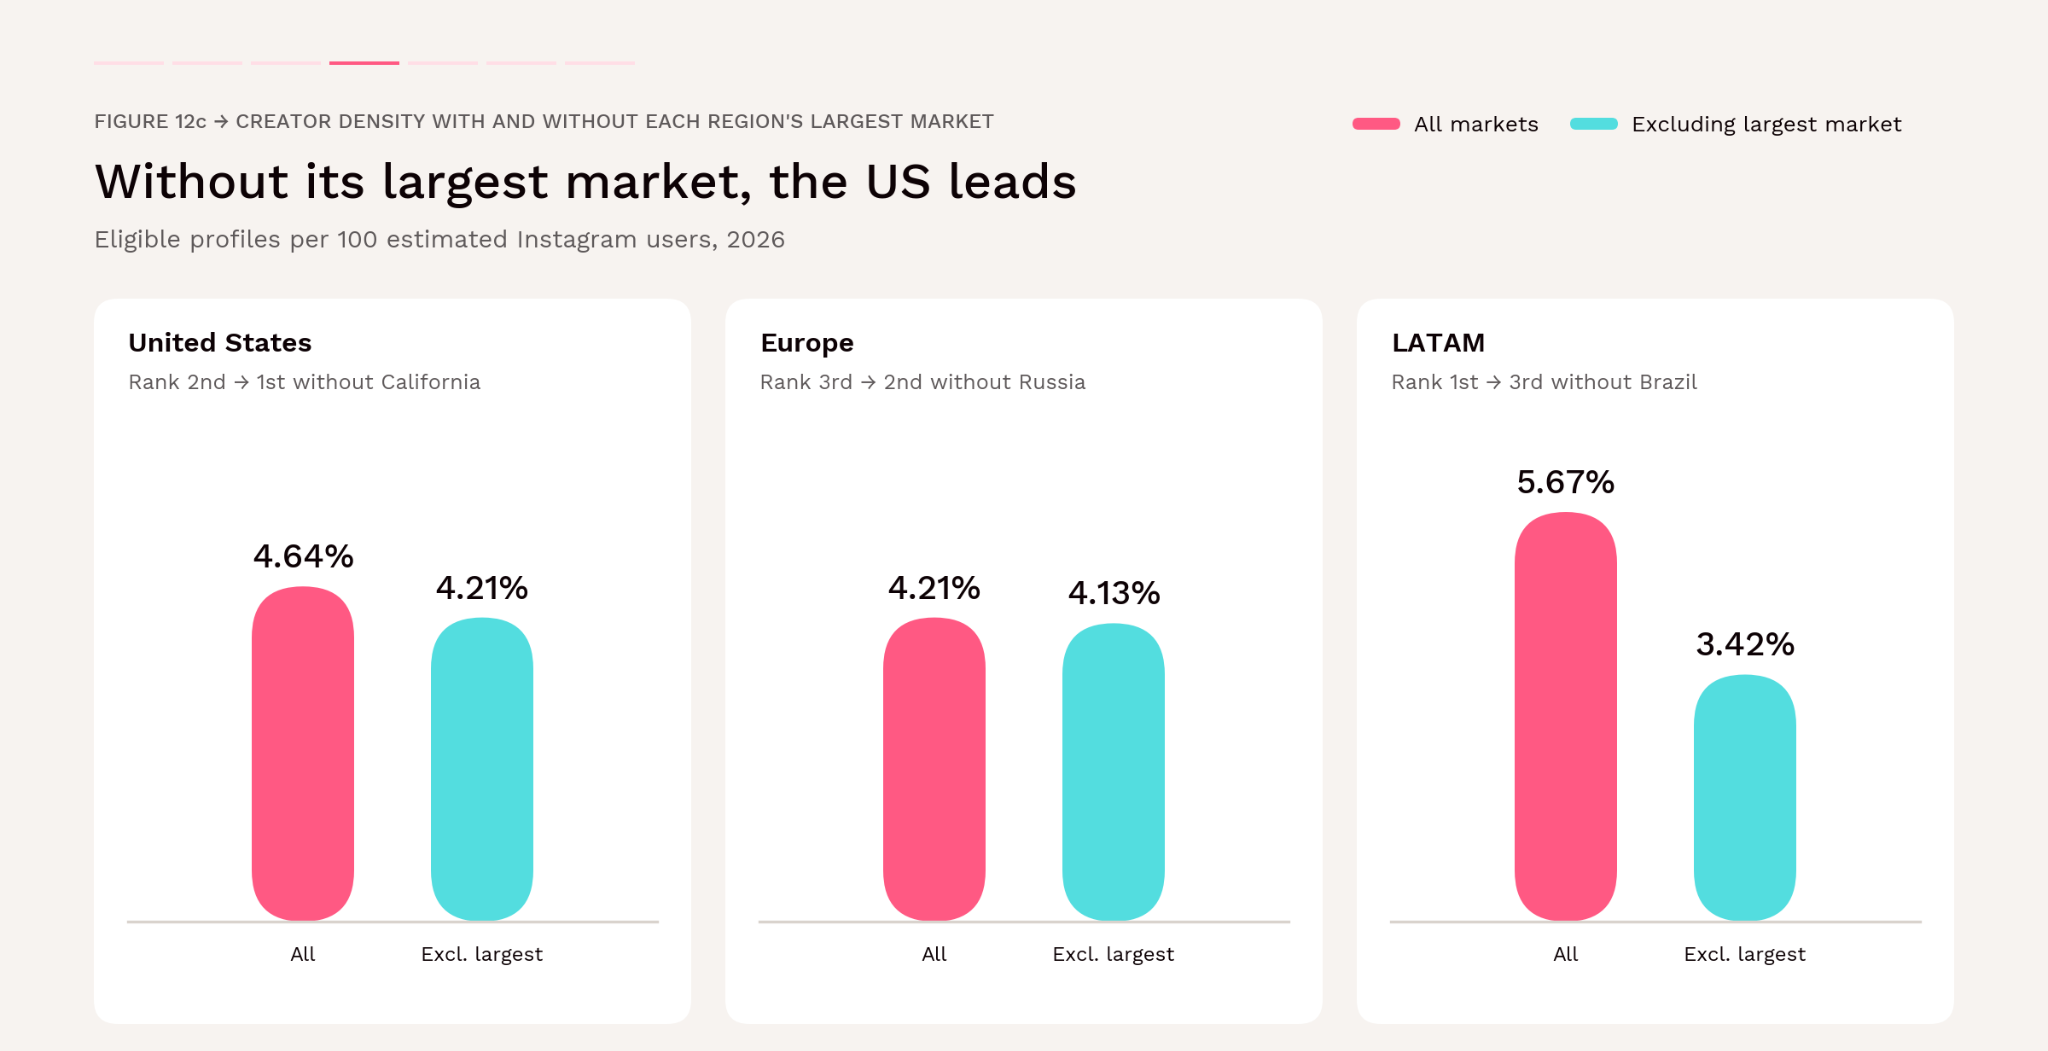
Figure 33 → Instagram creator density with and without each region's largest market. Sources: [1, 9, 10].

The US Sits Between Europe's Uniformity & LATAM's Extremes

US state densities range 6.2-fold, from 1.58% in South Dakota to 9.80% in New York. European markets range only 2.1-fold, from 2.69% in Luxembourg to 5.57% in Cyprus. LATAM markets range 14.8-fold, from 0.58% in Cuba to 8.57% in Brazil.

Nine of the 50 states exceed the US benchmark, the same count as Europe's 30 markets. Only three of LATAM's 20 markets exceed theirs. In all three regions the weighted benchmark sits above the median market, because the largest markets are also among the densest. The gap is widest in LATAM (5.67% against a 3.11% median), where a typical market looks very different from the regional average. [1, 9, 10]
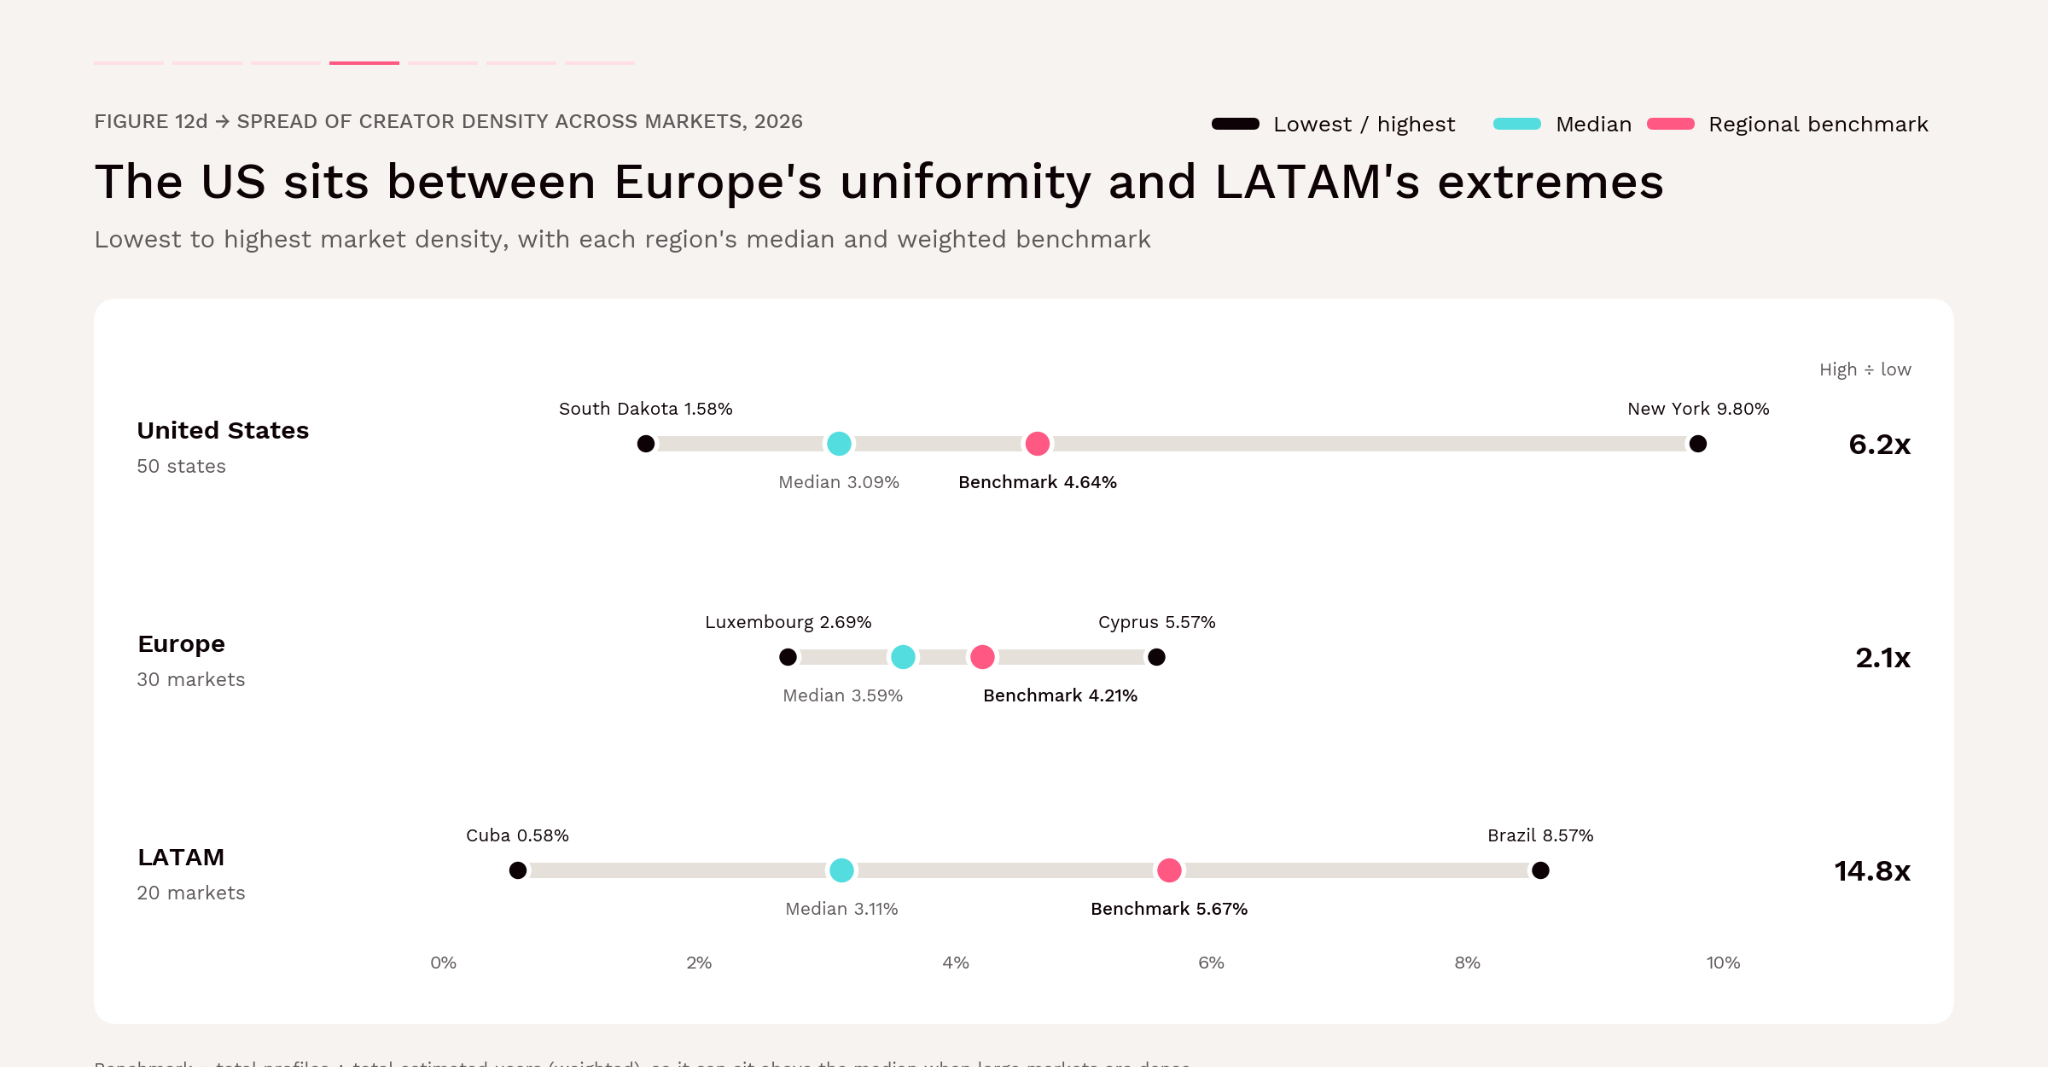
Figure 34 → Spread of creator density across US states, European markets and LATAM markets, with each region's median and benchmark. Sources: [1, 9, 10].

Similar Gender Split and Tier Shape, Different Classification Coverage

The female share of classified profiles is within 1.3 percentage points across the three regions: 60.2% in the US, 59.8% in Europe and 61.1% in LATAM. Nano profiles make up roughly 87–89% of each region's pool, though the US figure uses a different denominator (see table note).

The US has the lowest unclassified share (21.5%, against 25.1% in LATAM and 31.6% in Europe), so its classified figures describe more of its pool. At the top tier the regions diverge: the US mega tier is at parity (49.9% male among classified records), while Europe and LATAM both have male majorities of about 55%. [1, 9, 10]

Reported Counts Moved in Different Directions

Against each region's previous edition, the recorded US count is 12.3% lower, Europe's is 17.8% higher and LATAM's is 2.9% lower. Since 2020, the US is up 8.0%, Europe about 44.2% and LATAM about 52.9%, all against rounded or provisional baselines. [1–3, 9, 10]

Conclusions

  1. Don't understand the variations as a trend line. The three editions show a larger audience estimate and a broadly stable profile count, not a shrinking creator market.
  2. US creator supply is spreading beyond the coasts. California's falling share, Florida's rise and fast growth in smaller states point to a wider recruitment map than in 2020.
  3. The US is the most balanced of the three regions. Its national benchmark is a fair guide to most states. LATAM's isn't, because Brazil dominates it, and Europe's markets are the most uniform.
  4. Per resident, the US and LATAM have similar creator supply; Europe is thinner. Size discovery by the absolute pool in the target market, not by regional averages.

What this means for multi-region programmes

Use each region's own benchmark, and look past the national figure where one market dominates. When reporting gender or tier mix across regions, state each region's denominator and unclassified share: Europe's larger unclassified group changes what a classified share represents. Plan budgets on market-level pools, since the same regional density can hide a 2-fold or a 15-fold spread between markets.

14 → EVIDENCE FROM OUR CATEGORY STUDIES

What Do Influencity's Studies Add About Influencer Marketing Performance, Trust & Disclosure?

The 2026 Instagram Influencer Marketing Study counts profiles. It has no engagement, sentiment, disclosure or conversion fields, so on its own it cannot say which creators perform. Two recent Influencity studies measured those things in specific categories. Their findings are useful context for the creator pool described above, but they use different samples, platforms and periods. Their figures describe those samples, not the 8.94M US Instagram profiles. [7, 8]


Supplements study [7]

Food study [8]

Title

The Influence Effect: How Social Media Creators Shape Consumer Perception and Purchasing Behavior in the Supplements Industry

From Feed to Fork: How Foodie Influencers Shape Restaurant Choices in the U.S.

Published

October 2025

November 2025

Sample

5,000+ sponsored creator posts and mentions; creators aged 18–50; engagement-to-follower ratio of at least 2%; 500+ comments per post

10,568 social mentions, a 20-creator dataset and nine brand case studies

Platforms

TikTok, Instagram, YouTube

TikTok, Instagram, YouTube

Geography

United States and Mexico

United States: California, New York, Texas, Florida, Illinois

Period

January–June 2025

Collection window not stated

Method

Influencity Monitoring Tool, NLP sentiment, manual compliance coding (Cohen's kappa above 0.80 on a 15% sample)

Influencity Social Listening, plus third-party benchmarks and press case studies

Sources: [7], [8]. Publication months are taken from the documents' internal file dates.

Key findings

  • Smaller creators earned the highest engagement in supplements: about 2.4 times the celebrity rate in a high-engagement sample.
  • They also drove the most food conversation: micro-creators made up more than half of tagged posts.
  • Instagram led on every trust and compliance measure in supplements: sentiment, disclosure, disclosure placement, claim compliance and the trust index.
  • Disclosure paid off: clearly labelled sponsored posts performed 12% better on long-term engagement.
  • One in seven supplement posts carried a compliance risk, making potentially non-compliant health or disease claims.
  • Independent food-study ratings match this study's density ranking for all five states compared.

Smaller Influencers Lead in Both Categories, on Different Measures

In the supplements study sample, average engagement fell steadily with audience size: a reported 57% for micro-creators (under 100k followers), 38% for macro-creators (100k–1M) and 24% for celebrities (over 1M), so micro-creators earned about 2.4 times the celebrity rate. In the food study, micro-influencers accounted for more than half of tagged posts in the social-listening sample. [7, 8]
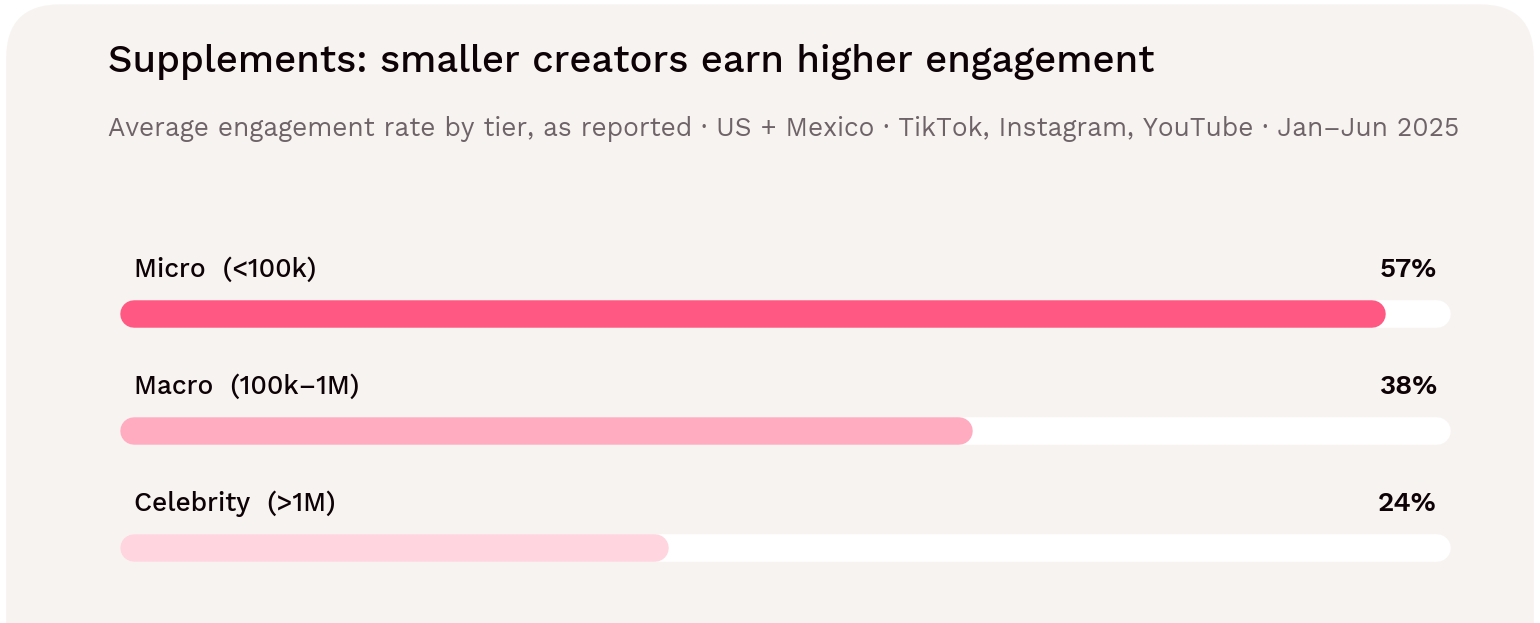
Figure 35 → Average engagement rate by creator tier in Influencity's supplements study. The tiers are not the same as this study's: there, "micro" covers everything under 100k followers. Source: [7].

The study does not define its engagement rate, and its sample only included posts with 500+ comments from creators with an engagement-to-follower ratio of at least 2%. Quote the direction (higher for smaller tiers) rather than the absolute values.

This complements section 08. That section shows that about 89% of eligible US Instagram profiles are nano-sized, and this study shows that profiles under 10,000 followers make up at least 81% of every state's pool, from 81.4% in California to 97.8% in West Virginia. The category studies suggest that this large base of smaller creators is also where engagement (supplements) and conversation volume (food) concentrate. [1, 7, 8]
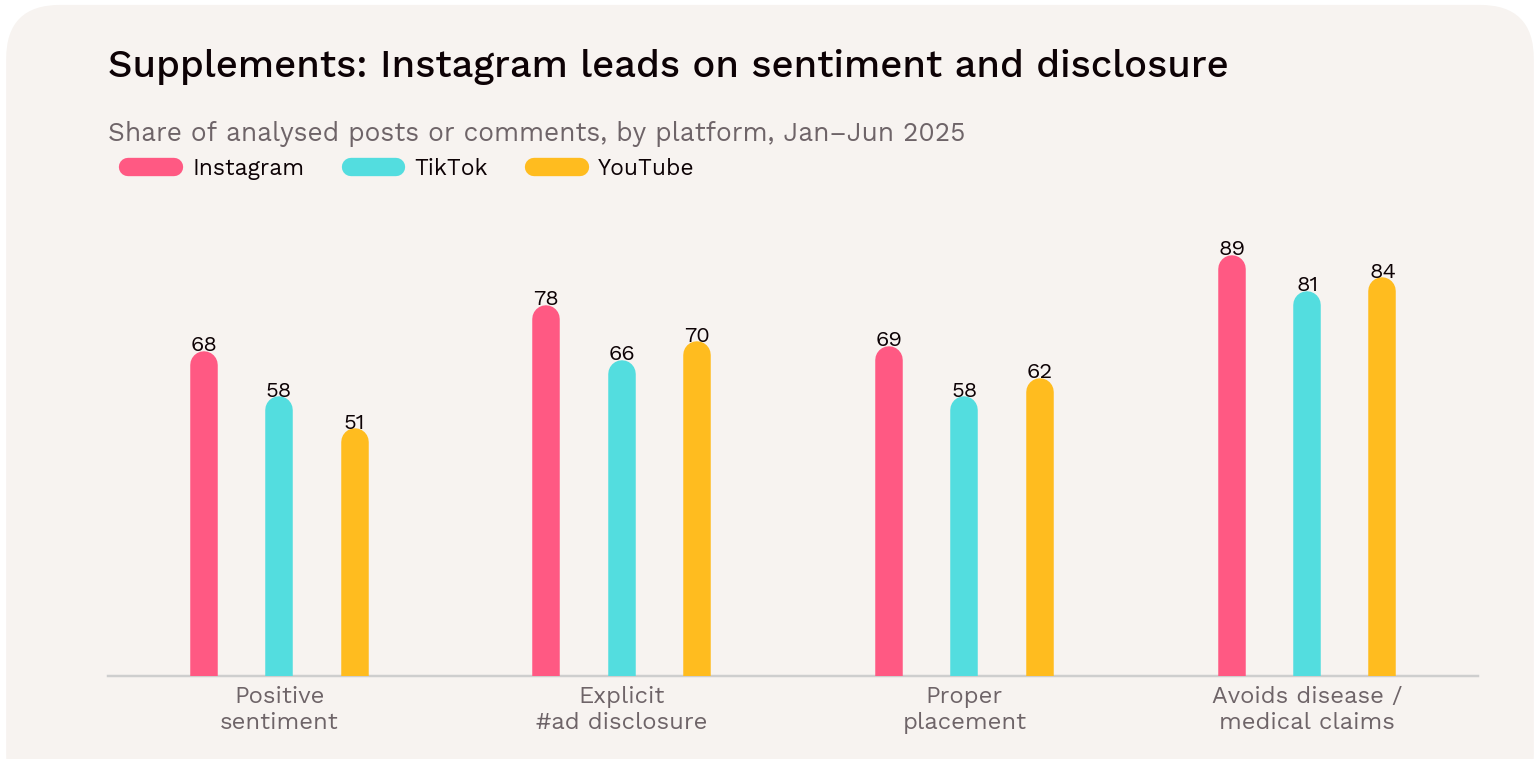
Instagram Influencer Marketing Leads on Positive Sentiment, Disclosure & Trust in the Supplements Study

Metric (supplements study)

Instagram

TikTok

YouTube

All platforms

Positive comment sentiment

68%

58%

51%

60–65%

Neutral / negative sentiment

22% / 10%

20% / 12%

30% / 19%

—

Posts with explicit #ad or #sponsored

78%

66%

70%

71%

Proper disclosure placement

69%

58%

62%

63%

Posts avoiding disease or medical claims

89%

81%

84%

85%

Audience trust index (0–100)

69

23

Not reported

—

Source: [7], Results and Insights tables. TikTok sentiment shares sum to 90% as published. The trust index also lists X (Twitter) at 8, although X is outside the study's stated platforms.

Figure 36 → Sentiment, disclosure and claim compliance by platform in the supplements sample. Source: [7].

Instagram led on every measure the study reported: 10 points ahead of TikTok on positive sentiment, 12 points on explicit disclosure, 11 points on disclosure placement and 8 points on avoiding medical claims. The trust index shows the widest gap: 69 for Instagram against 23 for TikTok, three times higher. YouTube sat between the two on disclosure and compliance but had the lowest positive sentiment (51%) and the highest negative share (19%), and it received no trust score. [7]

Disclosure Did Not Cost Engagement

Posts that clearly disclosed a sponsorship with #ad or #sponsored performed 12% better on long-term engagement (saves, shares and repeat comments) than undisclosed or ambiguous posts. Content built on routines and personal progress drove nearly three times the engagement of hard-sell posts. Meanwhile, 15% of analysed posts, about one in seven, made potentially non-compliant health or disease claims, mostly for weight-loss and gut-health products. These are observed associations in one category, not controlled tests. [7]

Food Discovery in Five of the Largest Influencer Markets

The food study's five states include all four of this study's top four states by eligible profiles, plus Illinois (seventh); Georgia, fifth by profiles, was not covered. The study's qualitative ratings of influencer penetration match the density pattern measured here. California and New York, rated very high, have the two highest creator densities. Florida, rated high, is above the benchmark. Texas and Illinois, rated medium, sit below it. The two approaches are independent, so the agreement is reassuring, but it compares ratings with ratios and is not a statistical validation. [1, 8]
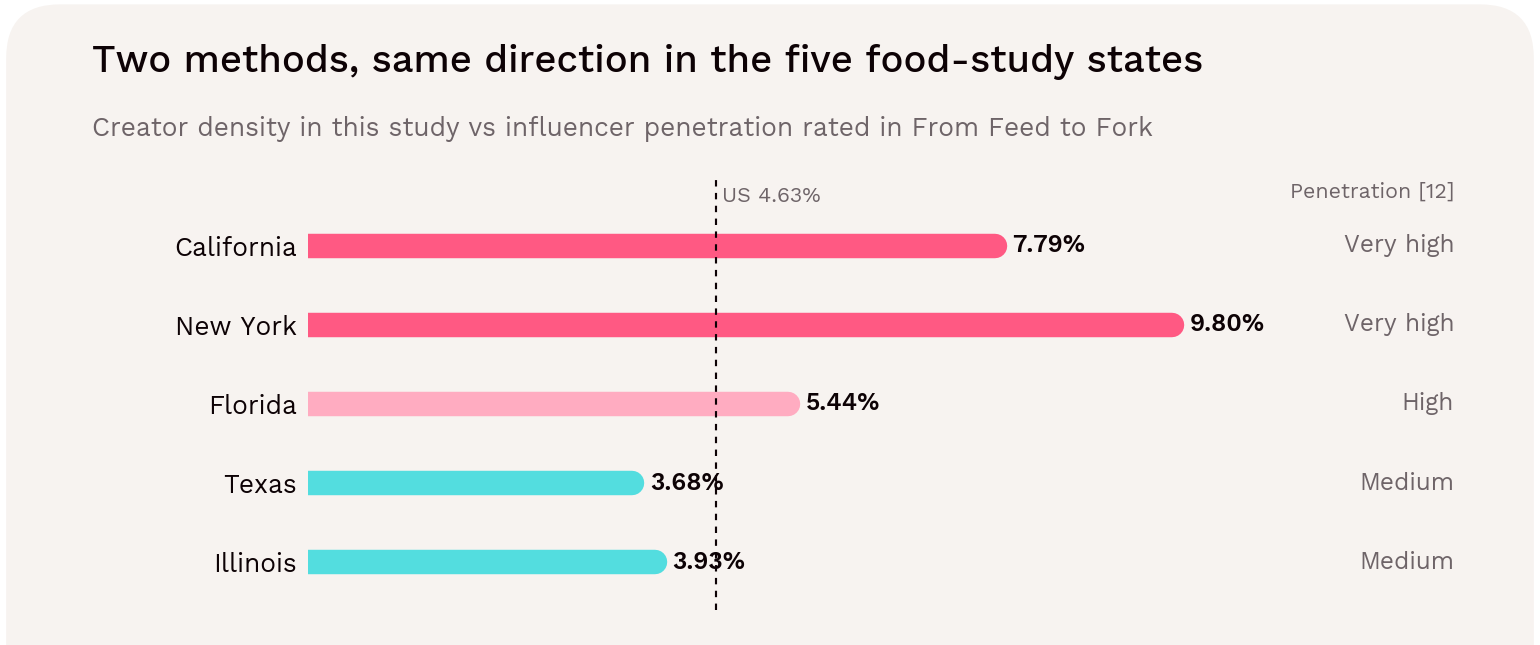
State

Profile rank [1]

Density [1]

Penetration [8]

Price sensitivity [8]

Best format [8]

Strongest type [8]

California

1

7.79%

Very high

Low

Aesthetic TikTok videos

Trendy independents

New York

2

9.80%

Very high

Low

Reviews + lists

Iconic independents

Florida

3

5.44%

High

Variable

Travel food content

Tourist hotspots

Texas

4

3.68%

Medium

Medium/high

Taste tests

BBQ & fast casual

Illinois

7

3.93%

Medium

Medium

Deep-dish + classics

Local icons

Sources: rank and density, ratings, From Feed to Fork, State Comparison Summary [8].

Figure 37 → Creator density in this study set against the food study's influencer-penetration ratings. Sources: [1, 8].

The food study's social-listening data also show who is talking: people aged 25–34 wrote 39.11% of the mentions, the largest age group. Its strategic recommendation, to combine national creators for awareness with city-level micro-creators for foot traffic, fits the concentration pattern in section 03: large creators cluster in California and New York, while smaller creators make up the large majority of every state's pool. [1, 8]

Third-Party Figures Quoted in the Two Studies

Both studies also quote outside research. These figures are attributed below:

Figure as quoted

Source named in the study

72% of US consumers have discovered a restaurant through social media

TikTok Food Trends Report, 2025 [8]

62% of Gen Z and 52% of Millennials added a restaurant to a "must-try" list after an influencer review

National Restaurant Association, 2025 [8]

61% of Californians visited a restaurant after seeing it on social media

Google Consumer Survey, 2024 [8]

58% of New Yorkers discover restaurants via TikTok/Instagram before Google or Yelp

Statista, 2024 [8]

42% of Texans say TikTok helped choose their last dine-out meal

"TX Food Insights Lab", 2024 [8]

68% of Florida respondents try restaurants on vacation based on TikTok reviews

No source given [8]

46% of Gen Z online shoppers bought health/beauty products digitally in the prior month

PYMNTS, 2025 [7]

Global dietary supplements market $178B (2023), ~$239.5B by 2030

Verified Market Research, cited in text; reference list names Nova One Advisor [7]

What this means for the industry

  • Build rosters from the base of the pyramid. The creators who make up at least 81% of every state's pool are also where engagement and conversation concentrated in both categories. Programmes built only on large accounts may leave most of the available relevance untapped. 

  • Compliance needs active management in regulated categories. One in seven supplement posts made claims that could breach advertising rules. Briefs, pre-approval workflows and post-publication monitoring are essential for health, wellness, finance and similar categories.

  • Choose platforms by objective. Instagram's lead on trust and disclosure suits credibility-sensitive briefs; TikTok's denser creator pool (section 11) suits discovery and creative testing.

  • Authentic formats beat hard sells. Routine and progress content drove nearly three times the engagement of hard-sell posts in supplements, and local, format-specific content (taste tests, reviews, travel food) led in the food study.

Conclusions

Neither category study measures the 8.94M profiles in this study, but together they answer the question which creators perform. The answer, in two categories, is consistent. Smaller creators drive engagement and conversation, transparent disclosure supports performance, and Instagram carries the most trust where credibility matters. Treat these as tested hypotheses for their own category, then confirm them with their own campaign data.

15 → CAMPAIGN PLANNING

How Should Brands & Agencies Use these Influencer Marketing Findings in 2026?

The practical use of this study is to improve the order of campaign decisions: map the available supply, establish audience fit, vet and activate creators individually, then measure outcomes. State-level counts are a starting point for discovery, not a substitute for campaign evidence. The twelve recommendations below follow that sequence and draw on the findings in sections 02–13.
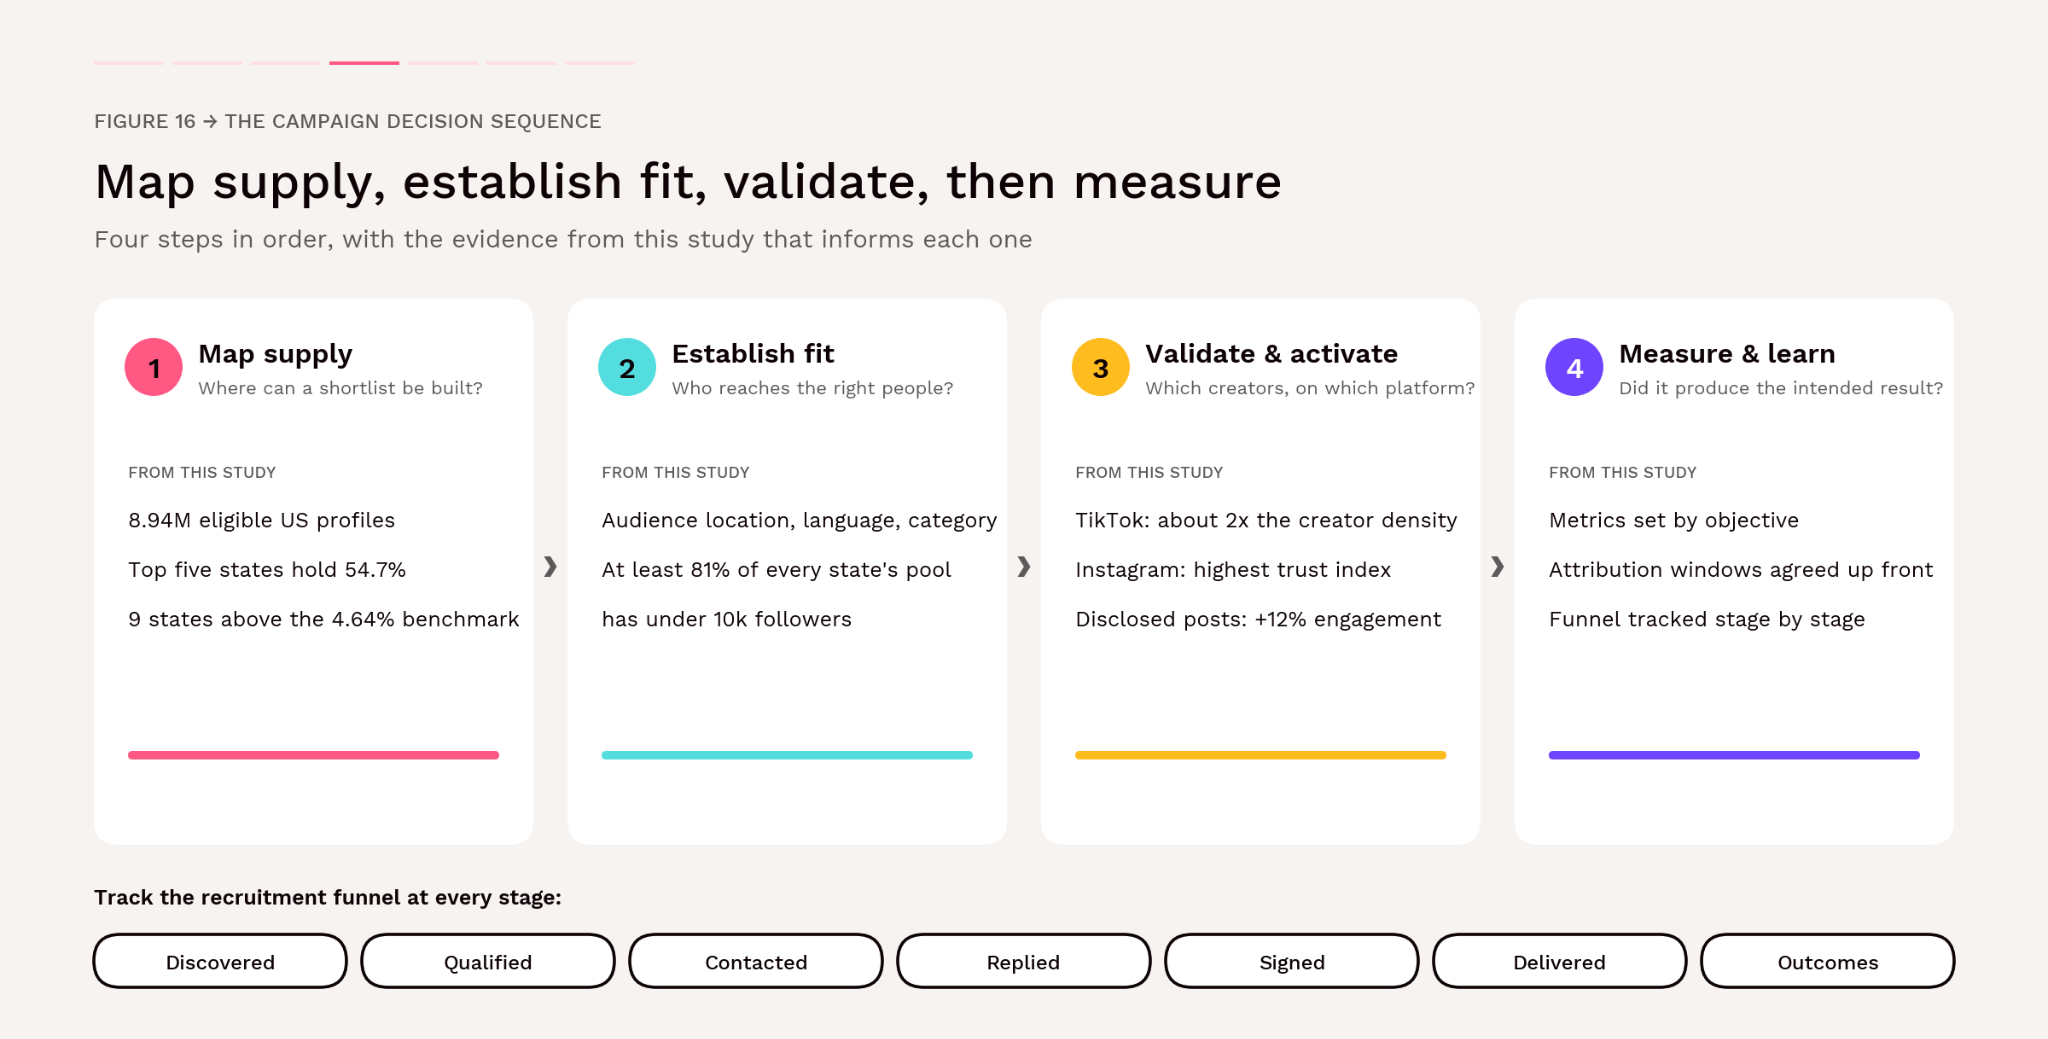
Figure 38 → The campaign decision sequence, with the evidence from this study that informs each step. Sources: [1, 4, 7].

At a glance: what the evidence supports

  • Discovery is broad, but concentrated. 8.94M eligible profiles, with 54.7% in five states. [1]
  • Supply relative to the audience varies widely. State density ranges from 1.58% to 9.80%, and only nine states exceed the 4.64% benchmark. [1]
  • Smaller creators dominate every state. Profiles under 10,000 followers are at least 81% of every state's pool. [1]
  • Smaller influencers performed in both category studies: highest engagement in supplements, most conversation in food. [7, 8]
  • Platforms play different roles. TikTok has about twice Instagram's creator density, while Instagram led on trust and disclosure in supplements. [4, 7]
  • Transparency pays. Disclosed sponsored posts performed 12% better on long-term engagement. [7]

Step 1: Map supply

1. Build a Discovery Universe, then a Qualified Shortlist

Start with high-supply states when the brief needs a broad choice of creators. California, New York, Florida, Texas and Georgia hold 4.90M eligible profiles, 54.7% of the US total (section 02). Then narrow by category, audience geography, relevant language, content quality, recent activity and brand suitability. Track how many candidates survive each filter rather than treating all eligible profiles as usable supply. [1]

2. Combine Pool Size and Density When Choosing States

Pool size tells you how many candidates exist; density tells you how much creator supply there is relative to the platform audience. Used together, they split the map into clear roles (Figure 38):
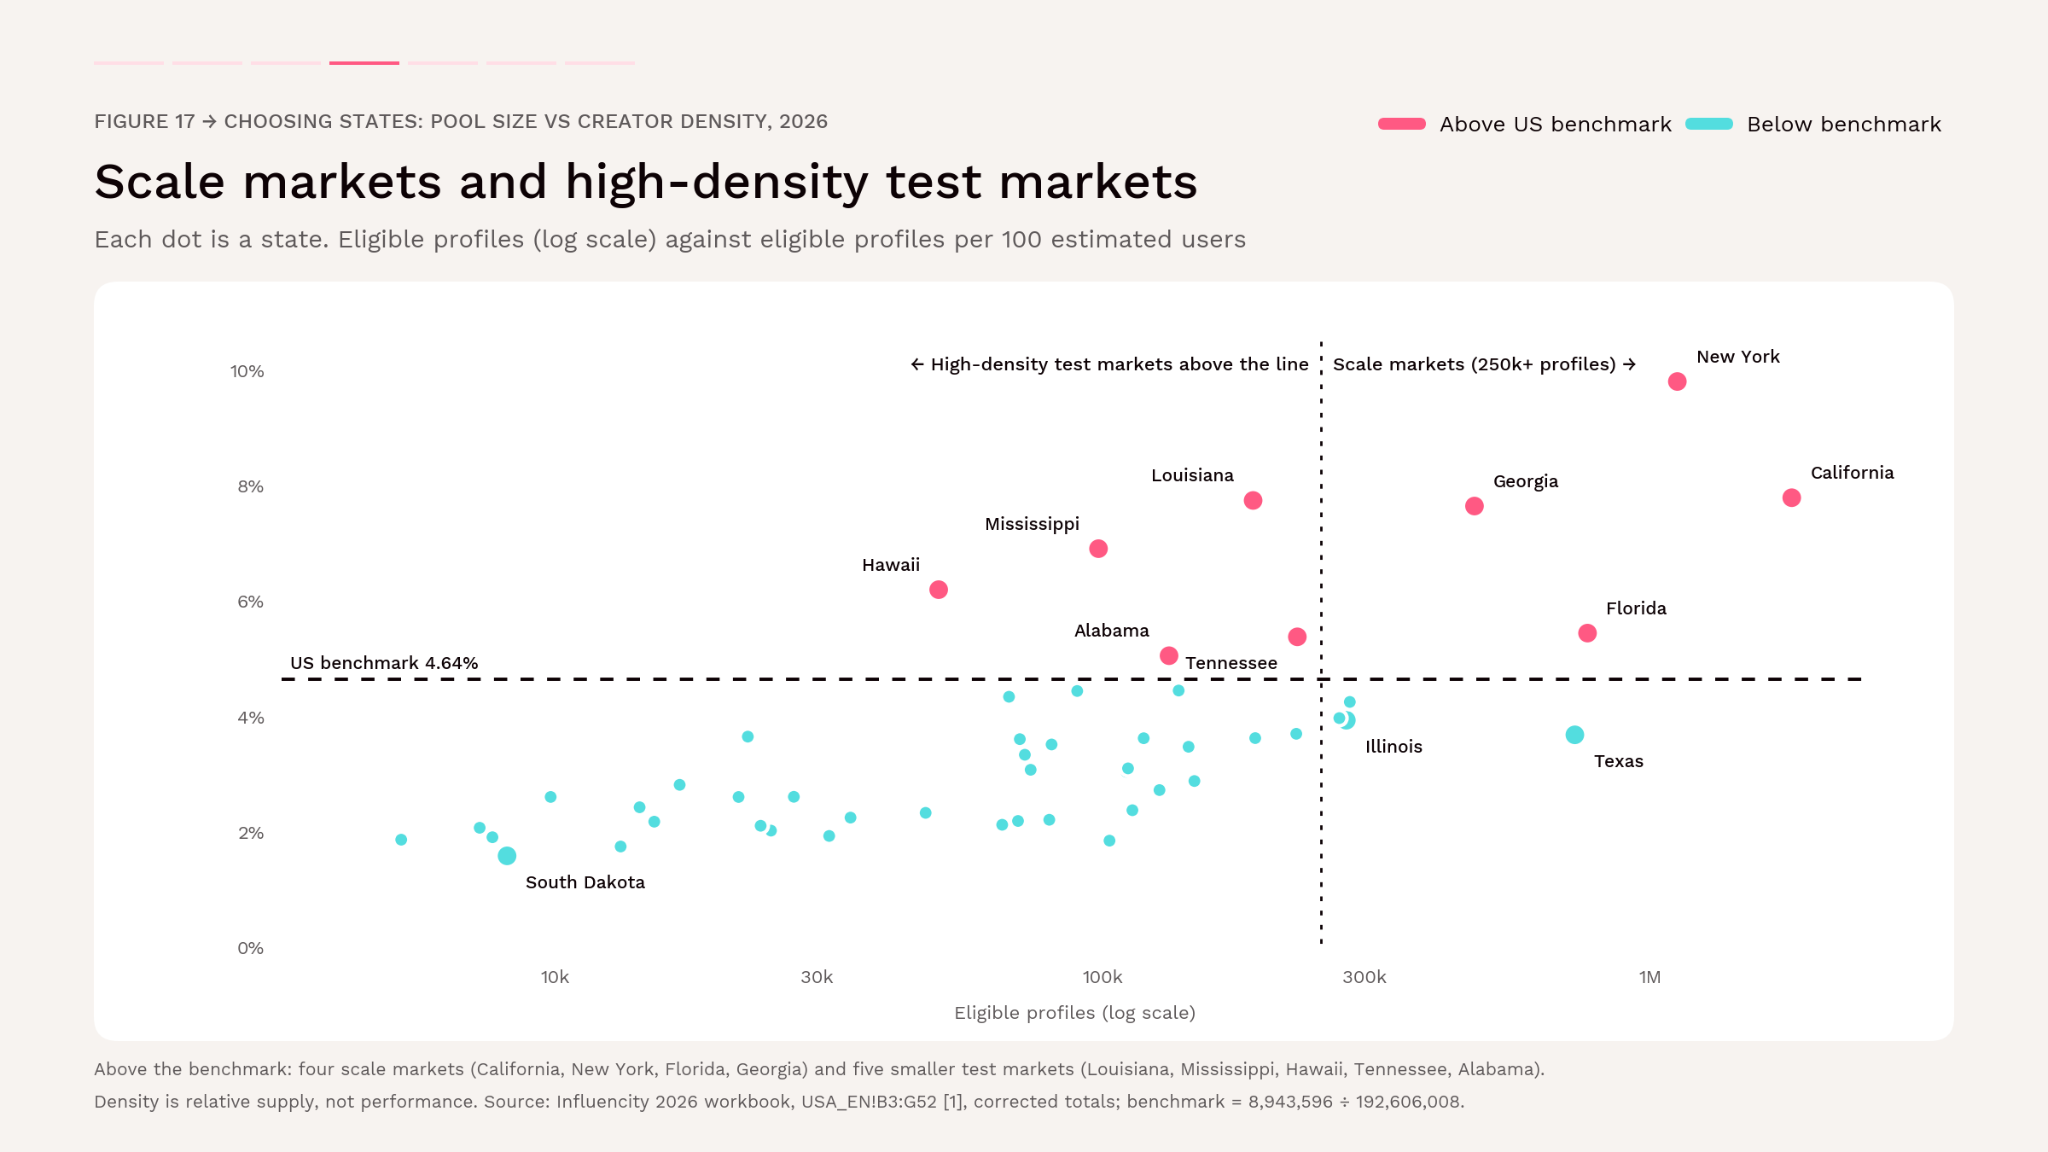
  • Scale markets with high density: California, New York, Florida and Georgia. Large pools and above-benchmark density make them the default starting point for broad discovery.
  • Scale markets with lower density: Texas, Illinois, North Carolina and Pennsylvania. Large pools, but each creator is set against a bigger estimated audience. Texas has about 27 estimated users per eligible profile, against about 13 in Louisiana. [1]
  • High-density test markets: Louisiana, Mississippi, Hawaii, Tennessee and Alabama. Smaller pools with above-benchmark density.

Figure 39 → Pool size against creator density for all 50 states. Density is relative supply, not performance. Source: [1]

3. Test Smaller High-Density Markets Deliberately

Louisiana (187,854 profiles; 7.74% density), Mississippi (98,071; 6.91%) and Hawaii (50,087; 6.20%) have above-average relative supply but much smaller absolute pools than California or New York (section 05). Use them as test markets when the brand has a relevant product, retail footprint or audience hypothesis. Validate followers' actual locations before calling a partnership local: creator location does not establish where followers live. [1]

4. Look Beyond the Traditional Influencer Hubs

The recorded pool is less concentrated than in 2020. California's share fell from 26.0% to 20.2%, and the top ten states' share fell from 72.3% to 69.1%. Florida's count rose 35.3%, and several smaller states, including New Jersey, Montana and New Hampshire, grew by more than 40% (section 12). Methods differ between snapshots, but the direction supports widening recruitment beyond California and New York rather than relying on them by default. [1, 2]

Step 2: Establish Fit

5. Match Influencer Tiers to the Job, Not a Universal Ranking

About 89% of eligible profiles have fewer than 10,000 followers, and they make up at least 81% of every state's pool. Larger profiles cluster heavily: California and New York hold 79.2% of mega and 67.6% of macro profiles (section 08). A practical portfolio combines smaller profiles for niche relevance, local reach and creative testing with a few larger profiles for broad distribution. Influencity's category studies support testing this. In supplements, micro-creators earned about 2.4 times the celebrity engagement rate, in a sample filtered for high engagement. In food, micro-creators produced more than half of tagged posts (section 14). Never convert follower counts into guaranteed reach. [1, 7, 8]

6. Report Gender and Tier Mix with their Denominators

Female-classified profiles are 60.2% of classified profiles, but 21.5% of all profiles have no gender classification (section 07). When a brief specifies creator gender, report the classified base and the unclassified share alongside it. When briefing internationally, remember that Europe's unclassified share is higher, at 31.6% (section 13). [1, 9]

7. Use Each Region's Own Benchmark in Multi-Region Programmes

The US national density is a fair guide to most states, but regional averages can mislead elsewhere. LATAM's benchmark is driven by Brazil, which holds two-thirds of its pool, and its market densities range 14.8-fold. Size discovery by the absolute pool in each target market, not by regional averages (section 13). [1, 9, 10]

Step 3: Validate and Activate

8. Choose Each Platform for Its Role

On the supplied benchmark, TikTok has about twice Instagram's creator density, a deeper pool for discovery and creative testing. In Influencity's supplements study, Instagram led on positive sentiment (68% vs 58%), explicit disclosure (78% vs 66%) and the trust index (69 vs 23). That makes it a strong candidate for briefs where credibility matters (sections 11 and 14). Build separate platform shortlists and deduplicate creators who appear on both: adding the two platforms' totals overstates unique people. [4, 7]

9. Make Disclosure a Performance Standard

In the supplements study, posts with a clear #ad or a #sponsored label performed 12% better on long-term engagement than undisclosed or ambiguous posts. Write disclosure into every contract, specify placement (above the fold, not buried in hashtags) and check it before content goes live. US rules require clear disclosure of paid relationships in any case. [7]

10. Build Compliance into Briefs for Regulated Categories

About one in seven supplement posts (15%) made potentially non-compliant health or disease claims, mostly for weight-loss and gut-health products (section 14). In health, wellness, finance and other regulated categories, give creators approved claims and prohibited phrases, require pre-approval of scripts, and monitor posts after publication. [7]

11. Brief for Authentic, Local Formats, Not Scripts

Routine and personal-progress content drove nearly three times the engagement of hard-sell posts in the supplements sample. In the food study, the strongest format differed by state: aesthetic TikTok videos in California, reviews and lists in New York, taste tests in Texas, travel food content in Florida (section 14). Brief creators on the message and the guardrails, then let them choose the format their audience responds to. [7, 8]

Step 4: Measure and Learn

12. Measure the Result the Campaign Was Designed to Produce, and Track the Whole Funnel

For brand awareness, prioritize qualified reach, view quality and frequency. For consideration, examine relevant saves, shares, site visits and search activity. For sales, use tagged links, codes and appropriate conversion or incrementality analysis. Set attribution windows and paid-reuse rules in advance. A save is a behavioural signal, not proof of a purchase.

Alongside outcomes, keep separate counts for profiles discovered, qualified, contacted, replies, signed collaborations and completed deliverables (Figure 38). This shows whether the real constraint is supply, fit, response rate, negotiation or execution, and builds a benchmark for the next campaign.
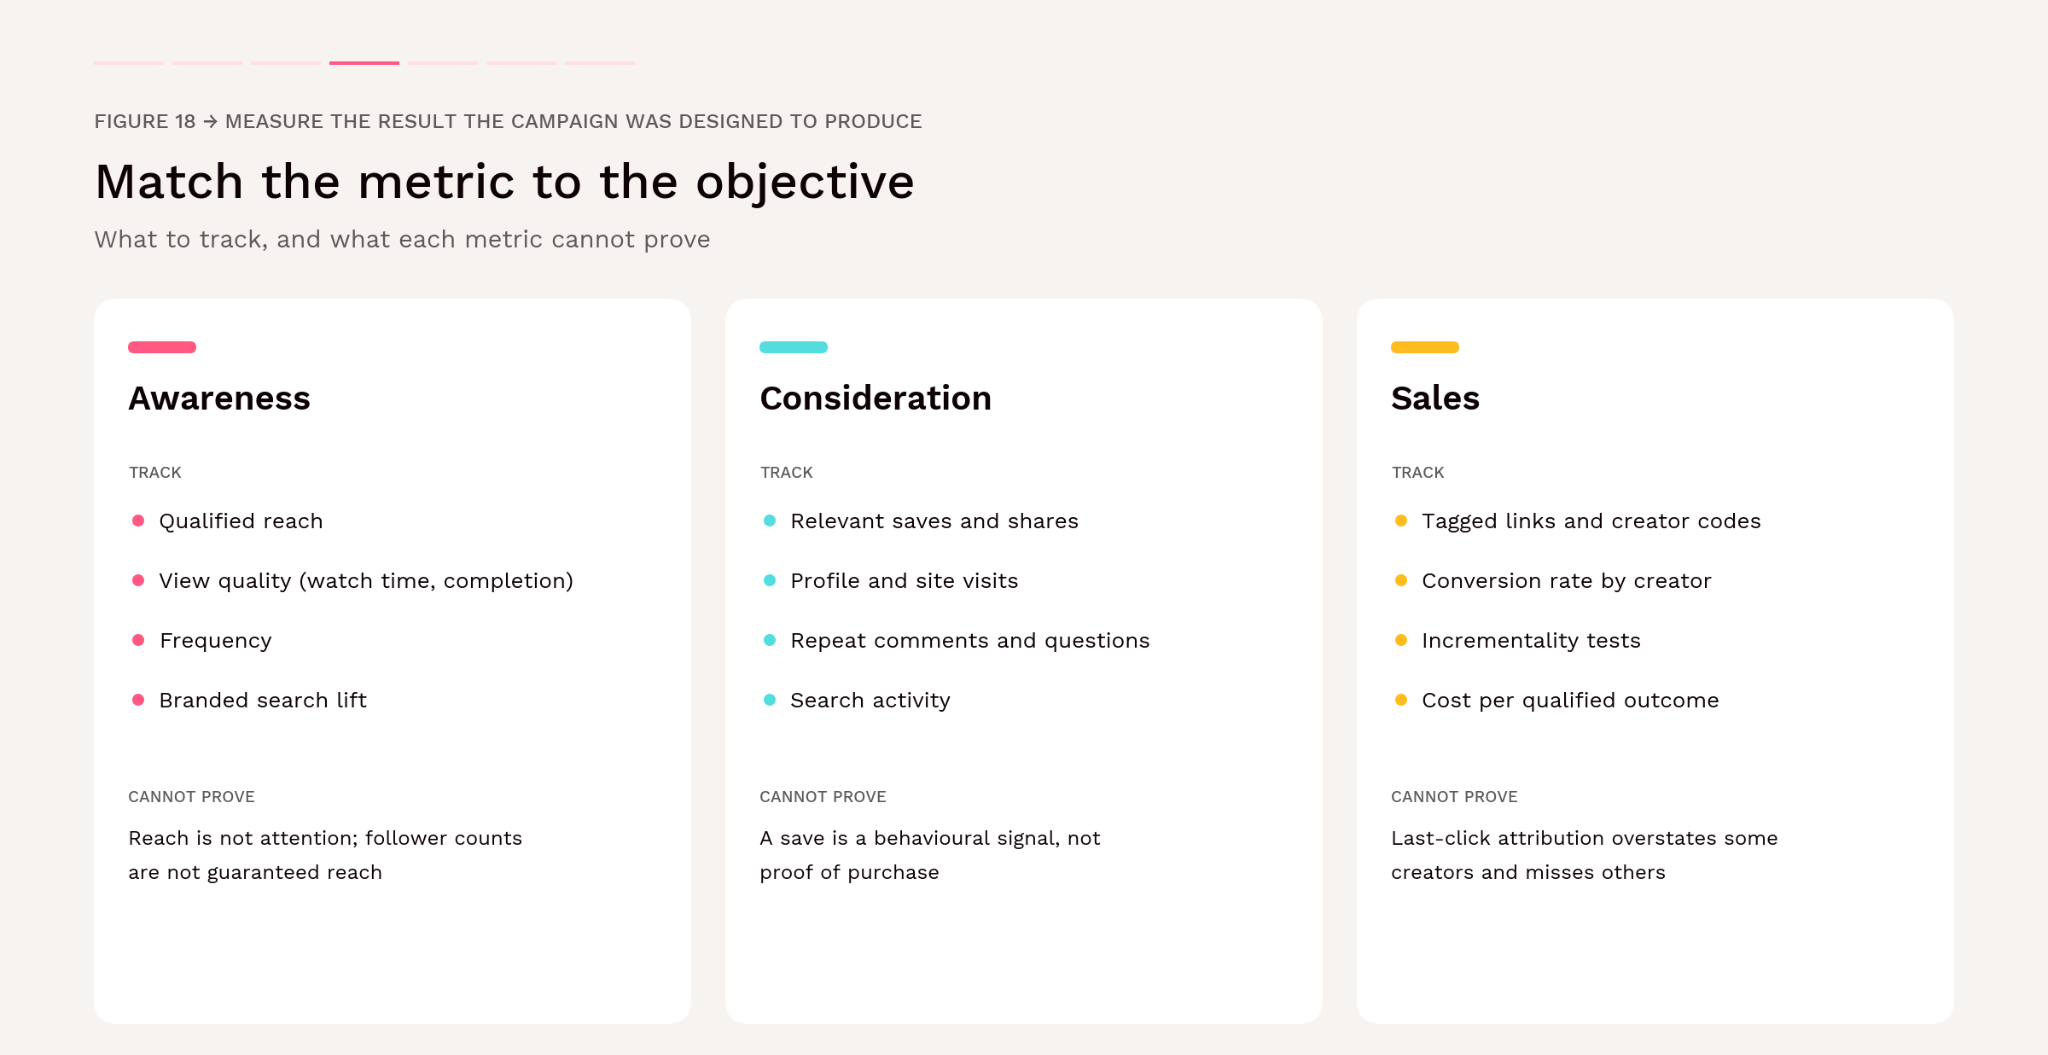
Figure 40 → Metrics by campaign objective, and what each cannot prove. Sources: [7].


2026 planning checklist

  • Size the discovery universe by state, then record how many candidates survive each filter.
  • Assign each target state a role: scale market or test market.
  • Validate audience location, language and authenticity for every shortlisted creator.
  • Build a tier portfolio weighted towards smaller creators, with a few larger profiles for distribution.
  • Shortlist per platform, deduplicate, and match each platform to the brief.
  • Write disclosure, approved claims and placement rules into every contract.
  • Agree metrics, attribution windows and reuse rights before launch.
  • Track the full recruitment funnel and keep the data for the next campaign.

Turn the market map into a relevant creator shortlist. Explore influencer discovery with Influencity. [5]

Illustrative application: a regional product launch

For a brand selling in both Texas and Louisiana, the two states offer contrasting tests. Texas has 3.9 times as many eligible profiles (726,574 against 187,854) and a far larger estimated audience (19.7M users against 2.4M). Louisiana has about 2.1 times the creator density (7.74% against 3.68%).

Use Texas for a broad audience-scale test and Louisiana for a smaller, high-density discovery test. In Texas, consider taste-test formats, which the food study found strongest there. In both states, validate that followers are actually local. Hold the offer, landing page, measurement window and audience criteria as consistent as practical, and compare qualified outcomes, not raw creator counts. This is a proposed test design, not an observed campaign result. [1, 8]

US INSTAGRAM INFLUENCER FAQS

US Instagram Influencer Marketing FAQS

icon-buble-pink-user-fav-conections

How many Instagram influencers are in the United States in 2026?

Influencity's 2026 dataset records 8,943,596 influencer-eligible Instagram profiles across 50 US states. The figure counts profiles meeting the study's eligibility filters, not verified professional influencers or unique individuals. [1]

icon-buble-pink-users-likes

Which US state has the most Instagram influencers?

California has the most, with 1,808,298 influencer-eligible Instagram profiles in Influencity's 2026 data, followed by New York (1,117,842), Florida (766,282), Texas (726,574) and Georgia (476,441). Wyoming has the fewest, with 5,229. The full 50-state ranking is in Appendix A.

icon-buble-pink-users-likes

Which US state has the lowest Instagram influencer density?

South Dakota has the lowest, with 1.58 eligible profiles per 100 estimated Instagram users in 2026, followed by New Hampshire (1.75%), New Jersey (1.85%), Wyoming (1.86%) and North Dakota (1.91%). The national figure is 4.64%. Low density describes relative supply, not a gap in demand or competition.

icon-buble-pink-chart-combined

What is influencer density?

Influencer density is the number of influencer-eligible profiles per 100 estimated Instagram users. In the US in 2026 it is 4.64%: about one eligible profile for every 21.5 estimated users. It measures how much creator supply a market has relative to its platform audience, not how well creators perform.

icon-buble-pink-dashboard-megaphone

How many mega-influencers are there in the US?

Influencity's 2026 data records 8,294 US Instagram profiles with more than 1 million followers, 0.09% of all eligible profiles. California holds 4,510 of them (54.4%) and New York 2,056 (24.8%). Six states (Iowa, Maine, Rhode Island, Vermont, West Virginia and Wyoming) record none.

icon-buble-pink-document-chart-search

Do younger states have more Instagram influencers?

No. Across the 50 states, the number of eligible profiles per 1,000 residents shows no meaningful link with residents' median age (rank correlation −0.07). Utah, the youngest state, has fewer creators per resident than the national average, while Florida, one of the oldest, ranks seventh.

icon-buble-pink-muscle

Do richer states have more Instagram influencers?

No. Median household income shows no meaningful link with creators per resident or with creator density across the 50 states. Wealth is linked to the type of pool, though: richer states have proportionally more creators with 10,000+ followers and more gender-balanced pools.
icon-buble-pink-chart-pie-half-stars

Which influencer niche has the most female creators?

Beauty: 77.0% of classified beauty creators on US Instagram are female, about 3.3 for every male creator. Tech and gaming is the most balanced niche, but still majority female (54.2%). Across all eligible profiles, 60.2% of classified creators are female.

icon-buble-pink-hand-puzzle

Are there more influencers on TikTok or Instagram in the US?

TikTok has more. Influencity's 2026 TikTok data records about 14.5M eligible US profiles, against 8.94M on Instagram, even though Instagram's estimated audience is larger (192.6M users against 153.0M). TikTok's influencer density is about twice Instagram's. The two counts overlap, so they shouldn't be added together.

icon-buble-pink-doc-search

How do US Instagram influencers compare to Europe and Latin America?

The US has the highest estimated Instagram reach of the three regions (56.5% of the population) but the smallest creator pool: 8.94M profiles, against 12.40M in Europe and 18.35M in Latin America. Its creator density (4.64%) sits between Europe (4.21%) and Latin America (5.67%).

icon-buble-pink-pencil-stars

Where does the data in this study come from?

Every statistic comes from Influencity's own data: a 2026 export of its influencer database, its Monitoring Tool and Social Listening, and earlier Influencity studies. Contextual inputs from the US Census Bureau and the Bureau of Economic Analysis are labelled with their source wherever they appear.

icon-buble-settings-dashboar

How many US Instagram users are included in this study?

The study includes an estimated 192,606,008 Instagram users across the 50 states. This is the study's audience-estimate field, not a claim about Meta's official monthly-active-user total or deduplicated campaign reach. [1]

icon-buble-pink-users-global

What percentage of Instagram users are influencer-eligible profiles?

Dividing 8,943,596 eligible profiles by 192,606,008 estimated users gives 4.64%. This creator-density ratio combines two dataset measures; it should not be read as a verified person-level probability. [1]

icon-buble-pink-users-select

Which state has the highest Instagram influencer density?

New York leads at 9.80%, followed by California at 7.79%, Louisiana at 7.74% and Georgia at 7.65%. Density means eligible profiles divided by estimated Instagram users in that state. [1]

icon-buble-settings-dashboar

Which states have the most Instagram creators per resident?

New York has 55.9 eligible profiles per 1,000 residents, followed by California (45.9), Georgia (42.2) and Louisiana (40.7). The 50-state rate is 26.2. [1]

icon-buble-pink-mobile-content-search-heart

Are most US Instagram influencers women?

Female-classified profiles account for 60.2% of profiles classified as male or female. Across all eligible profiles, 21.5% are unclassified. These labels do not establish self-identified gender or the gender of creators' followers. [1]

icon-buble-pink-users-likes

What share of US Instagram influencers are nano-influencers?

About 89% of the 8,943,596 eligible profiles have fewer than 10,000 followers. Micro-influencers (10k–100k) make up 9.4%, macro (100k–1M) 1.2% and mega (1M+) 0.09%. [1]
icon-buble-pink-users-balance

Do micro-influencers get more engagement than celebrities?

In two Influencity category studies, yes. In supplements, creators under 100k followers averaged a reported 57% engagement rate against 24% for accounts over 1M; in food, micro-creators accounted for more than half of tagged posts. The 2026 profile counts in this study do not measure engagement. [7, 8]

icon-buble-pink-settings-arrows

Does disclosing #ad reduce engagement?

No. In Influencity's supplements study: posts with a clear #ad or #sponsored disclosure performed 12% better on long-term engagement, and 78% of Instagram posts in that sample were explicitly disclosed. US rules also require clear disclosure of paid relationships. [7]

icon-buble-pink-users-global

Does higher creator density mean better campaign performance?

No. Density describes relative profile supply. It does not measure audience fit, content quality, availability, fees or conversion. Use the state-level analysis to guide discovery, then vet individual creators and campaign outcomes.

icon-buble-pink-megphone-social-networks-dispersion

Are there more female or male Instagram influencers in the US?

There are more female influencers. Influencity's 2026 data records 4,222,965 female-classified US Instagram profiles against 2,795,054 male-classified ones, about 1.5 women for every man. Women make up 60.2% of classified profiles. Another 1,925,577 profiles (21.5%) have no gender classification, often brand or organization accounts.

icon-buble-pink-users-select

Which US state has the highest share of female Instagram influencers?

South Dakota, where 67.6% of classified influencer profiles are female, followed by Iowa (67.5%), North Dakota and West Virginia (both 65.6%). Rural, plains and southern states lean most female. Female-classified creators outnumber male ones in all 50 states.

icon-buble-pink-user-square-sniper

Are macro Instagram influencers more likely to be men?

Among the biggest accounts, men and women are almost exactly equal. US Instagram profiles with over 1 million followers include 3,261 female-classified and 3,247 male-classified creators, a difference of just 14. Women's majority is largest among nano influencers (60.7%) and narrows as follower counts grow.

icon-buble-pink-document-pie-chart-two-arrows-document-graph

Are there male beauty influencers on Instagram?

Yes, almost 319,000 in the US, about one in four classified beauty creators. The beauty niche is still the most female niche on US Instagram: 77.0% of classified beauty creators are female, around 3.3 for every male creator.

icon-buble-pink-settings-connections

Is tech and gaming dominated by male influencers?

No. On US Instagram, 54.2% of classified tech and gaming creators are female, making it the most gender-balanced niche, but still majority female. That contrasts with the common view of tech and gaming as male-dominated content areas.

icon-buble-pink-search-chart

Which state has the most gender-balanced Instagram influencers?

California, where 55.7% of classified creators are female and 44.3% male. New Jersey (57.5%), New York (57.9%), Hawaii (58.2%) and Connecticut (58.3%) follow. The most balanced states tend to be large coastal markets with more big creators, and larger creators are more evenly split by gender.

icon-buble-pink-chart-pie-half-stars

What are the most popular influencer niches on US Instagram?

Retail and fashion, and food and drink are the largest niches, each with about 3.0 million tagged profiles, roughly a third of the 8.94M eligible pool. They're followed by tech and gaming (2.60M), wellness (2.15M), travel (2.04M) and beauty (1.68M). Creators can appear in several niches.

16 → RESEARCH DESIGN

Methodology: How this Influencity Study Was Produced

This is an analytical and descriptive study of the US Instagram influencer market, built on Influencity's own data. It draws on three layers of evidence, kept separate throughout. The core is a 2026 export from Influencity's influencer database. Influencity's earlier and companion studies add historical and regional context, and its category studies add performance evidence. External and third-party inputs are used only as context, and each is labelled with its status.

Where the Numbers Come from

Every statistic in this study comes from Influencity's own data and tools: the 2026 export of Influencity's influencer database, the Influencity platform's Monitoring Tool, and Influencity's earlier and companion studies. The only exceptions are the contextual inputs named in this section: the population and estimated-user fields, the TikTok benchmark and the third-party statistics quoted in our category studies. Each is labelled with its source and status wherever it appears.

Derived figures, such as ratios, shares and changes, are direct calculations from the source values, and each can be traced to the study table it comes from. Sentiment shares in the supplements study were classified by the natural language processing built into Influencity's Monitoring Tool, with disclosure and compliance coded manually.
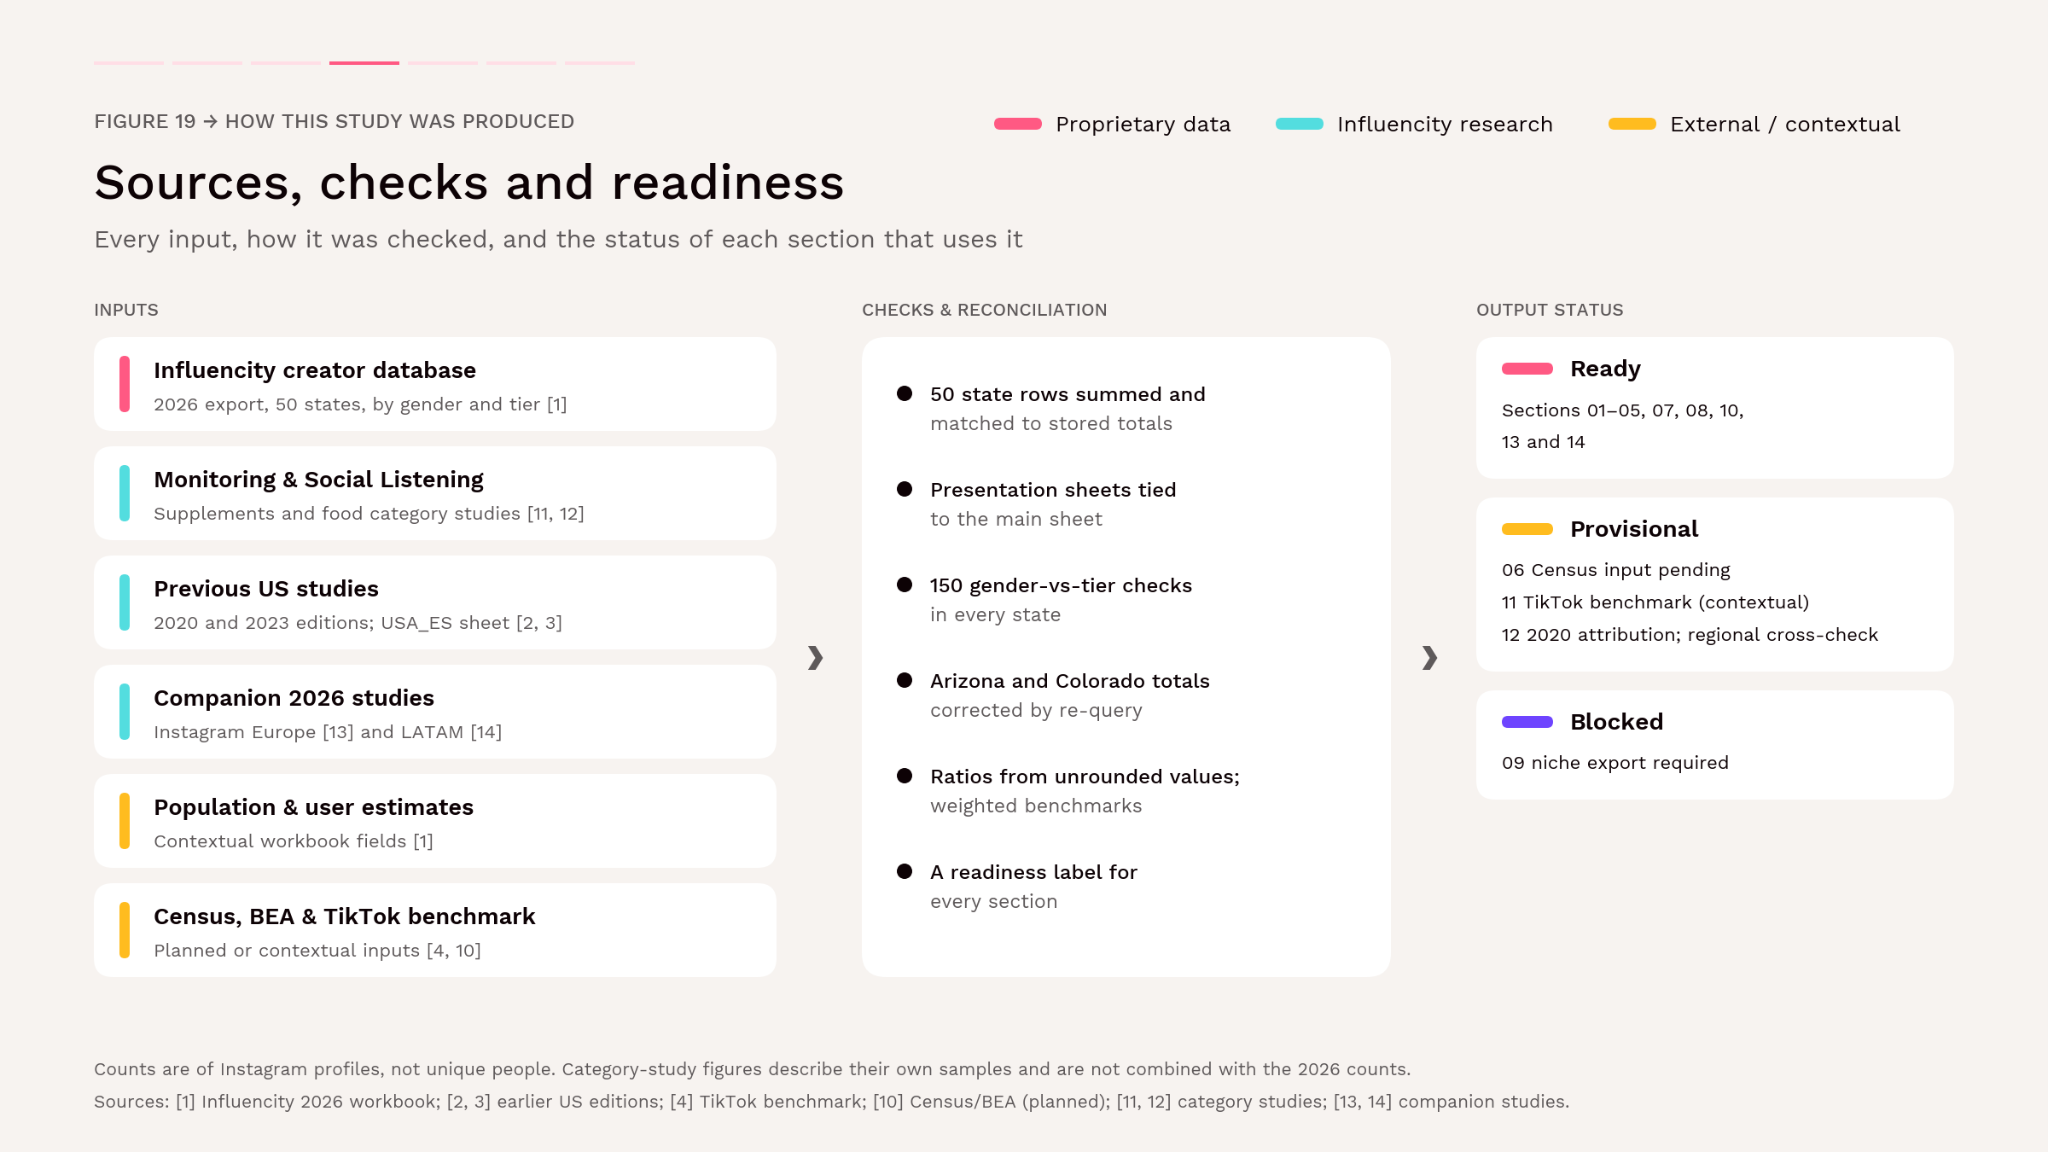
Figure 41 → Sources, checks and readiness for this study. A profile-level census or independently audited sampling frame is not implied. Sources: [1–4, 6–10].

Evidence Used in this Study

Evidence

Source

What it provides

Where used

Influencity influencer database, 2026 export

Proprietary [1]

Eligible profiles by state, gender and follower tier

Sections 01–08, 10, 14

Influencity Monitoring Tool

Proprietary, supplements study [7]

Engagement, sentiment, disclosure and compliance in sponsored posts

Sections 11, 13, 14

Influencity Social Listening

Proprietary, food study [8]

Conversation volume, creator tiers and state ratings for food content

Sections 10, 13, 14

Previous US studies, 2020 and 2023

Influencity [2, 3]

Historical profile and user totals; 2020 state rows

Section 12

Companion 2026 studies

Influencity Europe [9] and LATAM [10]

Regional benchmarks on the same metric definitions

Section 12

Population and estimated users

Contextual fields on the platform [1]

Denominators for density and audience ratios

Sections 01, 04–06

TikTok benchmark

From Influencity's 2026 TikTok US study [4]

TikTok users and profiles

Section 11

Census Bureau and BEA data

External [6]

Median age; state wealth and industry mix

Sections 06, 09

Third-party statistics quoted in category studies

As named in [7, 8]

Consumer survey and market-size figures

Section 13

Source and Unit of Analysis

The primary data is an export from Influencity's influencer database, which indexes public creator profiles across Instagram, TikTok and YouTube for influencer discovery [+350 public profiles]. For this study, Instagram profiles located in the US were aggregated by state, with fields for population, estimated Instagram users, eligible profiles, gender classification and follower tier. The unit counted is an Instagram profile, not a unique individual, business, campaign or paid partnership. One person or brand can hold several profiles. [1]

Geographic Coverage

The study covers 50 US states. The District of Columbia and US territories are not separately represented. "US total" means the sum of those 50 state rows. State attribution describes the profile location recorded in Influencity's database; it does not establish citizenship, legal residence or where a creator's followers live. [1]

Eligibility and Follower Tiers

"Influencer-eligible profile" means a public profile that meets the study's eligibility and follower filters. Profiles are grouped into four follower bands: nano (under 10k), micro (10k–100k), macro (100k–1M) and mega (1M+). The minimum nano threshold, age rules and boundary treatment form part of the release documentation. Inclusion does not demonstrate professional status, campaign participation, purchasing influence or availability. [1, 4]

Influencity's Social Listening Tools

The 2026 data counts profiles but holds no performance data. To show how creators actually perform, this study draws on two Influencity category studies, each built with a different Influencity tool:

  • Supplements study [7]: produced with the Influencity Monitoring Tool. It covers 5,000+ sponsored posts on TikTok, Instagram and YouTube in the US and Mexico, January–June 2025. Comment sentiment was classified with natural language processing. Disclosure and health-claim compliance were coded manually, with inter-coder agreement checked on a 15% sample (Cohen's kappa above 0.80). The sample included only posts with 500+ comments from creators with an engagement-to-follower ratio of at least 2%.
  • Food study [8]: produced with Influencity Social Listening. It covers 10,568 social mentions across TikTok, Instagram and YouTube in California, New York, Texas, Florida and Illinois, plus a 20-creator dataset and nine brand case studies.

These studies use different samples, platforms and periods from the 2026 study. Their figures are always labelled with their source and are never combined with the profile counts.

Previous Influencity Studies

Influencity published earlier US studies in 2020 [2] and 2023 [3]. Their reported totals give historical reference points in section 12. 2020 edition totals exactly (8,279,357 profiles; 89,892,000 users) and carries state rows, which allow the 2020-to-2026 share comparison.

Comparison with Europe and Latin America

This study is part of a series of 2026 Influencity studies. Section 13 compares the US with the companion studies of Instagram in Europe (30 markets) [9] and Latin America (20 markets) [10]. All three studies use workbooks with the same field structure and the same metric definitions, and every ratio is recalculated from unrounded market rows. That makes the comparison closer than most cross-region benchmarks.

Two differences remain: user estimates come from different sources in each region, and US states are not equivalent to countries. The Europe and LATAM figures were taken from the companion studies.

External and Third-Party Data

  • Population and estimated users. The population (341.1M) and estimated Instagram user (192.6M) fields come with the data and are used as denominators. The population figure is of the same order as recent Census Bureau estimates in 2025.
  • Census Bureau median age (section 06). Age comparison used the median age by state from the American Community Survey (table B01002) or the Population Estimates Program, using the vintage that matches the population field. [6]
  • BEA and Census economic data (section 09). The niche analysis uses GDP per capita or median household income, and industry shares of state GDP. [6]
  • TikTok benchmark (section 11). Users and profiles from the "From Influencity's 2026 TikTok US study [4]" 
  • Third-party statistics in the category studies (section 14). Listed with the source of each study name and a verification status. 

Aggregation, Validation and Corrections

  • Totals. National population, audience and profile totals were recalculated by summing the 50 state rows. They were then checked against Influencity’s proprietary data stored totals and its presentation sheets.
  • Calculations. All percentages, ratios and rankings are calculated from unrounded values. National benchmarks are weighted (total profiles ÷ total users), not averages of state percentages.

Metric Definitions and Research Limitations

Metric

Calculation

Interpretation

Creator density

Eligible profiles / estimated users × 100

Relative recorded profile supply

Density index

State density ÷ national density

Above 1.00x means above the national benchmark

Users per eligible profile

Estimated users ÷ eligible profiles

Market-level ratio, not individual reach (sections 11, 14)

Profiles per 1,000 residents

Eligible profiles ÷ population × 1,000

Supply relative to residents (section 06)

State share of supply

State profiles ÷ 50-state profiles × 100

Geographic concentration

Audience-to-population ratio

Estimated users ÷ population × 100

Contextual estimate, not resident adoption

Female share, classified

Female ÷ (female + male) × 100

Excludes unclassified profiles

Unclassified share

Unclassified ÷ all profiles × 100

Classification coverage

Tier share

Tier profiles ÷ all eligible profiles × 100

Nano derived as the residual (section 08)

Change in reported count

(Later − earlier) ÷ earlier × 100

Change between studies, not market growth (section 12)

Percentage-point change

Later share − earlier share

Share comparisons (section 12)

Density excluding largest market

(Profiles − largest market's) ÷ (users − largest market's) × 100

Regional density without its dominant market (section 12)

Density range

Highest market density ÷ lowest

Spread across markets (section 12)

Engagement rate (category study)

As reported by the supplements study [7]

Quote direction only (section 13)

Spearman rank correlation

Correlation between two state rankings (1–50); ρ = 1 − 6Σd² ÷ (n(n² − 1))

−1 to +1; strength and direction of a consistent relationship, robust to outliers such as California and New York (sections 02, 04, 06, 07, 09)

Statistically clear

p < 0.05 for the correlation across 50 states (about ±0.28 or stronger)

The pattern is unlikely to be chance. "Not clear" does not prove no relationship; neither proves cause

Herfindahl–Hirschman Index and effective number of states

Sum of the squared percentage shares of all 50 states

Effective number of states = 10,000 ÷ HHI.

Share of variation

Variance of log(profiles per resident) split into log(reach), log(density) and their combined term

How much of the difference between states comes from audience reach versus creator density (sections 02, 06)

Niche share

Niche share = creators tagged in the niche ÷ all eligible profiles × 100.

For example, beauty: 1,682,623 ÷ 8,943,596 × 100 = 18.8%.

Proportion of the creator pool in a niche; creators can hold several tags, so shares sum to more than 100% (section 09)

National benchmarks are weighted (total profiles ÷ total users), not averages of state or market percentages.

Gender Classification Is Not Self-Identification

Male, female and unclassified are labels assigned in Influencity's database. They are not a complete account of gender identity and do not describe followers. The unclassified category (21.5% of all profiles) always stays visible rather than being redistributed between male and female. State, tier and regional comparisons may be affected by differences in classification coverage. [1]

What the Study Cannot Establish

The profile counts do not establish account authenticity, the share of bots, recent posting activity, professional employment, creator fees, engagement quality, follower overlap, audience age, creator age, niche, purchasing intent or campaign return. Nor do they establish that every state-level profile is a different person.

The category-study findings describe their own samples, a single category and period each, and cannot be applied to the 8.94M profiles. A non-random database extract does not support a conventional survey margin of error or confidence interval, so none is reported.

APPENDIX A → STATES RANKING

Instagram Influencers by state: full ranking

Density = eligible profiles / estimated users. Female share excludes unclassified profiles. All figures describe the supplied 2026 data, not verified unique people. All figures describe Influencity's 2026 database export.

Rank

State

Eligible profiles

Estimated users

Density

Female share

Per 1,000 residents

1

California

1,808,298

23,214,048

7.79%

55.7%

45.9

2

New York

1,117,842

11,401,958

9.80%

57.9%

55.9

3

Florida

766,282

14,077,223

5.44%

61.6%

32.7

4

Texas

726,574

19,742,154

3.68%

62.6%

22.9

5

Georgia

476,441

6,231,751

7.65%

60.2%

42.2

6

North Carolina

282,087

6,636,167

4.25%

62.3%

25.2

7

Illinois

277,980

7,067,063

3.93%

61.1%

21.9

8

Pennsylvania

269,909

6,798,000

3.97%

59.3%

20.7

9

Tennessee

226,231

4,205,951

5.38%

61.4%

30.9

10

Ohio

225,230

6,089,603

3.70%

61.3%

18.9

11

Michigan

189,526

5,230,240

3.62%

60.7%

18.7

12

Louisiana

187,854

2,426,288

7.74%

61.2%

40.7

13

Virginia

146,767

5,096,126

2.88%

60.7%

16.5

14

Massachusetts

143,202

4,122,525

3.47%

61.3%

20.0

15

South Carolina

137,370

3,088,321

4.45%

64.6%

24.7

16

Alabama

131,930

2,611,561

5.05%

64.5%

25.4

17

Arizona

126,723

4,653,683

2.72%

61.8%

16.6

18

Missouri

118,589

3,274,720

3.62%

64.5%

18.9

19

Washington

113,091

4,763,708

2.37%

61.7%

14.1

20

Maryland

111,031

3,582,667

3.10%

58.5%

17.7

21

Colorado

110,194

3,621,972

3.04%

60.9%

18.3

22

New Jersey

102,715

5,562,244

1.85%

57.5%

10.8

23

Mississippi

98,071

1,419,911

6.91%

62.9%

33.2

24

Nevada

89,674

2,019,608

4.44%

58.6%

27.3

25

Kentucky

80,515

2,291,693

3.51%

64.2%

17.5

Source: Influencity proprietary 2026 data [1].

Instagram creators by state: full ranking (continued)

National totals: 8,943,596 eligible profiles; 192,606,008 estimated users; 4.64% density; 26.2 profiles per 1,000 residents; 60.2% female share among classified profiles.

Rank

State

Eligible profiles

Estimated users

Density

Female share

Per 1,000 residents

26

Indiana

79,735

3,610,635

2.21%

64.1%

11.4

27

Oregon

73,729

2,397,835

3.07%

60.5%

17.3

28

Oklahoma

71,953

2,157,385

3.34%

64.9%

17.5

29

Utah

70,450

1,953,939

3.61%

61.7%

19.9

30

Minnesota

69,913

3,195,556

2.19%

64.5%

12.0

31

Arkansas

67,319

1,551,083

4.34%

65.1%

21.6

32

Wisconsin

65,415

3,083,029

2.12%

64.5%

11.0

33

Hawaii

50,087

808,339

6.20%

58.2%

35.0

34

Connecticut

47,412

2,036,399

2.33%

58.3%

12.9

35

Kansas

34,574

1,539,432

2.25%

65.4%

11.6

36

Iowa

31,608

1,639,392

1.93%

67.5%

9.8

37

Nebraska

27,244

1,045,167

2.61%

65.2%

13.5

38

Idaho

24,746

1,224,864

2.02%

64.8%

12.2

39

New Mexico

23,695

1,125,838

2.10%

60.5%

11.1

40

Rhode Island

22,452

615,245

3.65%

60.2%

20.1

41

West Virginia

21,595

829,499

2.60%

65.6%

12.2

42

Delaware

16,858

599,077

2.81%

60.0%

15.9

43

Maine

15,151

696,442

2.18%

65.5%

10.7

44

Montana

14,245

587,434

2.42%

61.1%

12.4

45

New Hampshire

13,154

753,748

1.75%

62.1%

9.3

46

Alaska

9,801

376,382

2.60%

59.6%

13.3

47

South Dakota

8,160

515,470

1.58%

67.6%

8.7

48

North Dakota

7,673

402,665

1.91%

65.6%

9.6

49

Vermont

7,272

351,346

2.07%

58.4%

11.3

50

Wyoming

5,229

280,622

1.86%

58.9%

8.9

Source: Influencity proprietary 2026 data.  Tier detail only.

APPENDIX B →ASSET REGISTER

Statistical graphics

Fig.

Asset

Alt text

01

Creator density tile map

Tile map of the 50 US states coloured by Instagram creator density in 2026; New York highest at 9.8 percent; US benchmark 4.64 percent.

02

Top 10 states by supply

Top 10 US states by Instagram influencer-eligible profiles in 2026, led by California with 1.81 million and New York with 1.12 million.

03

Concentration

Top five states hold 54.7 percent of US Instagram eligible profiles and 38.8 percent of estimated users.

04

Cumulative shares

Cumulative share of eligible profiles, estimated users and population, with states ranked by profiles; five states hold 54.7 percent of profiles but 36.9 percent of residents.

05

Largest market by region

Share of each region's Instagram creator pool held by its largest market: California 20.2 percent in the US, Russia 23.2 percent in Europe, Brazil 66.1 percent in Latin America.

06

Audience ratio vs density

Estimated Instagram audience relative to population against creator density for 50 states; Texas and New York on different sides of the relationship.

07

Highest-reach states

The eight states with the highest estimated Instagram reach and their creator density; only Florida exceeds the 4.64 percent benchmark.

08

Density index

Creator-density index: New York 2.11 times the benchmark, California 1.68, Louisiana 1.67, Georgia 1.65.

09

Density split by tier

Creator density split into profiles under 10,000 followers and 10,000 or more for the nine above-benchmark states; New York and California lead on larger creators, Louisiana, Mississippi and Alabama on nano creators.

10

Profiles per 1,000 residents

Profiles per 1,000 residents for 50 states, from 55.9 in New York to 8.7 in South Dakota.

11

Per 1,000 vs median age

Eligible profiles per 1,000 residents against residents' median age for 50 states, showing no meaningful relationship.

12

Gender, two denominators

Female profiles account for 60.3 percent of classified US Instagram creators; 21.3 percent of all eligible profiles are unclassified.

13

Female share by state

Female share of classified profiles in all 50 states, from 55.7 percent in California to 67.6 percent in South Dakota, with each state's unclassified share.

14

Female share by tier and state

Female share of classified profiles falls from 60.7 percent in the nano tier to 50.1 percent in mega; states with more creators above 10,000 followers are more gender-balanced.

15

Gender by region and platform

Female share of classified profiles: 60.2 percent on US Instagram, 59.8 in Europe, 61.1 in Latin America and 63.1 on US TikTok; unclassified shares differ widely.

16

Tier mix

About 89 percent of US Instagram eligible profiles have fewer than 10,000 followers.

17

CA + NY by tier

California and New York account for 79.2 percent of mega profiles and 32.8 percent of all profiles.

18

Top-five share per tier

The five largest states in each tier hold 52.5 percent of nano, 72.0 percent of micro, 84.6 percent of macro and 92.0 percent of mega profiles.

19

Gender by tier

Female share of classified profiles falls from 60.7 percent in the nano tier to 50.1 percent in the mega tier.

20

Tiers by region

Instagram creator pool by follower tier in the US, Europe and Latin America in 2026; nano profiles make up 87 to 89 percent of each region.

21

Income vs per 1,000

Median household income against eligible profiles per 1,000 residents for 50 states, showing no meaningful relationship

22

Income correlations

Rank correlations between median household income and seven creator measures; no link with creator supply, clear links with reach, tier mix and gender classification.

23

Niches

Creators tagged in six niches on US Instagram: retail and fashion 3.00 million, food and drink 2.98 million, tech and gaming 2.60 million, wellness 2.15 million, travel 2.04 million, beauty 1.68 million.

24

Gender by Niche

Female share of classified creators by niche, from 54.2 percent in tech and gaming to 77.0 percent in beauty.

25

Six state spotlights

Key figures for six state spotlights: California, New York, Louisiana and Georgia, Mississippi, Hawaii, and Florida versus Texas.

26

Louisiana vs Georgia

Louisiana and Georgia have near-identical creator density (7.74 and 7.65 percent), but 5.2 versus 9.9 percent of their creators have 10,000+ followers.

27

Florida vs Texas

Florida has 766,282 eligible profiles against 726,574 in Texas, with 14.1 million versus 19.7 million estimated users; creator density 5.44 against 3.68 percent.

28

Instagram vs TikTok density

Instagram creator density of 4.64 percent versus about 9.5 percent for the TikTok benchmark; methods require alignment.

29

Instagram vs TikTok, audience and creators

Three bar charts comparing Instagram and the TikTok benchmark in the US, 2026: estimated users 192.6 million vs 153.0 million; eligible profiles 8.94 million vs 14.5 million; users per eligible profile 21.5 vs 10.6.

30

State share, 2020 vs 2026

California's share of recorded profiles fell 5.78 points between the 2020 data and 2026; Florida rose 1.72 points.

31

Snapshots and scenarios

Reported snapshots of 8.28 million (2020), 10.2 million (2022 data) and 8.94 million (2026), with dashed illustrative 2027–2029 cases ending at 8.10, 8.94 and 9.30 million.

32

Five regional ratios

Five ratios for Instagram in the US, Europe and Latin America in 2026: creator density 4.64, 4.21 and 5.67 percent; users per population 56.5, 43.9 and 49.6 percent; profiles per 1,000 residents 26.2, 18.5 and 28.2; top five markets' share 54.7, 69.7 and 89.9 percent; female share of classified profiles 60.2, 59.8 and 61.1 percent.

33

Density excluding largest market

Creator density with and without each region's largest market: US 4.64 to 4.21 percent without California, Europe 4.21 to 4.13 percent without Russia, Latin America 5.67 to 3.42 percent without Brazil.

34

Density spread by region

Range of creator density across markets: US states from 1.58 to 9.80 percent, European markets from 2.69 to 5.57 percent, Latin American markets from 0.58 to 8.57 percent, with each region's median and benchmark marked.

35

Supplements engagement by tier

Influencity 2025 supplements study: average engagement as reported, 57 percent for micro-creators, 38 percent macro, 24 percent celebrity; about 2.4 times higher for micro-creators than celebrities.

36

Supplements platform metrics

Influencity 2025 supplements study: Instagram led on positive sentiment (68 percent), explicit disclosure (78 percent), disclosure placement, claim compliance and the trust index (69 against 23 for TikTok).

37

Density vs food-study ratings

Creator density for New York, California, Florida, Illinois and Texas alongside Influencity food-study penetration ratings; the three above-benchmark states are rated high or very high.

38

Campaign decision sequence

Four-step campaign decision sequence: map supply, establish fit, validate and activate, measure and learn, with supporting figures from the study and a seven-stage recruitment funnel from discovered to outcomes.

39

State selection map

Scatter chart of 50 US states by eligible profiles and creator density in 2026; California, New York, Florida and Georgia are large above-benchmark markets, while Louisiana, Mississippi, Hawaii, Tennessee and Alabama are smaller above-benchmark test markets.

40

Measurement by objective

Campaign metrics by objective: awareness, consideration and sales, each with what to track and what the metric cannot prove.

41

Methodology: sources and checks

Methodology diagram: six inputs (Influencity creator database, monitoring and social listening, previous US studies, companion Europe and LATAM studies, population and user estimates, Census, BEA and TikTok benchmark), the checks applied, and each section's readiness status.


REFERENCE REGISTER

Sources and Data Provenance

[1] Influencity. (2026). Proprietary export from Influencity's influencer database: US Instagram profiles by state, gender classification and follower tier. [October 2026]

[2] Influencity. (2020). The Largest Influencer Study in the United States in 2020 

[3] Influencity. (2023). The Largest Influencer Study in the US in 2023 

[4] Influencity. (2026). TikTok Influencer Marketing in the United States: 2026 Study. Source of TikTok users (153.0M), eligible profiles (14.5M) and gender classification (section 07).

[5] Influencity. Influencer discovery.

[6] US Census Bureau. Median age by state, American Community Survey 1-year estimates, table B01002. Used in sections 06, 07 and 10. B01002 https://data.census.gov/table/ACSDT1Y2024.B01002

[7] Influencity. (2025). The Influence Effect: How Social Media Creators Shape Consumer Perception and Purchasing Behavior in the Supplements Industry. Produced with the Influencity Monitoring Tool. 5,000+ sponsored posts; TikTok, Instagram and YouTube; US and Mexico; January–June 2025.

[8] Influencity. (2025). From Feed to Fork: How Foodie Influencers Shape Restaurant Choices in the U.S. Produced with Influencity Social Listening. 10,568 social mentions; California, New York, Texas, Florida and Illinois. 

[9] Influencity. (2026). Instagram Influencer Marketing in Europe: 2026 Study.

[10] Influencity. (2026). Instagram Influencer Marketing in Latin America: 2026 Study.

[11] Influencity. (2026). US Instagram creator counts by niche and gender classification (retail and fashion, food and drink, tech and gaming, wellness, travel and hospitality, beauty). Proprietary niche export. [Data export October 2026.]

[12] US Census Bureau. Median household income by state, American Community Survey 1-year estimates, table B19013 [2025]. Used in sections 09 and 10. https://data.census.gov/table/ACSDT1Y[2025].B19013

[13] US Bureau of Economic Analysis. Real GDP per capita by state [2025]. Used in section 09. https://www.bea.gov/data/gdp/gdp-state

Suggested attribution for external citations

Influencity. (2026). Instagram Influencer Marketing in the United States: 2026 Study. Cite the final canonical study URL and the specific table or figure used. Preserve the 50-state scope and the profile-versus-person distinction when reusing statistics.

Slider Resource Cards

View All Resources