Skip to content
Book a Call
Start Your Trial

Instagram Influencer Marketing in Latin America 2026 Study

Creator supply, density, audience penetration, gender and tier patterns across 20 Latin American markets, with US and Europe comparisons.

Instagram Influencer Marketing in Latin America 2026 Study

Creator supply, density, audience penetration, gender and tier patterns across 20 Latin American markets, with US and Europe comparisons.

OVERVIEW

The Latin American Instagram influencer marketing scene at a glance

18.41M

influencer-eligible profiles

323.5M

estimated Instagram users

5.69%

creator density

20

LATAM markets

Influencity's 2026 dataset records 18,412,413 influencer-eligible Instagram profiles and 323,500,000 estimated Instagram users across 20 Latin American markets, including Puerto Rico. That equals 5.69 eligible profiles per 100 estimated users, above the US (4.64) and Europe (4.21). Brazil contains 66.2% of recorded creator supply and has the highest creator density, at 8.62%. [1, 3, 4]

The regional total hides an important distinction: Brazil is not just the largest recorded creator market. Its weight also lifts the regional density benchmark. Outside Brazil, the remaining 19 markets contain 6.23M eligible profiles and have a combined density of 3.42%, below both the US and Europe. [1, 3, 4]

For brands and agencies, the opportunity is to build a relevant local roster, not simply to recruit from the biggest database. This study separates market size, audience-to-population ratios and creator density, compares LATAM with Influencity's US and Europe studies, and draws on Influencity's category research, including a supplements study that covers Mexico.
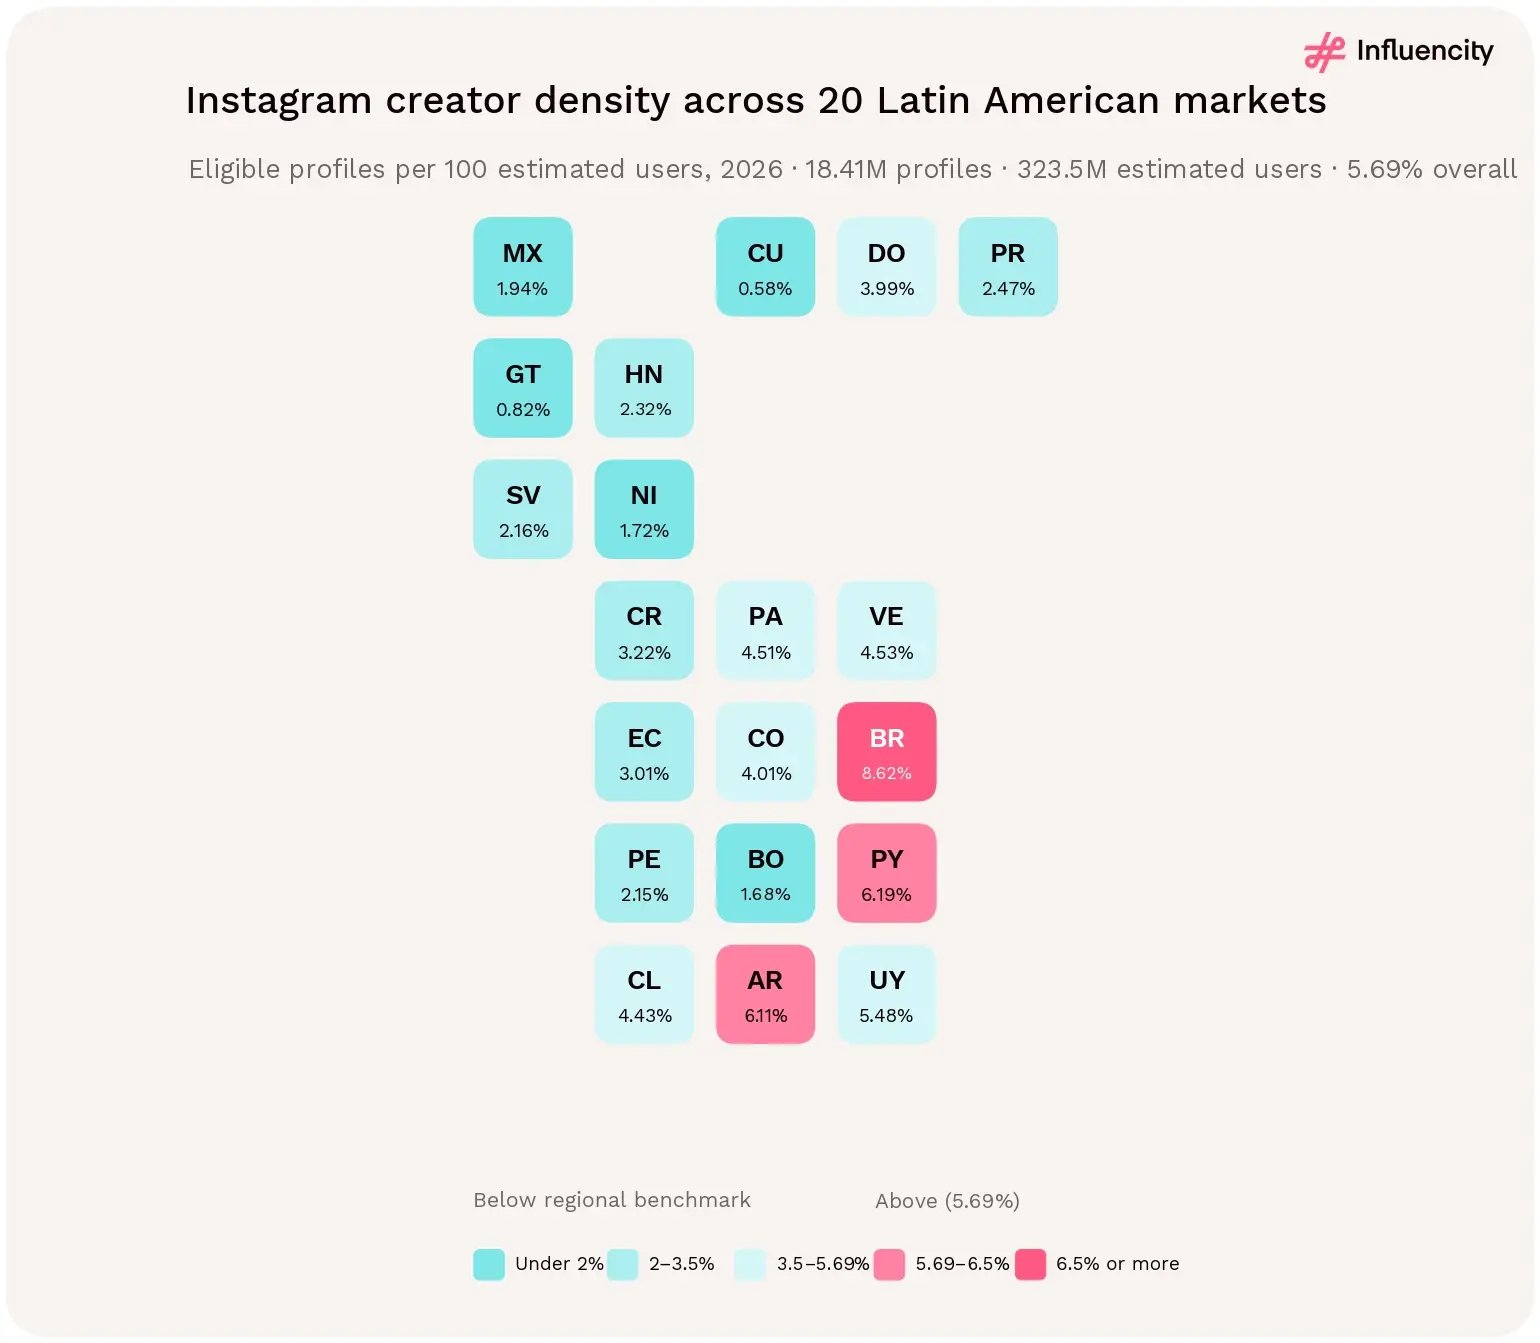
Tile map of Instagram creator density in 20 Latin American markets in 2026: Brazil leads at 8.62%, followed by Paraguay (6.19%) and Argentina (6.11%), against a 5.69% regional figure.

Figure 01 → Instagram creator-market overview for the 20-market study footprint, 2026. Profiles are not unique people; markets outside the footprint are not shown, not zero. Source: [1].

Reading the study

LATAM means the listed study footprint, not every Latin American or Caribbean market. User estimates are not verified monthly-active-user counts. Follower-tier figures are reported against all eligible profiles; 30,466 profiles (0.17%) are not assigned to a tier in the source data.

Section 13 compares LATAM with Influencity's 2026 US and Europe studies; section 14 adds evidence from two category studies, one of which covers Mexico. Their findings are labelled with source and sample wherever they appear. [8–13]

01 → EXECUTIVE SUMMARY

Key findings: what the 2026 data reveals

Latin America's 20 covered markets hold 18.41M influencer-eligible Instagram profiles in 2026, but supply is highly concentrated: Brazil holds two-thirds of it, five markets hold nine in ten, and creator density varies almost 15-fold between markets. The findings and visual summaries below cover scale, concentration, density, follower tiers, gender, niches and platforms. [1]

An 18.41M-profile discovery universe. Influencity records 18,412,413 eligible profiles against 323.5M estimated Instagram users. Eligibility does not establish campaign experience, availability, audience authenticity or commercial performance. [1]

Brazil accounts for two-thirds of supply, but less than half of users. Its 12,182,215 profiles represent 66.2% of the creator total, compared with 43.7% of estimated users: a 1.51-times supply-to-audience share index. On its own, Brazil's pool is 1.36 times the 8.94M profiles recorded across all 50 US states. [1, 4]

Removing Brazil changes every regional benchmark. Creator density falls from 5.69% to 3.42% across the other 19 markets, and eligible profiles per 1,000 residents fall from 28.3 to 14.3. Brazil itself is 2.52 times as creator-dense as that combined remainder. [1]
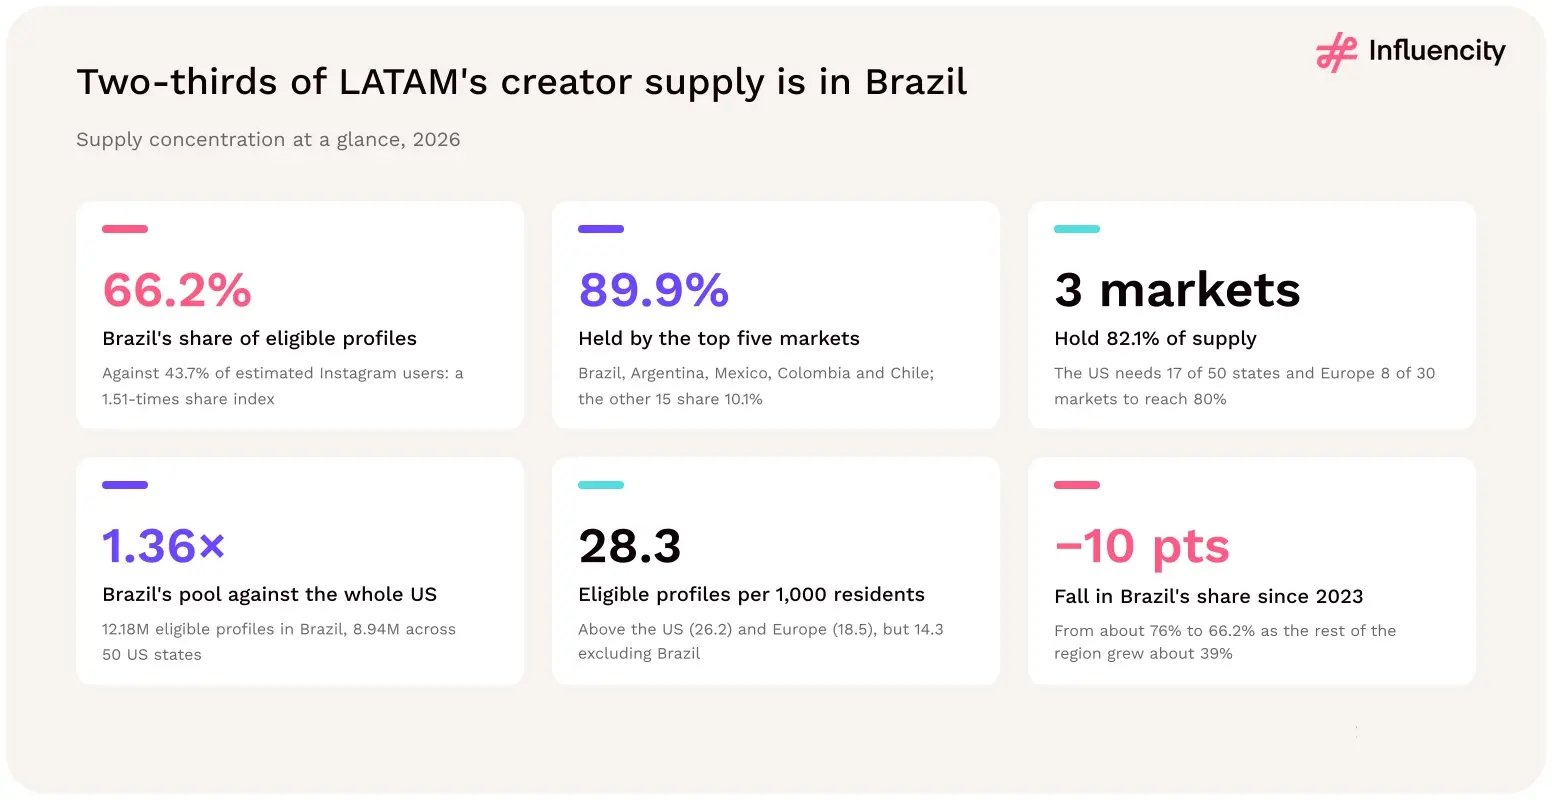
Two-thirds of LATAM's creator supply is in Brazil: it holds 66.2% of eligible profiles, the top five markets hold 89.9%, and Brazil's 12.18 million profiles are 1.36 times the whole US pool.

Figure 02 → Supply concentration at a glance: Brazil's share, top-market concentration, comparisons with the US and Europe, and change since 2023. Sources: [1, 3, 4, 6].

Creator density varies almost 15-fold across the footprint. It ranges from 8.62% in Brazil to 0.58% in Cuba, and only Brazil, Paraguay and Argentina sit above the 5.69% regional figure. Five markets below 2% hold 21.1% of estimated users but only 6.4% of eligible profiles. [1]
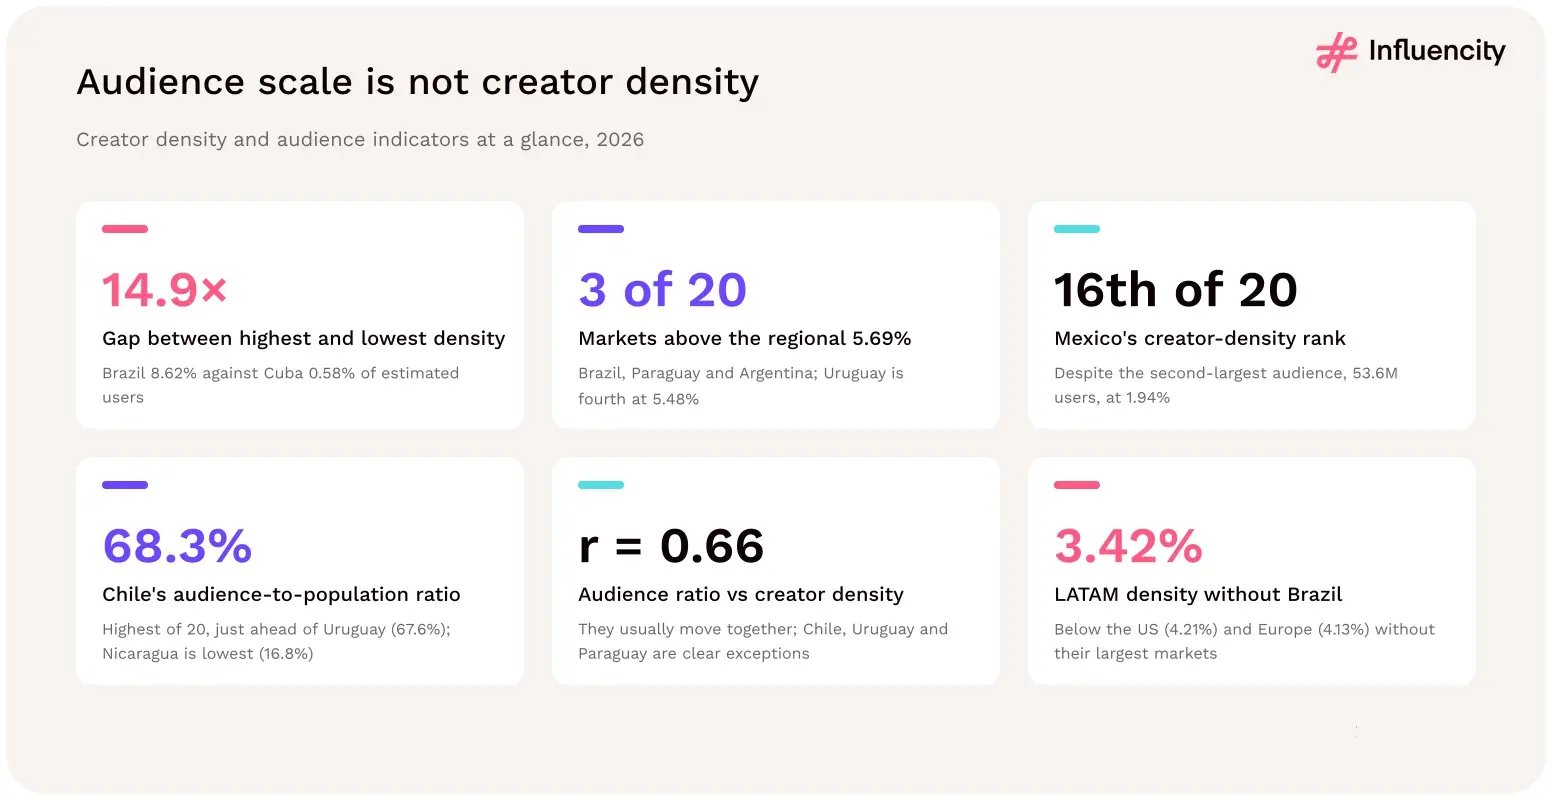
Audience scale is not creator density in LATAM: Brazil's 8.62% density is 14.9 times Cuba's 0.58%, while Mexico ranks 16th of 20 at 1.94% despite the second-largest audience.

Figure 03 → Creator density and audience at a glance: density range, Mexico's audience–density gap, audience-to-population ratios and regional comparisons. Sources: [1, 3, 4].

Nano creators make up most of the pool, and the top tiers are scarce. Nano profiles account for 88.0% of eligible profiles and micro for 10.7%. The 12,896 mega profiles with 1M+ followers are 0.07% of the pool, and five markets hold 92.9% of them. [1]
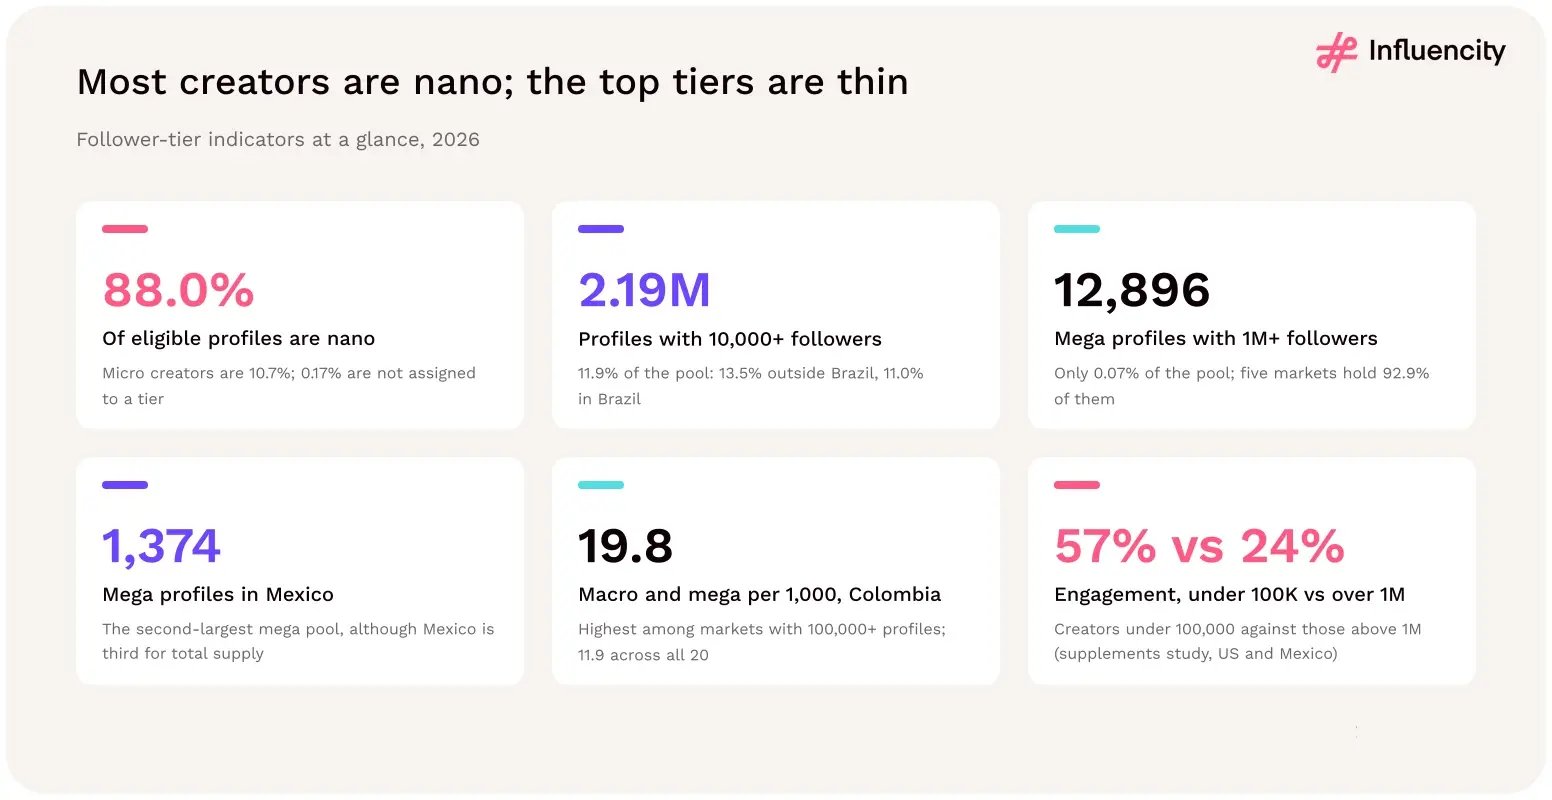
Most LATAM Instagram creators are nano (88.0% of eligible profiles), while 2.19 million profiles have 10,000+ followers and only 12,896 are mega profiles with 1M+ followers.

Figure 04 → Follower tiers at a glance: tier shares, the 10,000+ follower pool, mega-tier concentration and category engagement evidence. Sources: [1, 12].

The gender majority reverses at the mega tier. Women are 61.2% of male/female-classified profiles, but male-classified entries account for 54.9% of classified mega-tier records, a pattern seen in four of Influencity's five 2026 regional datasets. Per 1,000 classified profiles, men are 1.92 times as likely as women to reach 1M followers. [1, 8–11]
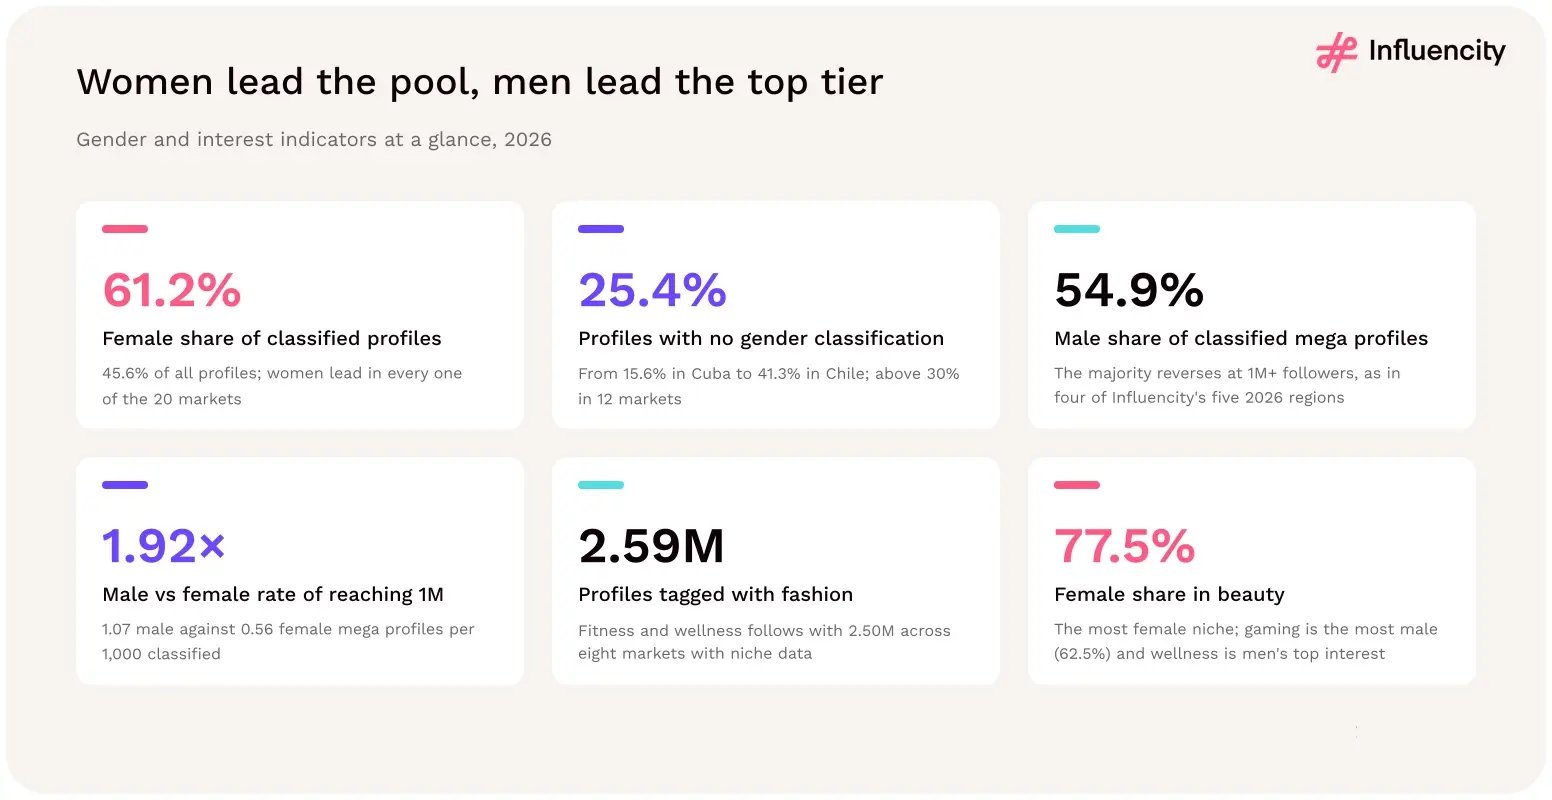
Women lead LATAM's classified Instagram profiles with a 61.2% share, but men make up 54.9% of classified mega profiles; 25.4% of profiles have no gender classification.

Figure 05 → Gender and interests at a glance: classified gender shares, unclassified records, the mega-tier reversal and the largest creator niches. Sources: [1, 8–11, 14].

TikTok's creator pool is far less concentrated in Brazil. Brazil holds 38.1% of eligible TikTok profiles, against 66.2% on Instagram, and TikTok has the larger pool in 16 of 20 markets. Across LATAM, however, TikTok's density is only 1.07 times Instagram's, compared with about 2.0 times in the US and Europe. [1, 2, 10, 11]

Plan reach by audience and recruitment by supply. Mexico and Peru hold 19.8% of LATAM's estimated Instagram users but 8.7% of profiles with 10,000+ followers, while Brazil, Argentina, Colombia and Chile hold 64.0% and 80.9%. [1]

Brazil's share of LATAM creator supply could fall to about 54% by 2029. Since 2023, Brazil's reported count has fallen 15.6% while the rest of the region grew by about 39%, cutting its share from about 76% to 66.2%; Mexico grew fastest (+54.6%). This is a mechanical extrapolation of the 2023–2026 trends, not a forecast (section 15). [1, 6]

Taken together, the findings point to one rule for LATAM planning: treat the region as a set of distinct markets, not a single pool. Brazil's scale makes it the natural first source of creators, but it also sets every regional average, so benchmark each market on its own figures. Use audience data to decide where to reach people and supply data to decide where to recruit; Mexico, with the region's second-largest audience and below-average creator density, needs longer sourcing, wider screening and localised, compliant content. Build depth in the micro tier, treat mega creators as a scarce and concentrated resource, and check classification coverage before setting gender or niche targets. [1, 12]

Five ways to use these findings

  • Benchmark by market. Quote Brazil-included and Brazil-excluded figures side by side; Brazil alone lifts regional density from 3.42% to 5.69%.
  • Separate reach from recruitment. Mexico and Peru hold 19.8% of users but 8.7% of profiles with 10,000+ followers.
  • Build depth below 100,000 followers. Nano and micro creators are 98.6% of the pool and recorded the highest engagement in Influencity's supplements study.
  • Check classification before setting quotas. A quarter of profiles have no gender classification, rising to 41.3% in Chile.
  • Test TikTok outside Brazil. TikTok has the larger creator pool in 16 of 20 markets.

02 → MARKET SIZE AND DEFINITIONS

How large is the Latin American Instagram influencer market?

Latin America's 20 covered markets hold 18,412,413 influencer-eligible Instagram profiles, measured against 323.5M estimated Instagram users and a population reference of 651.7M. That is one eligible profile for every 17.6 estimated users and 28.3 profiles per 1,000 residents, the highest ratio of Influencity's three 2026 regional Instagram studies. Of those profiles, 2.19M have 10,000 or more followers. The figures describe different units and should not be treated as interchangeable measures of reach. [1, 3, 4]

Metric

2026 value

Interpretation

Population reference

651,708,684

Sum of the 20 market population fields

Estimated Instagram users

323,500,000

Dataset audience estimate

Influencer-eligible profiles

18,412,413

Recorded eligible accounts, not unique people

Creator density

5.69%

Eligible profiles / estimated Instagram users

Estimated users per eligible profile

17.6

The inverse of creator density

Users / population

49.64%

Contextual audience-penetration ratio

Profiles / population

2.83%

A different denominator from creator density

Profiles per 1,000 residents

28.3

US 26.2; Europe 18.5; LATAM excluding Brazil 14.3

Female share, classified

61.18%

Female / (female + male)

No-gender share, all profiles

25.44%

Unclassified / headline profiles

Not assigned to a tier

30,466

0.17% of eligible profiles; no follower tier in the source data

Profiles with 10,000+ followers

2,185,146

Micro, macro and mega tiers; 11.87% of eligible profiles

Profiles with 100,000+ followers

219,504

Macro and mega tiers; 1.19% of eligible profiles

Source: [1], summed across the 20 market rows; US and Europe ratios from [3, 4].

Four questions, four metrics

How many profiles could be screened? Start with eligible creator supply, the recorded search universe before audience, activity, category, availability and quality filters.

How dense is that supply? Divide eligible profiles by estimated platform users; 5.69% means about 5.69 eligible accounts per 100 estimated users, not that 5.69% of people are professional influencers.

How large is the audience relative to population? Divide estimated users by the population reference; coverage, age, timing and estimation methods limit its interpretation as adoption.

How much of that supply has reach? Filter by follower tier. 2,185,146 profiles (11.9%) have 10,000 or more followers and 219,504 (1.2%) have 100,000 or more. A brief that needs creators above 10,000 followers starts from that smaller pool, not from the full 18.41M.

From population to creator pool: how each layer narrows

Each layer of the market is a fraction of the one above. The population reference of 651.7M narrows to 323.5M estimated Instagram users (49.6%), then to 18.41M eligible profiles (5.69% of users). Only 11.9% of eligible profiles have 10,000 or more followers, a tenth of those have 100,000 or more, and 12,896 profiles (0.07% of the pool) have 1 million or more. [1]
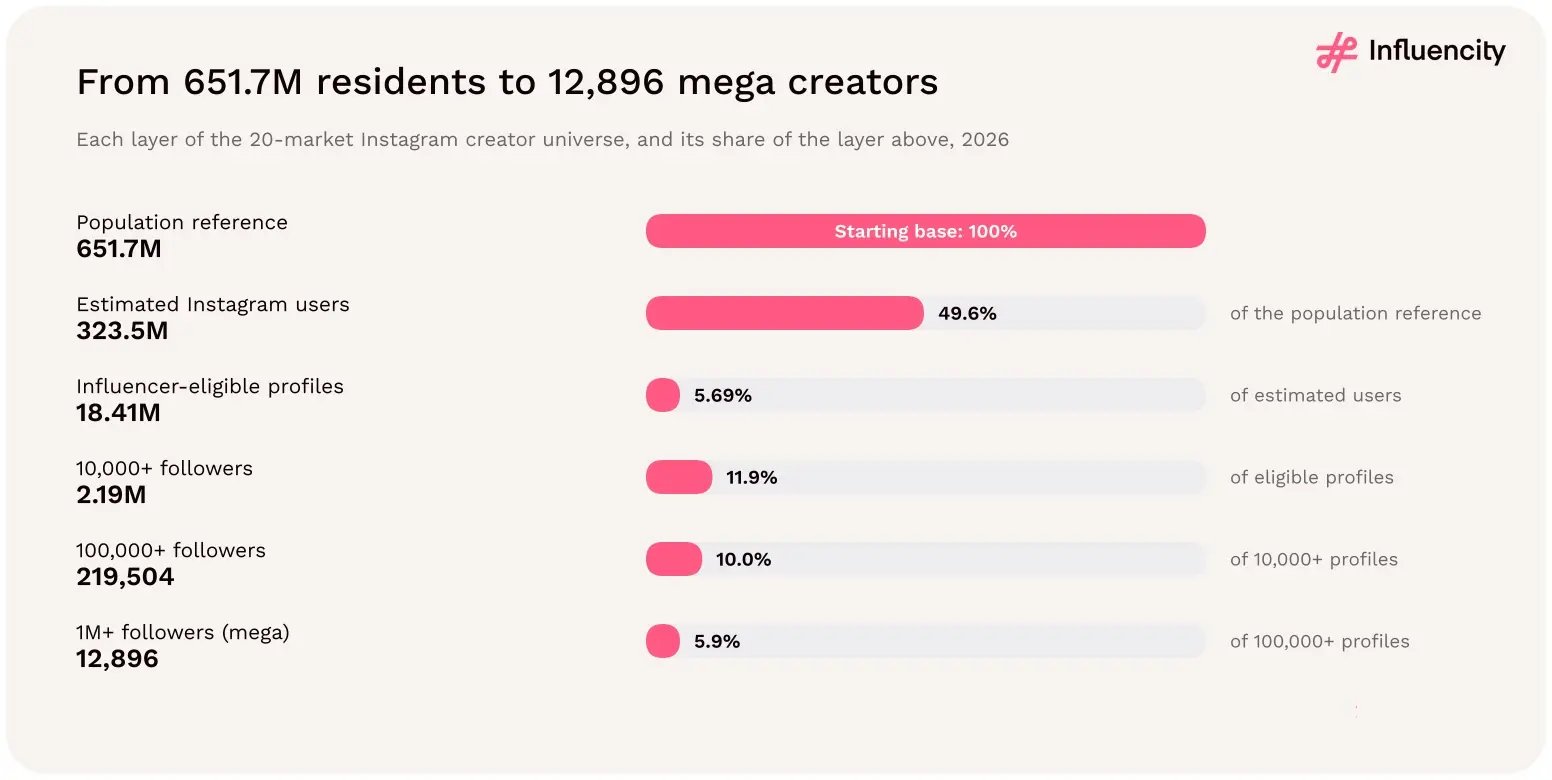
Funnel of the 20-market LATAM Instagram universe in 2026, from 651.7 million residents and 323.5 million estimated users to 18.41 million eligible profiles and 12,896 mega creators.

Figure 06 → Population reference, estimated users, eligible profiles and follower-tier pools for the 20-market footprint, with each layer's share of the layer above. Source: [1].

Layer

2026 count

Share of layer above

Per 1,000 residents

Population reference

651,708,684

Base

1,000

Estimated Instagram users

323,500,000

49.6%

496.4

Influencer-eligible profiles

18,412,413

5.69%

28.3

Profiles with 10,000+ followers

2,185,146

11.9%

3.35

Profiles with 100,000+ followers

219,504

10.0%

0.34

Profiles with 1 million+ followers

12,896

5.9%

0.02

Source: [1]. 10,000+ = micro, macro and mega tiers; 100,000+ = macro and mega. The 30,466 profiles without a tier are excluded from the tier layers.

Brazil holds a third of residents but two-thirds of creators

Brazil's share rises at every step from population to creator supply: 33.3% of the population reference, 43.7% of estimated users and 66.2% of eligible profiles. Mexico moves the other way, from 20.2% of the population to 16.6% of users and 5.6% of profiles. Brazil records one eligible profile for every 11.6 estimated users; Mexico one for every 51.7. [1]

The pattern eases among larger creators. Brazil holds 61.5% of profiles with 10,000 or more followers, below its 66.2% share of all profiles, because 13.5% of eligible profiles outside Brazil sit above 10,000 followers, against 11.0% in Brazil. Colombia (16.7%), Peru (16.2%) and Venezuela (15.5%) have the highest shares. Pools outside Brazil are smaller and also less concentrated in the nano tier. [1]
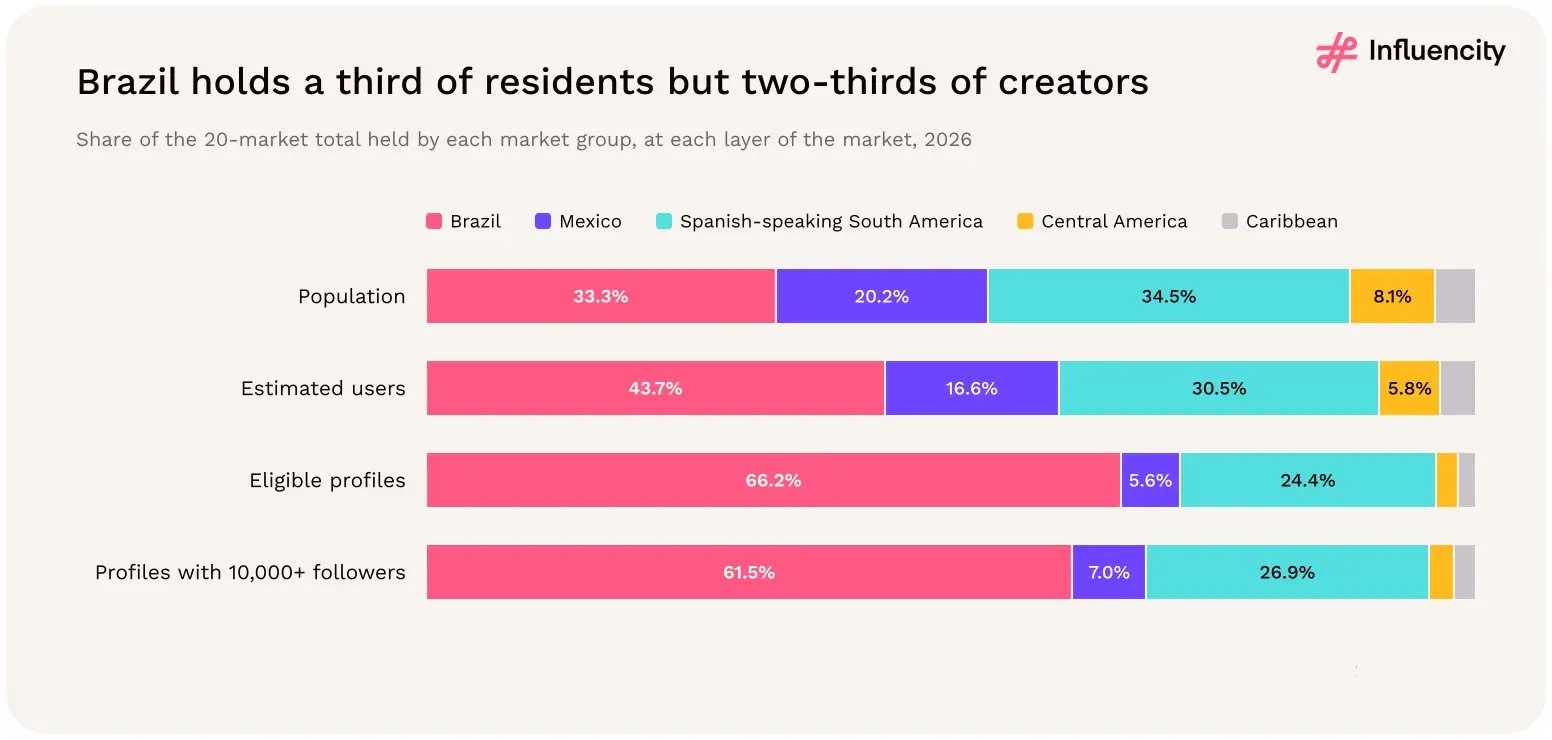
Brazil holds a third of the 20-market population (33.3%) but two-thirds of eligible Instagram profiles (66.2%) and 61.5% of profiles with 10,000+ followers in 2026.

Figure 07 → Share of the 20-market total held by each market group at four layers: population reference, estimated users, eligible profiles and profiles with 10,000+ followers. Source: [1].
Market group

Share of population

Share of users

Share of profiles

Creator density

Profiles per 1,000 residents

Brazil

33.3%

43.7%

66.2%

8.62%

56.2

Mexico

20.2%

16.6%

5.6%

1.94%

7.9

Spanish-speaking South America (9)

34.5%

30.5%

24.4%

4.55%

20.0

Central America (6)

8.1%

5.8%

2.1%

2.04%

7.3

Caribbean (3)

3.9%

3.4%

1.7%

2.89%

12.3

All 20 markets

100.0%

100.0%

100.0%

5.69%

28.3

Source: [1]. Spanish-speaking South America: Argentina, Bolivia, Chile, Colombia, Ecuador, Paraguay, Peru, Uruguay and Venezuela. Central America: Costa Rica, El Salvador, Guatemala, Honduras, Nicaragua and Panama. Caribbean: Cuba, Dominican Republic and Puerto Rico.

Three markets hold 82% of creator supply

Market size falls into three bands. Brazil, Argentina and Mexico each record more than 1 million eligible profiles and together hold 82.1% of supply. Nine markets record between 100,000 and 1 million. The other eight record fewer than 100,000 each: together they hold 11.5% of the population reference but 1.9% of eligible profiles. The median market has 143,603 profiles. [1]

Size band (eligible profiles)

Markets

Share of profiles

Share of users

Share of population

1 million or more

Brazil, Argentina, Mexico

82.1%

69.9%

60.8%

100,000 to 1 million

Colombia, Chile, Venezuela, Dominican Republic, Peru, Ecuador, Paraguay, Panama, Uruguay

16.0%

23.1%

27.7%

Under 100,000

Costa Rica, Guatemala, Honduras, El Salvador, Puerto Rico, Bolivia, Nicaragua, Cuba

1.9%

7.0%

11.5%

Source: [1], Appendix A.

What this means for market sizing

  • Size the pool at the tier you will recruit. A brief for creators with 10,000+ followers starts from 2.19M profiles, not 18.41M. In Mexico that pool is 153,483 profiles; across the six Central American markets it is 52,422.
  • Report the denominator with every ratio. 5.69% (profiles per estimated user), 2.83% (profiles per resident) and 49.6% (users per resident) answer different questions and should not be swapped.
  • Check roster depth in small markets early. In the eight markets under 100,000 profiles, niche, tier and audience filters can leave few candidates; Cuba (16,235) and Nicaragua (20,582) have the smallest pools.

03 → CREATOR SUPPLY

Which LATAM markets have the most Instagram influencers?

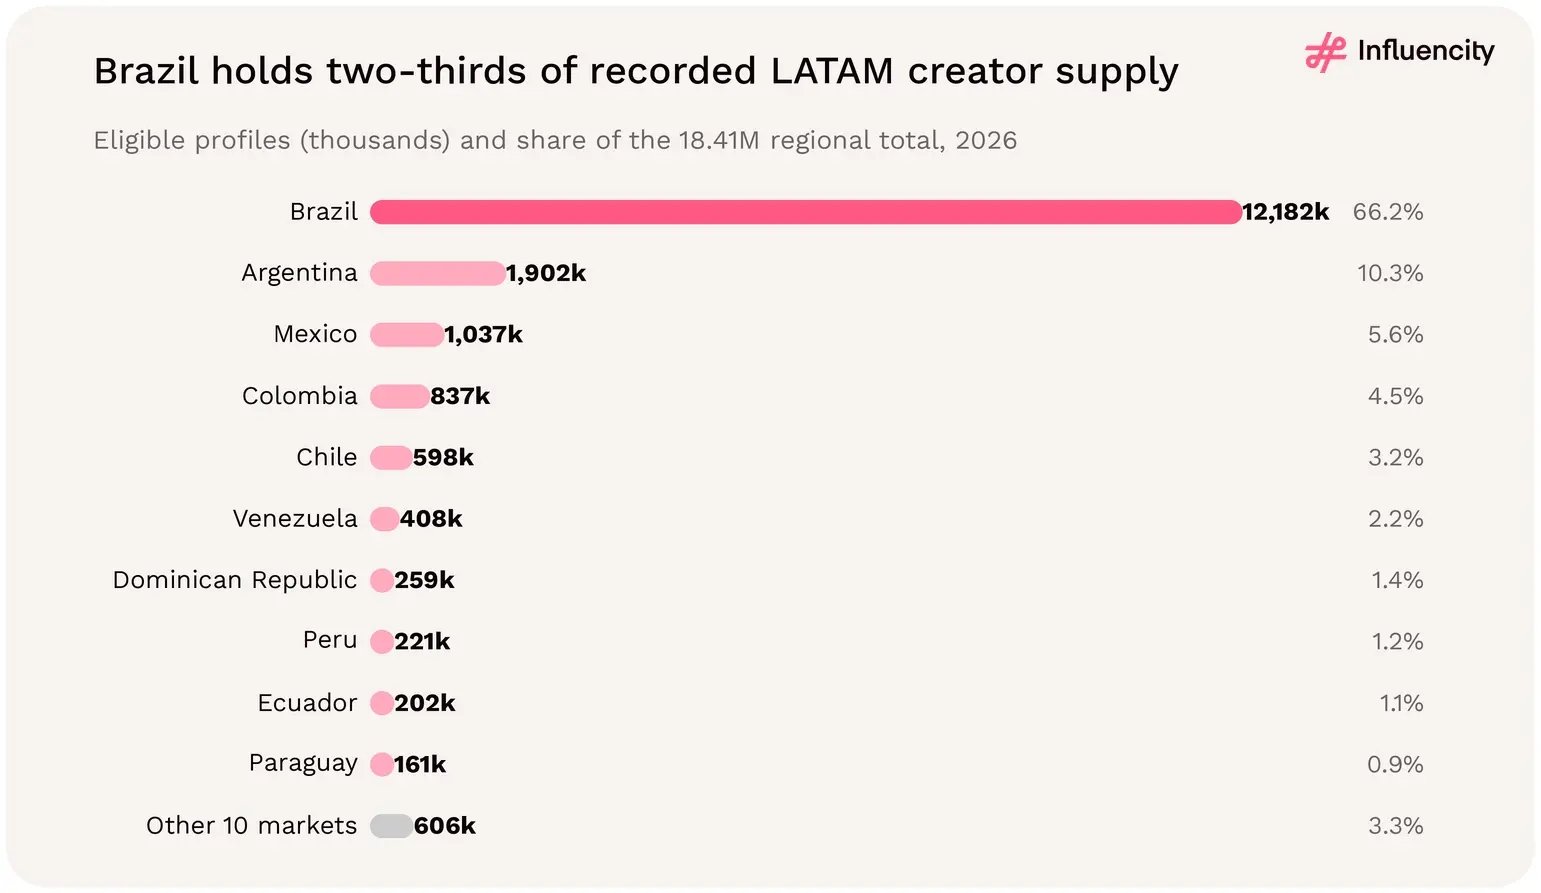
Brazil ranks first, followed by Argentina and Mexico. These three markets contain 82.1% of recorded eligible profiles. Colombia and Chile take the top-five concentration to 89.9%. Large supply can broaden a search, but creator location does not establish where followers live. [1]

Creator supply at a glance

  • Two markets hold three-quarters of supply. Brazil (12,182,215) and Argentina (1,901,646) account for 76.5% of the 18,412,413 eligible Instagram profiles recorded across the 20 covered LATAM markets in 2026. [1]
  • Argentina outranks Mexico on supply, not audience. Argentina records 1.83 times as many eligible profiles as Mexico, although its estimated Instagram audience (31.1M) is 0.58 times Mexico's (53.6M). [1]
  • Outside Brazil, four markets hold 70.2% of supply. Argentina, Mexico, Colombia and Chile account for 4,373,762 of the 6,230,198 eligible profiles recorded in the other 19 markets. [1]
  • Top-tier depth follows a different order. Colombia (19.8), Mexico (18.6) and Peru (18.0) have the most macro and mega profiles per 1,000 eligible profiles among markets with at least 100,000 profiles; the 20-market benchmark is 11.9. [1]
  • Pool sizes vary by a factor of 750. Twelve markets record more than 100,000 eligible profiles; six record fewer than 50,000, from Bolivia (38,548) to Cuba (16,235). [1]

Rank

Market

Eligible profiles

Share of total

Estimated users

1

Brazil

12,182,215

66.2%

141.40M

2

Argentina

1,901,646

10.3%

31.10M

3

Mexico

1,037,320

5.6%

53.60M

4

Colombia

837,150

4.5%

20.90M

5

Chile

597,646

3.2%

13.50M

6

Venezuela

407,690

2.2%

9.00M

7

Dominican Republic

259,163

1.4%

6.50M

8

Peru

221,329

1.2%

10.30M

9

Ecuador

201,586

1.1%

6.70M

10

Paraguay

161,006

0.9%

2.60M

Brazil leads LATAM's eligible Instagram profiles in 2026 with 12.18 million (66.2% of the 18.41 million total), followed by Argentina (1.90 million) and Mexico (1.04 million).

Figure 08 → Largest Instagram creator markets by eligible profile count, 2026, with the other ten markets combined. Source: [1].

How concentrated is Instagram creator supply in Latin America?

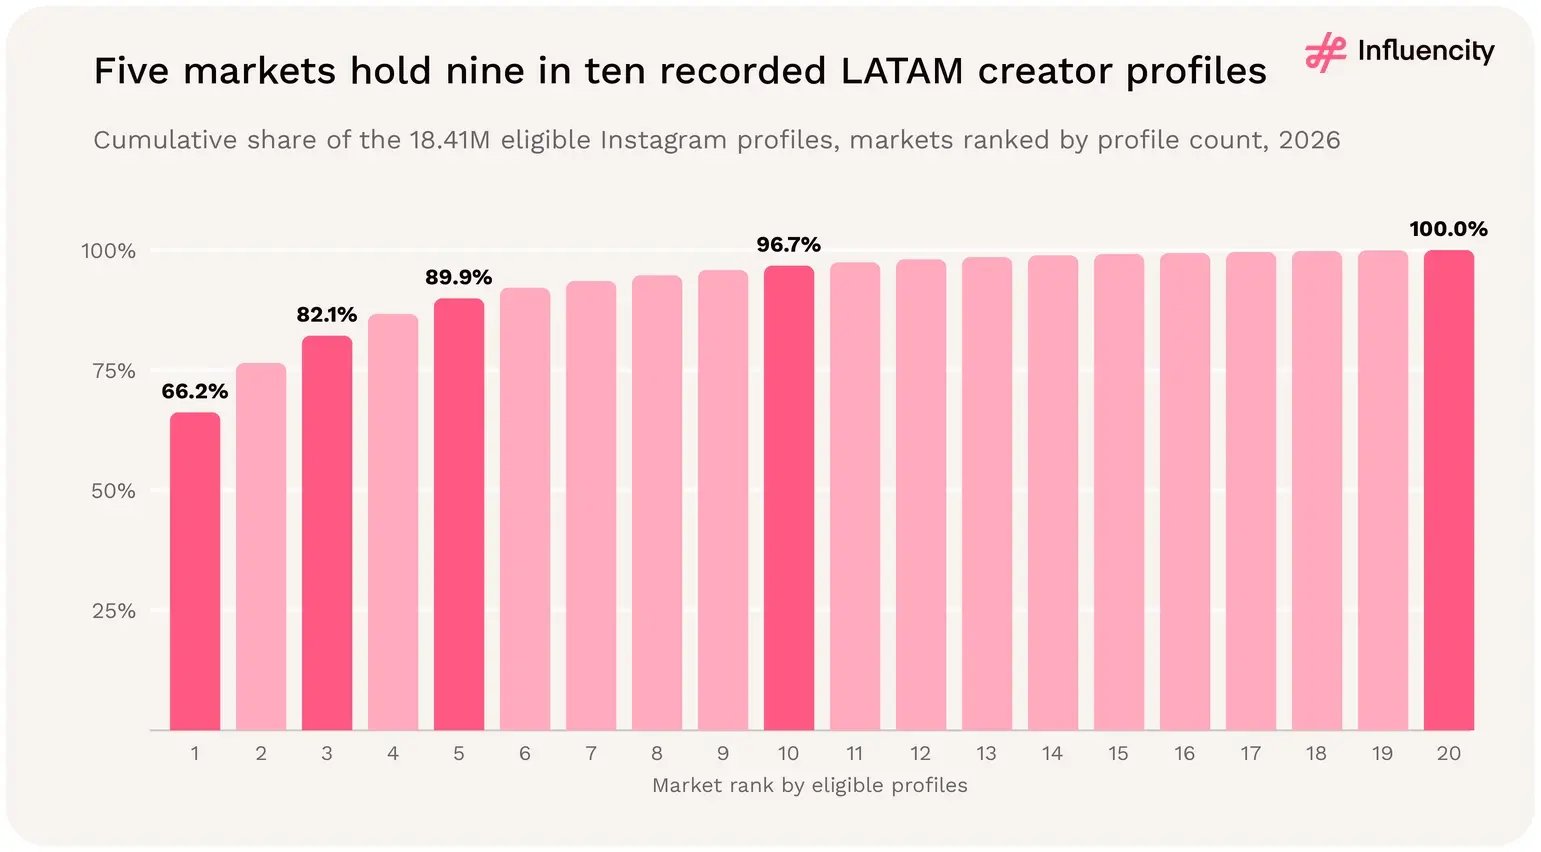
Highly concentrated. Brazil alone holds 66.2% of the 18,412,413 eligible Instagram profiles in Influencity's 2026 LATAM dataset. The top three markets hold 82.1%, the top five 89.9% and the top ten 96.7%; the ten smallest markets hold 605,662 profiles combined, or 3.3%. [1]

A standard concentration measure confirms the pattern. The Herfindahl-Hirschman index (HHI), the sum of squared percentage shares on a scale up to 10,000, is 4,559 for creator supply across the 20 markets. Excluding Brazil, it falls to 1,584: supply in the other 19 markets is spread far more evenly, with Argentina the largest but not a dominant contributor. [1]
Market group

Markets

Eligible profiles

Share of 18.41M total

Brazil

1

12,182,215

66.2%

Top three (+ Argentina, Mexico)

3

15,121,181

82.1%

Top five (+ Colombia, Chile)

5

16,555,977

89.9%

Top ten

10

17,806,751

96.7%

Markets ranked 11–20

10

605,662

3.3%

All 20 markets

20

18,412,413

100.0%

Source: [1]. Markets ranked by eligible profiles; groups are cumulative except markets ranked 11–20.

Cumulative share of LATAM's 18.41 million eligible Instagram profiles by market rank in 2026: the top market holds 66.2%, the top three 82.1% and the top five 89.9%.

Figure 09 → Cumulative share of eligible LATAM Instagram profiles as markets are added in rank order, 2026. Source: [1].

Which markets lead Instagram creator supply outside Brazil?

Argentina. Its 1,901,646 eligible profiles are 30.5% of the 6,230,198 recorded in the 19 markets outside Brazil, followed by Mexico (16.6%), Colombia (13.4%) and Chile (9.6%). Together, these four markets hold 70.2% of non-Brazil supply. [1]

Supply rank and audience rank diverge. Mexico has the footprint's second-largest estimated Instagram audience (53.6M of 323.5M) but ranks third for eligible profiles, while Argentina, with 31.1M estimated users, records 1.83 times Mexico's profile count. Audience size is therefore not a reliable proxy for the number of creators available to screen in a market. [1]

Relative to population, Argentina records 40.1 eligible profiles per 1,000 residents and Uruguay 37.1, compared with 7.9 in Mexico, 28.3 across the 20 markets and 14.3 across the 19 markets outside Brazil. These ratios use the dataset's population reference; they are not adoption rates. [1]

Which LATAM markets have the deepest macro and mega creator pools?

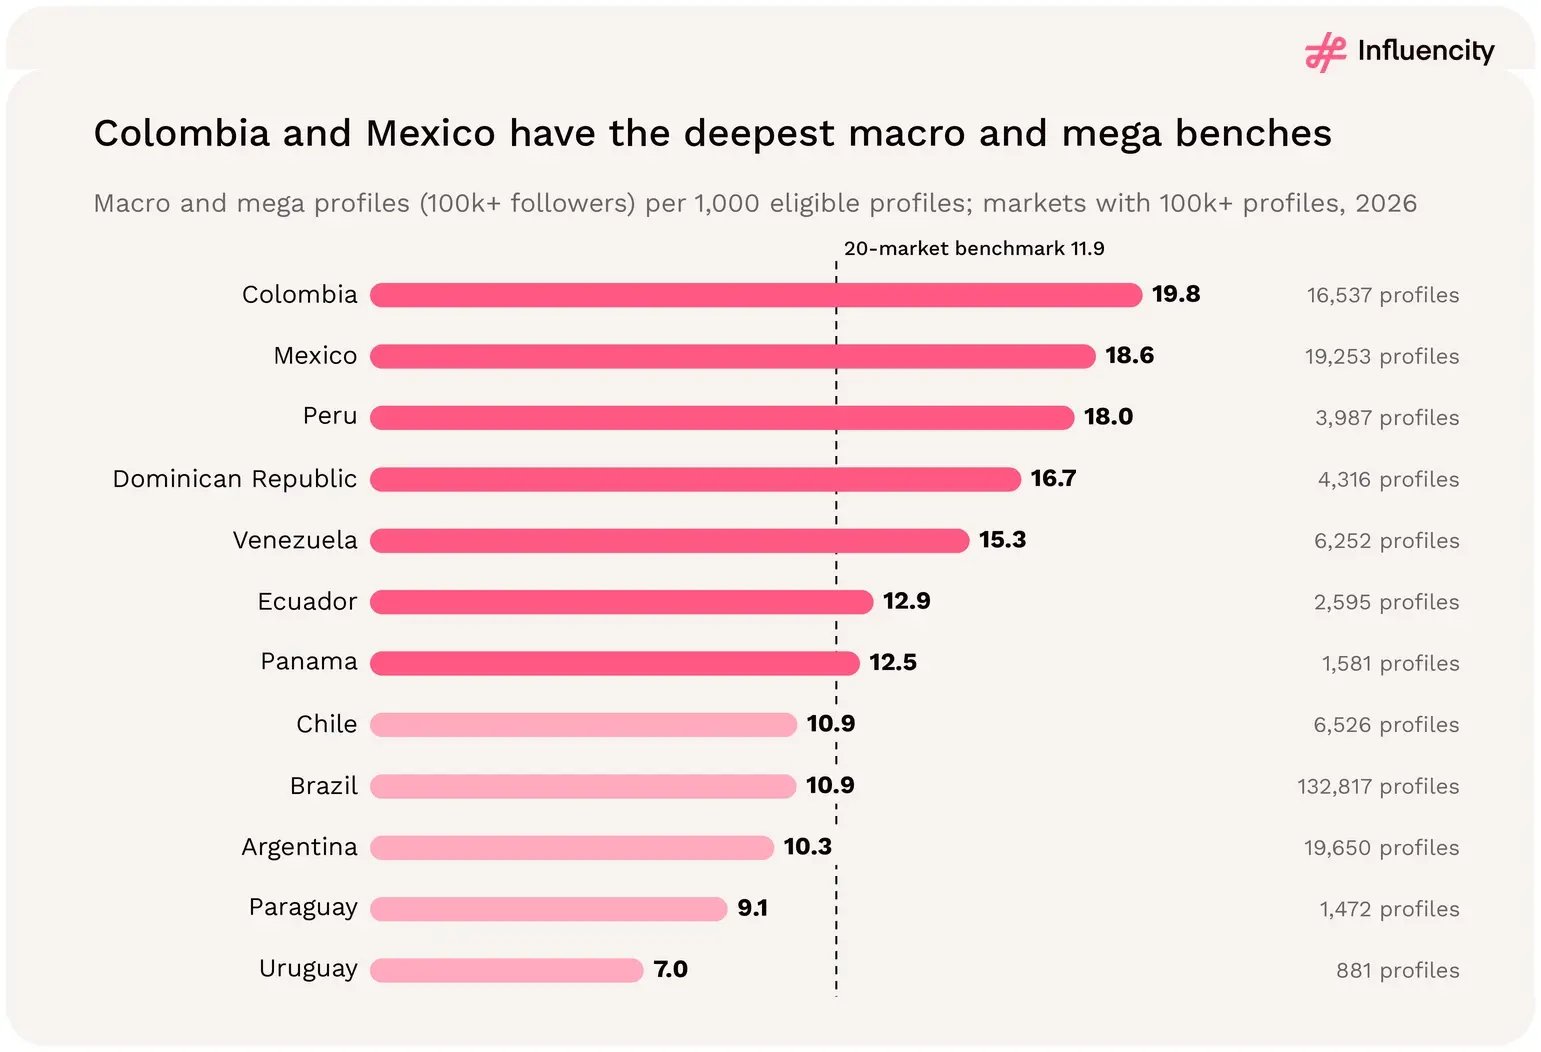
By count, Brazil: it records 132,817 macro and mega profiles (100,000+ followers), 60.5% of the 219,504 in the region. Relative to pool size, Colombia leads with 19.8 macro and mega profiles per 1,000 eligible profiles, followed by Mexico (18.6) and Peru (18.0), among the twelve markets with at least 100,000 eligible profiles. The 20-market benchmark is 11.9. [1]

Mexico's top tier is larger than its overall rank suggests. It holds 16.6% of non-Brazil eligible profiles but 31.7% of non-Brazil mega profiles: its 1,374 mega profiles exceed Argentina's 908, although Argentina's total pool is 1.83 times larger. Colombia's 891 mega profiles almost match Argentina's from 44.0% of Argentina's profile base. [1]

Argentina (10.3) and Brazil (10.9) sit below the benchmark, so their recorded supply is weighted more heavily towards nano and micro profiles than the regional average; Brazil still has by far the largest absolute pools in every tier. These ratios describe recorded follower bands only, not reach quality, engagement or cost. [1]
Market

Eligible profiles

Share of non-Brazil supply

Profiles per 1,000 residents

Macro + mega profiles

Macro + mega per 1,000 profiles

Brazil

12,182,215

–

56.2

132,817

10.9

Argentina

1,901,646

30.5%

40.1

19,650

10.3

Mexico

1,037,320

16.6%

7.9

19,253

18.6

Colombia

837,150

13.4%

15.7

16,537

19.8

Chile

597,646

9.6%

30.2

6,526

10.9

Venezuela

407,690

6.5%

14.1

6,252

15.3

Dominican Republic

259,163

4.2%

22.4

4,316

16.7

Peru

221,329

3.6%

6.5

3,987

18.0

Ecuador

201,586

3.2%

11.1

2,595

12.9

Paraguay

161,006

2.6%

23.4

1,472

9.1

All 20 markets

18,412,413

–

28.3

219,504

11.9

Source: [1]. Macro: 100,000–1 million followers; mega: 1 million+. Per-1,000 ratios use all eligible profiles in each market as the denominator; residents use the dataset's population reference.

Colombia (19.8) and Mexico (18.6) have the most macro and mega profiles per 1,000 eligible profiles among LATAM markets with 100k+ profiles, against a 20-market benchmark of 11.9.

Figure 10 → Macro and mega profiles per 1,000 eligible profiles in the twelve markets with at least 100,000 eligible profiles, with the 20-market benchmark, 2026. Source: [1].

Concentration is not the same as a budget recommendation

A supply-weighted roster would be dominated by Brazil. A brand serving several markets may need a different allocation, driven by customers, distribution, audience geography and commercial goals. The bottom ten markets contain 3.3% of recorded supply in aggregate; that does not make them commercially unimportant, but country-specific recruitment needs should be evaluated against a smaller recorded pool. [1]
How should brands use creator-supply data when planning a LATAM influencer roster?

  • Set the market list first, then size the pool. Decide which countries the programme must serve, then use each market's recorded supply to set shortlist targets. A supply-weighted plan would place two in three creators in Brazil. [1]
  • Check the top of the ladder separately. When a brief needs macro or mega creators, compare those pools directly: Mexico and Colombia offer more top-tier profiles relative to pool size than Argentina, despite smaller overall supply. [1]
  • Confirm where followers live. Creator location does not establish audience location. In markets that share a language, audience-country data should confirm that a creator reaches the intended market before contracting.

Latin America's recorded Instagram creator supply is broad but uneven: one market holds two-thirds of eligible profiles, five hold nine in ten, and the ranking changes when the question shifts from total supply to audience size or top-tier depth. Use supply as a measure of search capacity, then combine it with audience location, category fit and campaign evidence before setting market budgets. [1]

04 → THE BRAZIL EFFECT

How much does Brazil shape the regional picture?

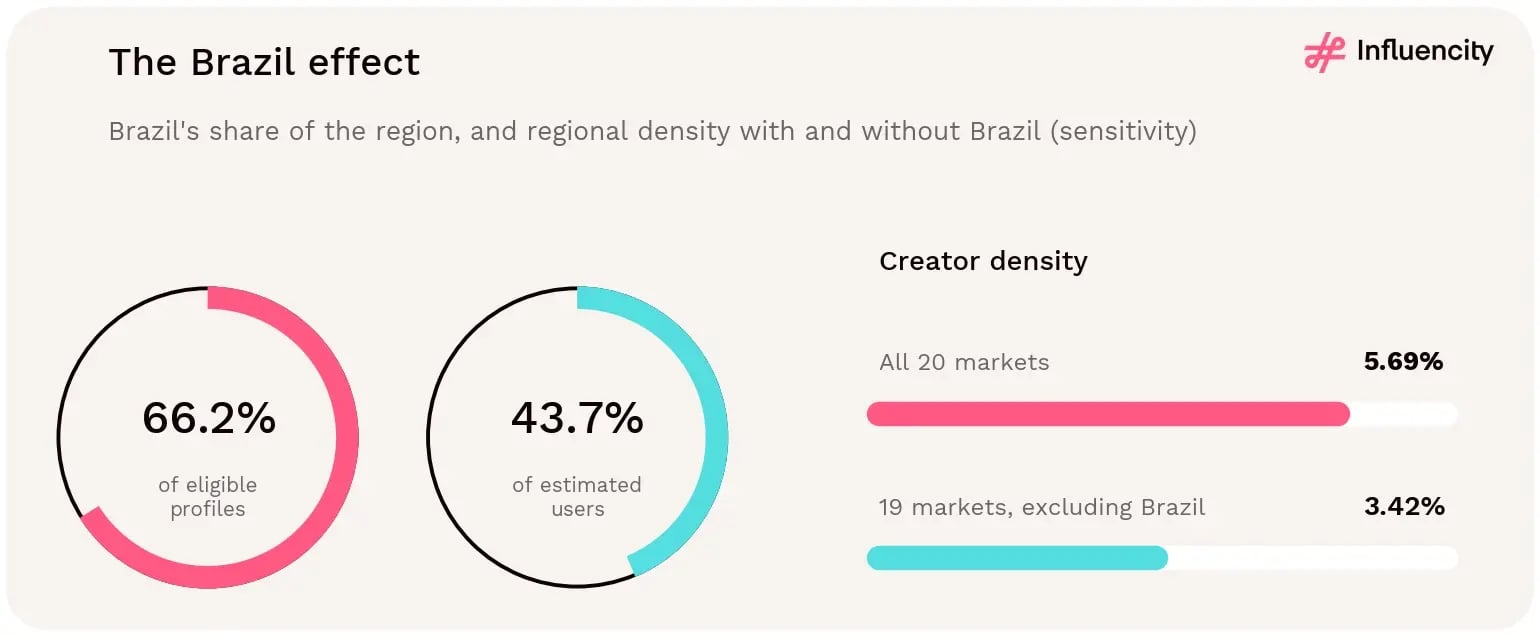
Brazil shapes almost every regional benchmark in this study. It holds 66.2% of eligible profiles (12,182,215) from 43.7% of estimated users and 33.3% of the population reference, and its pool alone is 1.96 times the 6.23M profiles recorded across the other 19 markets. Its 8.62% creator density is well above both the full-region 5.69% ratio and the 3.42% ratio outside Brazil. [1]

Measure

All 20 markets

Brazil

Other 19 markets

Eligible profiles

18,412,413

12,182,215

6,230,198

Estimated users

323.50M

141.40M

182.10M

Share of eligible profiles

100.0%

66.2%

33.8%

Share of estimated users

100.0%

43.7%

56.3%

Share of population reference

100.0%

33.3%

66.7%

Creator density

5.69%

8.62%

3.42%

Users / population

49.6%

65.3%

41.9%

Female share, classified

61.2%

62.1%

59.1%

Profiles per 1,000 residents

28.3

56.2

14.3

Share with 10,000+ followers

11.9%

11.0%

13.5%

Macro + mega per 1,000 profiles

11.9

10.9

13.9

Mega profiles (1M+ followers)

12,896

8,563

4,333

Unclassified share, all profiles

25.4%

22.1%

31.9%

Source: [1]. The 19-market subset excludes Brazil. Its ratios are recalculated from summed components, not averaged across markets.

Brazil holds 66.2% of LATAM's eligible Instagram profiles but 43.7% of estimated users; regional creator density falls from 5.69% across all 20 markets to 3.42% without Brazil.

Figure 11 → Brazil has a larger share of creator supply than of the estimated regional audience. Source: [1].

Use the right reference group

For a programme excluding Brazil, the full regional ratio is a poor standalone benchmark. Rebuild the comparison around the markets in scope; the other 19 still represent 182.1M estimated users. For a Brazil-inclusive programme, use separate market reporting and locally reviewed, Portuguese-language creative. The same footprint effect exists in Europe, where removing Russia moves density only from 4.21% to 4.13%; Brazil's effect on LATAM is far larger. [1, 9]

Brazil alone rivals Europe's creator pool

Brazil records more influencer-eligible Instagram profiles than all 50 US states combined: 12.18M against 8.94M, or 1.36 times the US pool. It also reaches 98% of the 12.41M profiles recorded across Influencity's 30 European markets, from a population reference about a third the size (216.7M against 670.2M). Per 1,000 residents, Brazil records 56.2 profiles, roughly twice the US (26.2) and three times Europe (18.5). [1, 3, 4]

The rest of the footprint looks very different. The other 19 markets together record 6.23M profiles and 14.3 per 1,000 residents, below both the US and Europe, even though their combined population reference (435.0M) is twice Brazil's. [1, 3, 4]
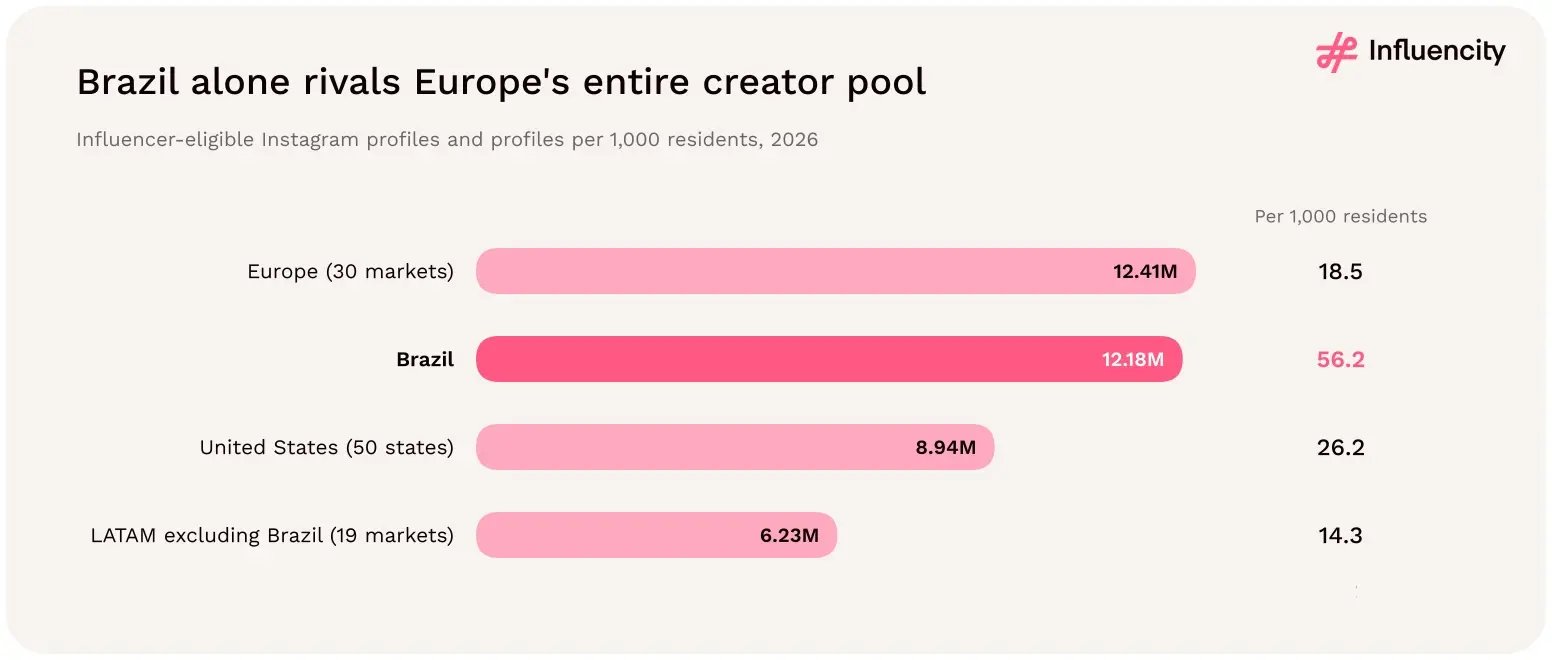
Brazil's 12.18 million eligible Instagram profiles nearly match Europe's 12.41 million and exceed the US (8.94 million), with 56.2 profiles per 1,000 residents against 18.5 in Europe.

Figure 12 → Influencer-eligible Instagram profiles and profiles per 1,000 residents for Brazil, the other 19 LATAM markets, the US (50 states) and Europe (30 markets), 2026. Sources: [1, 3, 4].

How much does removing Brazil change each benchmark?

Removing Brazil does not move every benchmark in the same direction. Creator density falls from 5.69% to 3.42%, profiles per 1,000 residents halve from 28.3 to 14.3 and the audience-to-population ratio drops from 49.6% to 41.9%. Three measures rise instead: the share of profiles with 10,000+ followers (11.9% to 13.5%), macro and mega profiles per 1,000 eligible profiles (11.9 to 13.9) and the unclassified share (25.4% to 31.9%). [1]

Brazil's pool is large and slightly more nano-heavy than the rest: 88.8% of its eligible profiles are nano, against 86.4% in the other 19 markets. Tier-mix and classification benchmarks should therefore be set separately for Brazil and for Spanish-speaking LATAM, not inherited from the 20-market average. [1]
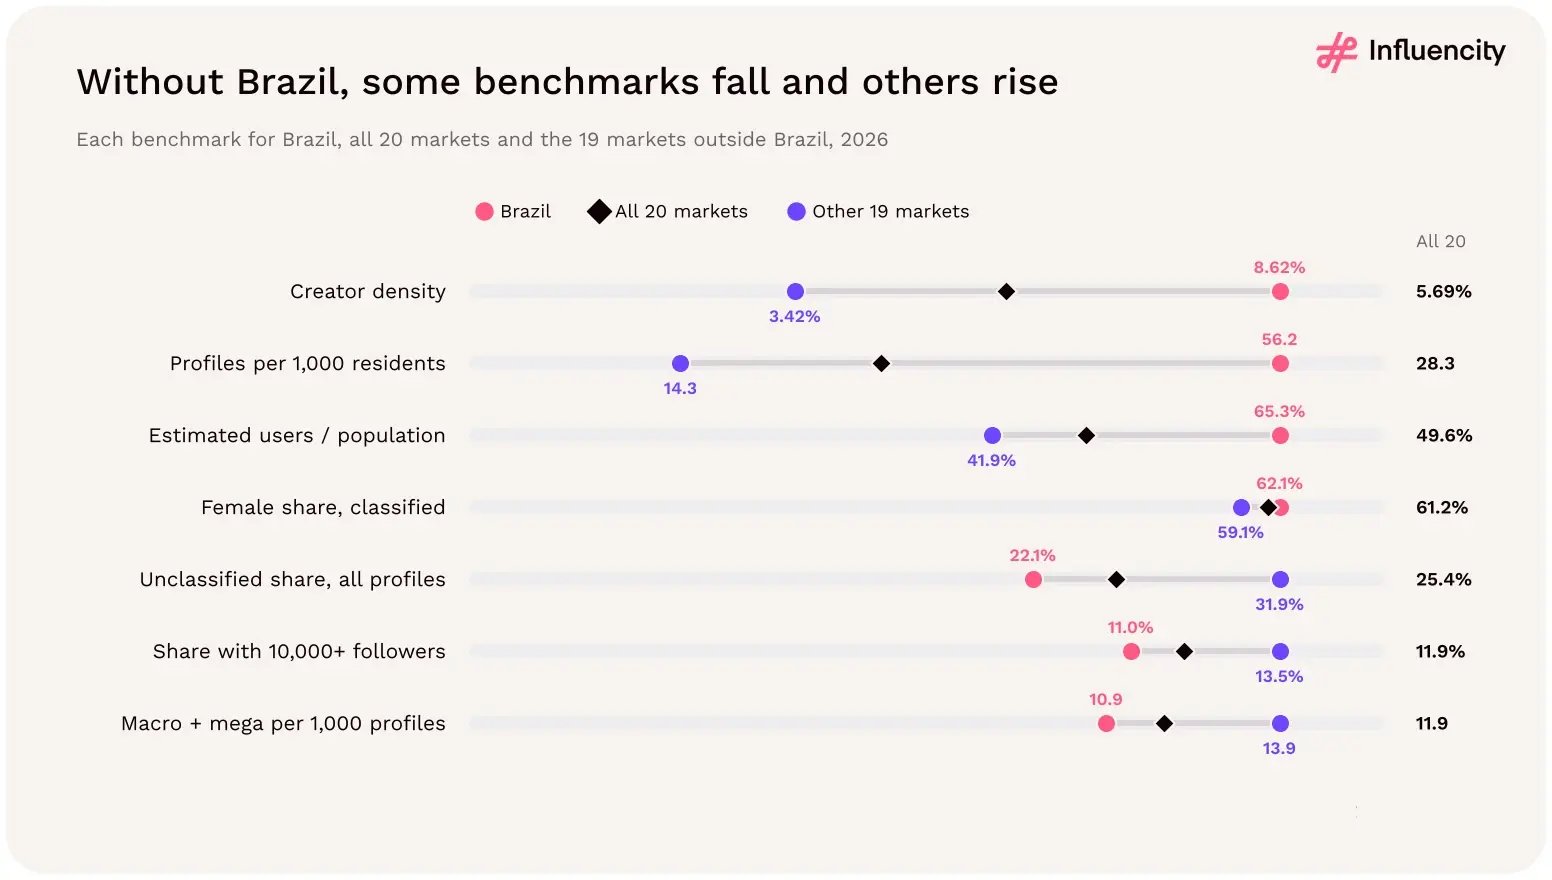
Seven benchmarks for Brazil, all 20 LATAM markets and the other 19 markets in 2026: creator density is 8.62% in Brazil, 5.69% overall and 3.42% outside Brazil.

Figure 13 → Seven benchmarks for Brazil, all 20 markets and the 19 markets outside Brazil, 2026. Each row uses its own scale. Source: [1].

Where Brazil's weight is greatest

Brazil's share of the regional pool varies by measure. It holds 66.8% of nano profiles and 66.4% of mega profiles, but a smaller 61.7% of micro and 60.1% of macro profiles. Its 8,563 mega profiles are 6.2 times Mexico's 1,374 and almost twice the 4,333 recorded across all other markets combined. [1]
Measure

Brazil

Other 19 markets

Brazil's share

Population reference

216.7M

435.0M

33.3%

Estimated Instagram users

141.4M

182.1M

43.7%

Eligible profiles

12,182,215

6,230,198

66.2%

Nano profiles

10,815,790

5,381,011

66.8%

Micro profiles

1,212,001

753,641

61.7%

Macro profiles

124,254

82,354

60.1%

Mega profiles

8,563

4,333

66.4%

Female-classified profiles

5,892,463

2,506,902

70.2%

Male-classified profiles

3,595,759

1,733,154

67.5%

Unclassified profiles

2,693,993

1,990,142

57.5%

Source: [1]. Tier rows use tier entries; 21,607 Brazilian and 8,859 other profiles are not assigned to a tier.

Brazil also differs on classification, platform and niche. A larger share of its pool carries a gender classification (77.9%, against 68.1% in the other 19 markets), and it holds 70.2% of all female-classified profiles in the footprint. In Brazil, Instagram creator density (8.62%) exceeds TikTok's (7.62%), which pulls TikTok's regional density edge down to 1.07 times (section 11). Its niche mix leans to beauty: 16.5% of Brazil's interest tags, against 12.7% in the other seven markets with niche data (section 10). [1, 2, 14]

What this means for Brazil-inclusive and Brazil-excluded programmes

  • Report Brazil as its own market. A blended 20-market figure is mostly a Brazilian figure: two in three eligible profiles and two in three mega profiles are in Brazil.
  • Rebase every benchmark when Brazil is out of scope. Use 3.42% creator density, 14.3 profiles per 1,000 residents and 13.5% of profiles above 10,000 followers for the other 19 markets.
  • Expect deeper top tiers relative to pool size outside Brazil. The other 19 markets record 13.9 macro and mega profiles per 1,000 eligible profiles, against 10.9 in Brazil.
  • Plan Portuguese-language production from the start. Brazil will usually be the largest single roster in a regional programme, so briefs, content review and disclosure checks need a Portuguese workflow.

05 → CREATOR-DENSITY OUTLIERS

Where is Instagram creator density highest in LATAM?

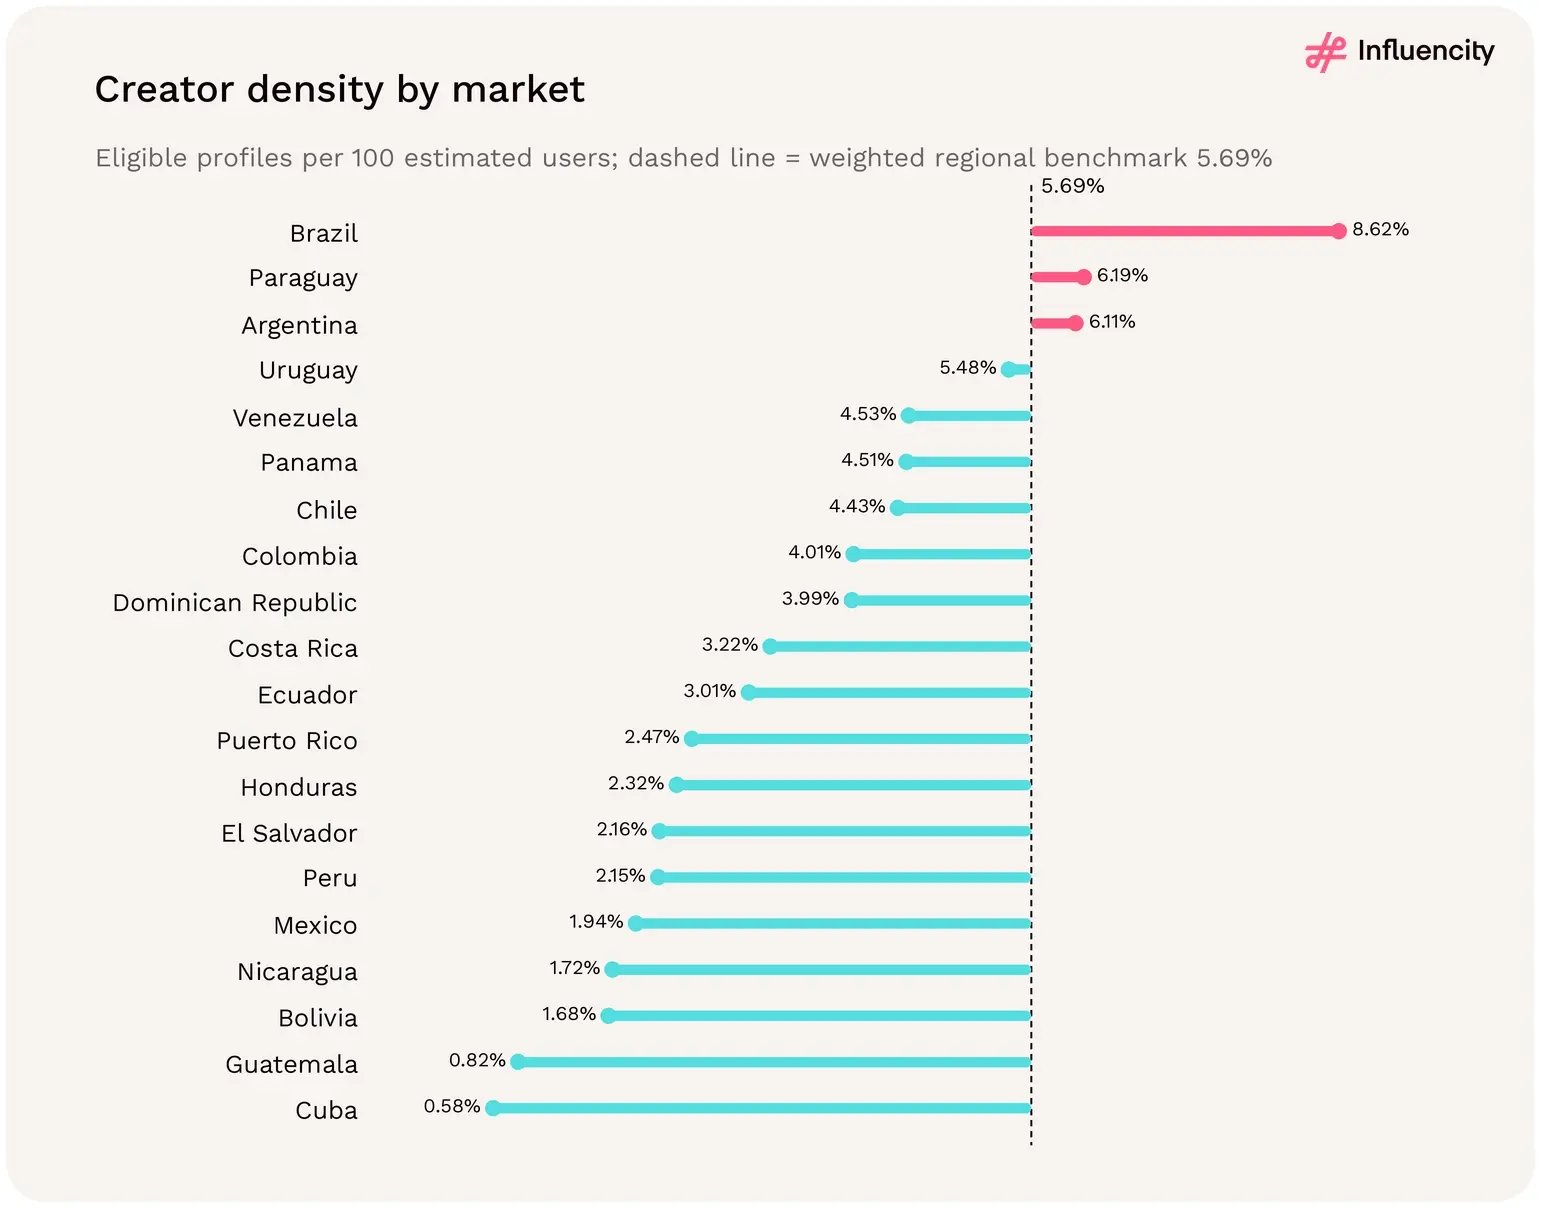
Brazil has the highest recorded creator density, at 8.62%. Paraguay ranks second at 6.19%, narrowly ahead of Argentina at 6.11%. Only these three markets exceed the weighted regional 5.69% benchmark; the unweighted market median is 3.11%. [1]

Creator density at a glance

  • The range is 14.9-fold. Creator density runs from 8.62% in Brazil to 0.58% in Cuba: one eligible profile for every 11.6 estimated users in Brazil, against one for every 172.5 in Cuba. [1]
  • Brazil pulls the benchmark up. The weighted regional density is 5.69%, but the typical market sits at 3.11% and the 19 markets outside Brazil at 3.42%. Only three of 20 markets clear 5.69%. [1]
  • Eight markets reach 4% or more. Brazil, Paraguay, Argentina, Uruguay, Venezuela, Panama, Chile and Colombia hold 88.7% of eligible profiles and 69.1% of estimated users. [1]
  • Five markets sit below 2%. Mexico, Nicaragua, Bolivia, Guatemala and Cuba hold 68.4M estimated users (21.1%) but only 6.4% of eligible profiles. [1]
  • The order shifts above 10,000 followers. Venezuela, Panama and Colombia move up the ranking, while Argentina and Uruguay move down, when only micro, macro and mega profiles are counted. [1]

Rank

Market

Creator density

Index vs LATAM

Eligible profiles

1

Brazil

8.62%

1.51x

12,182,215

2

Paraguay

6.19%

1.09x

161,006

3

Argentina

6.11%

1.07x

1,901,646

4

Uruguay

5.48%

0.96x

126,047

5

Venezuela

4.53%

0.80x

407,690

6

Panama

4.51%

0.79x

126,199

7

Chile

4.43%

0.78x

597,646

8

Colombia

4.01%

0.70x

837,150

Instagram creator density by LATAM market in 2026: only Brazil (8.62%), Paraguay (6.19%) and Argentina (6.11%) are above the 5.69% weighted regional benchmark; Cuba is lowest at 0.58%.

Figure 14 → Creator-density ranking across the covered LATAM markets, with the weighted regional benchmark. Source: [1].

How much does Instagram creator density vary across LATAM markets?

Widely. Brazil records one eligible profile for every 11.6 estimated Instagram users, Argentina one for every 16.4 and Colombia one for every 25.0. Mexico records one for every 51.7, Guatemala one for every 122.0 and Cuba one for every 172.5. [1]

The weighted 5.69% benchmark is not a typical market. Because Brazil holds 66.2% of profiles and 43.7% of users, it lifts the regional ratio well above the unweighted market median of 3.11%. Seventeen of the 20 markets fall below 5.69%, so a market-level comparison should use the median or a benchmark built from the markets in scope. [1]

Density band

Markets

Share of eligible profiles

Share of estimated users

Above the 5.69% benchmark

3

77.4%

54.1%

4.00% to 5.69%

5

11.4%

15.0%

2.00% to 3.99%

7

4.8%

9.7%

Below 2.00%

5

6.4%

21.1%

All 20 markets

20

100.0%

100.0%

Source: [1]. Creator density = eligible profiles / estimated Instagram users. Shares are of the 18,412,413 eligible profiles and 323.5M estimated users.

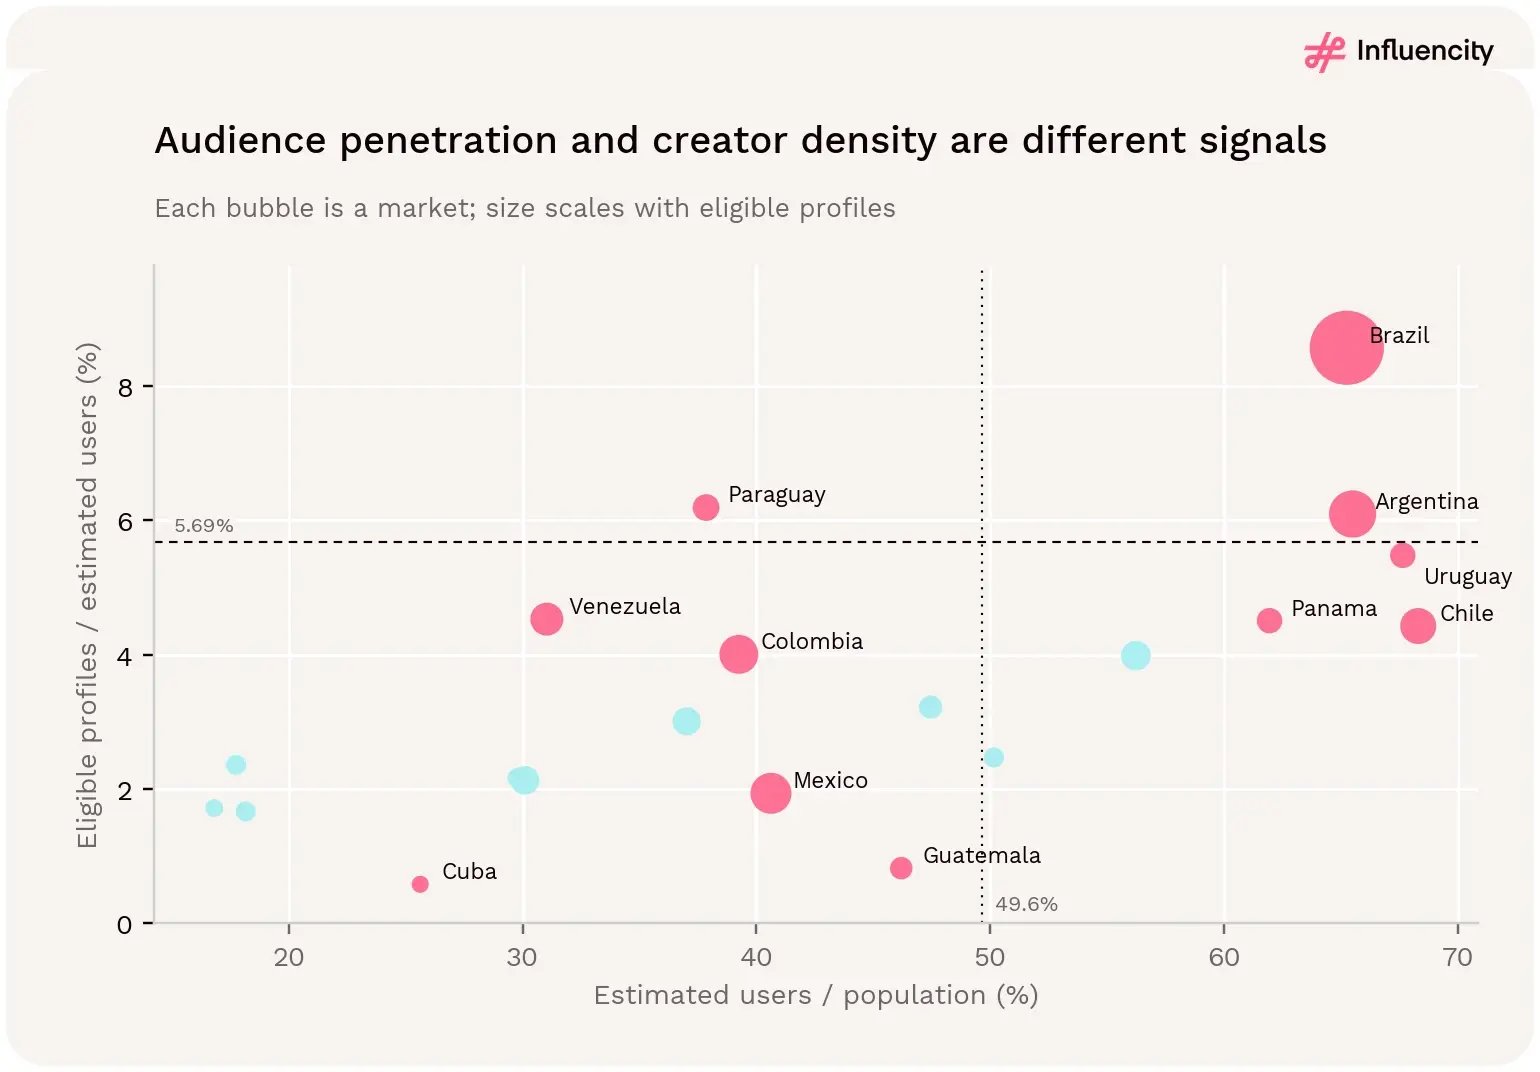
Density and audience size move independently. Mexico has the second-largest estimated audience in the footprint but the fifth-lowest density, while Paraguay and Uruguay, with fewer than 3M estimated users each, rank second and fourth. Argentina is the only market other than Brazil that combines an audience above 30M with density above the benchmark. [1]
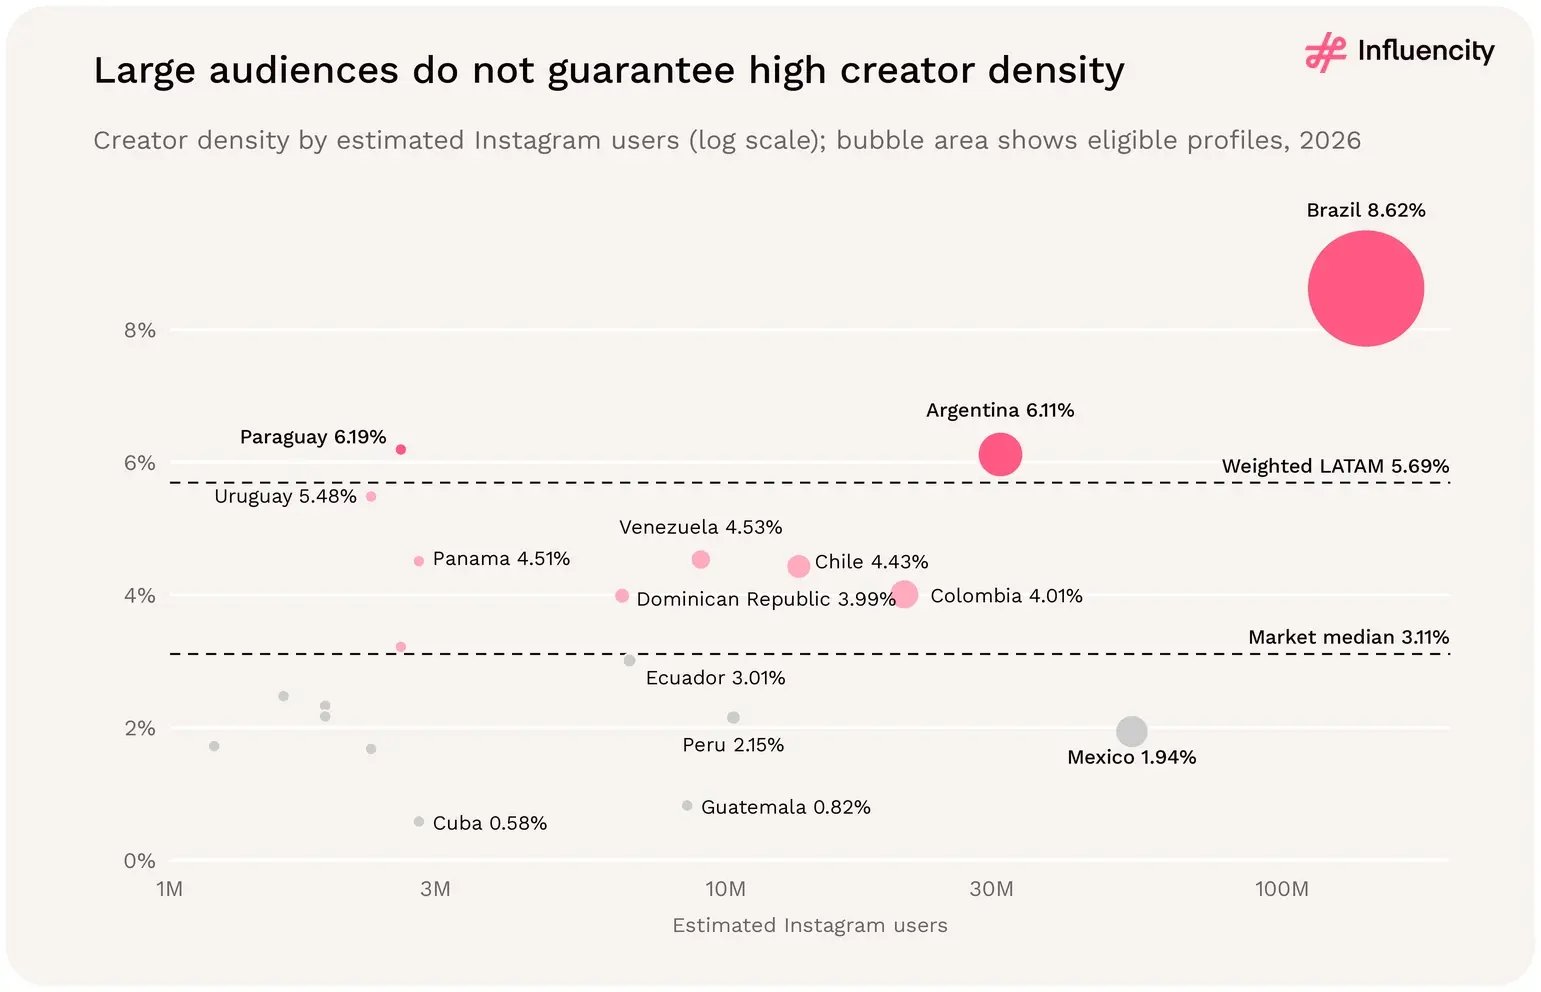
Large audiences do not guarantee high creator density: Brazil combines the largest audience with 8.62% density, while Mexico sits at 1.94% and small Paraguay reaches 6.19%.

Figure 15 → Creator density by estimated Instagram users, with bubble area showing eligible profiles, the weighted 5.69% benchmark and the 3.11% market median, 2026. Source: [1].

Does creator density hold among Instagram influencers with 10,000+ followers?

Partly. Counting only profiles with 10,000 or more followers, the 20 markets record 6.75 such profiles per 1,000 estimated users. Brazil still leads at 9.51, but its advantage narrows: it is 1.41 times the regional figure, compared with 1.51 times for all eligible profiles, and 2.06 times the 19 markets outside Brazil (4.61), compared with 2.52 times overall. [1]

The order below Brazil changes. Paraguay stays second (7.34), Venezuela rises from fifth to third (7.01), Panama from sixth to fourth (6.80) and Colombia from eighth to fifth (6.67). Argentina falls from third to sixth (6.61) and Uruguay from fourth to seventh (6.53): their overall density leans more heavily on nano profiles. Peru moves from 15th to 12th, reflecting a higher share of profiles above 10,000 followers (16.2%). [1]
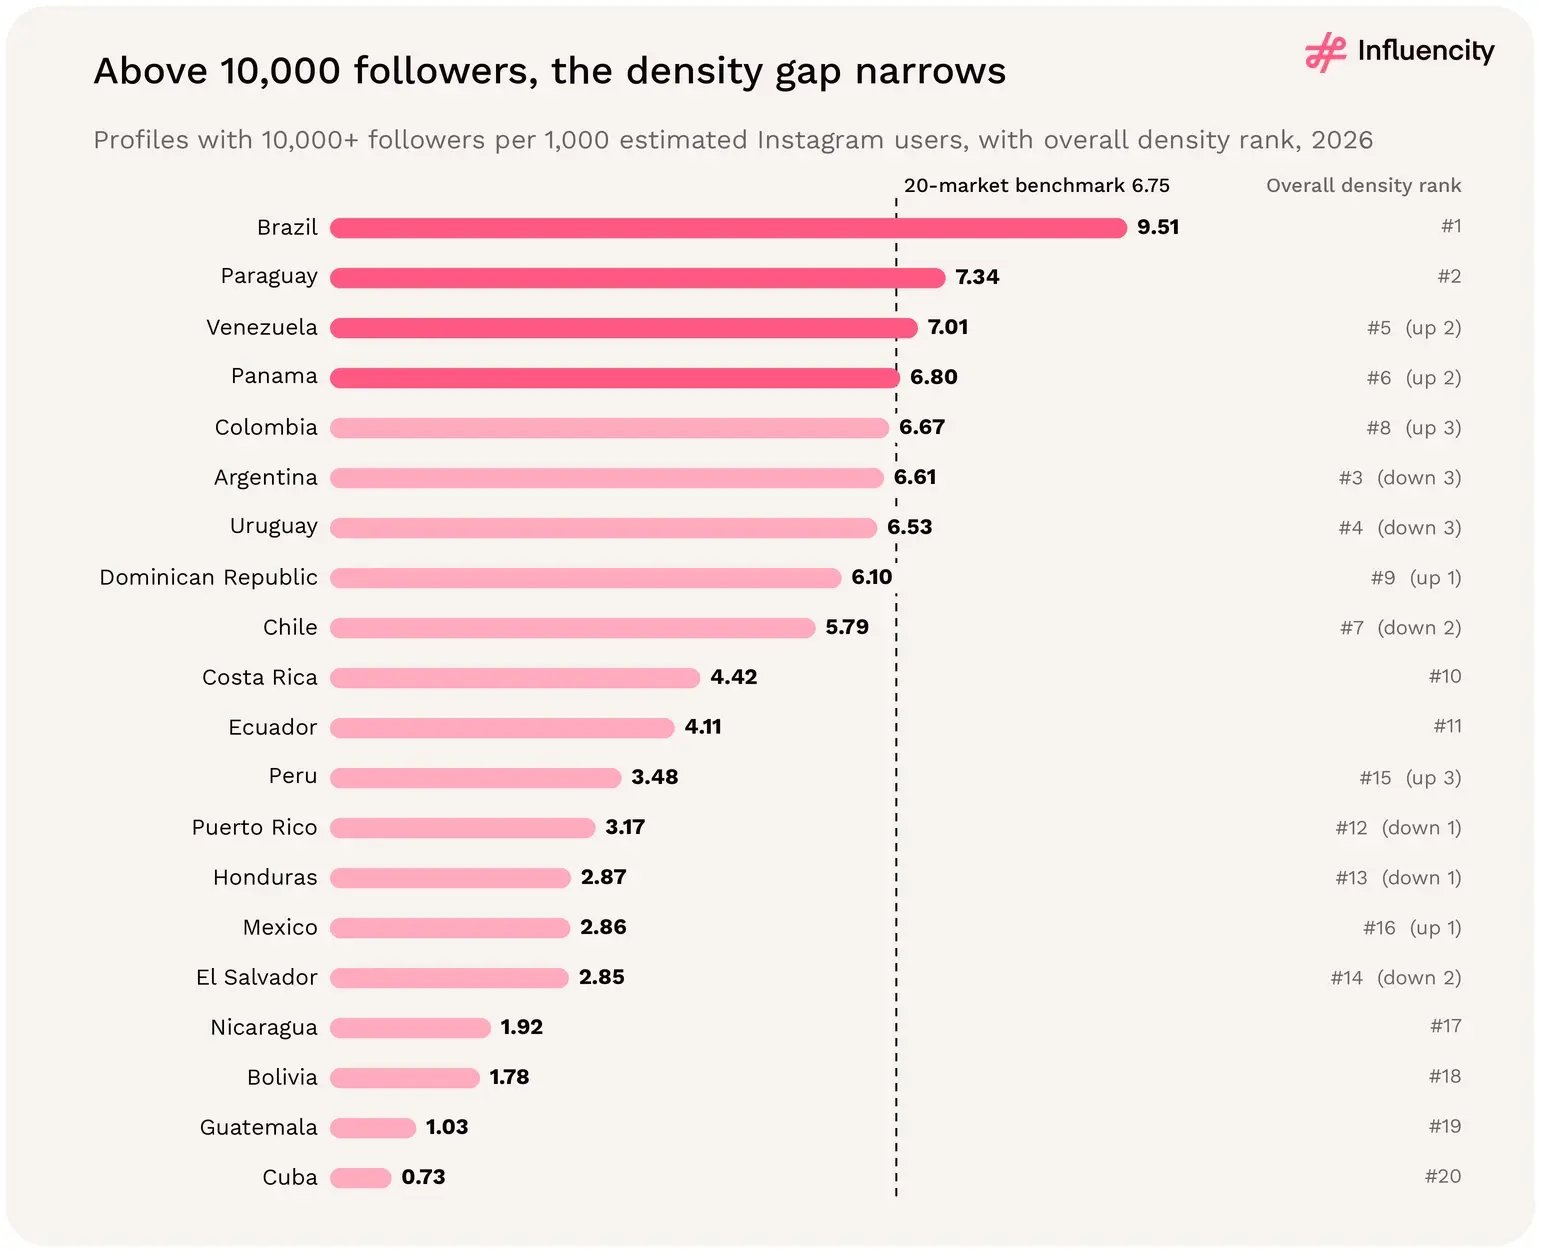
Profiles with 10,000+ followers per 1,000 estimated Instagram users by LATAM market in 2026: Brazil leads with 9.51, followed by Paraguay (7.34), against a 20-market benchmark of 6.75.

Figure 16 → Profiles with 10,000+ followers per 1,000 estimated Instagram users, with each market's overall density rank and the 20-market benchmark, 2026. Source: [1].

Paraguay is a density exception, not a scale leader

Paraguay has only 0.9% of regional creator supply, but its 161,006 profiles sit against an estimated audience of 2.6M. It therefore ranks second for density while ranking tenth for absolute supply. Uruguay offers a similar distinction: fourth for density, twelfth for supply. [1]

Large audiences can coexist with low recorded density

Mexico has 53.6M estimated users but 1.94% creator density; Guatemala has 8.5M estimated users but 0.82% density. These are descriptive contrasts, not evidence of cheaper partnerships, low competition, untapped demand or weaker creators. For Mexico, cross-border Spanish-language creators with Mexican audiences may matter, but the data cannot measure audience location. [1]
How should brands use creator-density data?

  • Pick the benchmark that matches the brief. Use 5.69% only for a full 20-market view, and compare individual markets with the 3.11% median rather than the weighted regional figure. [1]
  • Read density next to scale. Paraguay and Uruguay are dense but small, with 161,006 and 126,047 eligible profiles. A high ratio does not create a large shortlist. [1]
  • Do not equate low density with low supply. Mexico ranks 16th for density, yet its 1,037,320 eligible profiles are the third-largest pool in the footprint. [1]
  • Check the tier that the brief needs. For campaigns that require creators above 10,000 followers, use the 10,000+ ratio: it moves Venezuela, Panama and Colombia up and Argentina and Uruguay down. [1]
  • Treat density as a sourcing ratio, not a performance signal. The data does not measure engagement, pricing, competition or audience location, so density cannot indicate where partnerships will perform better.

Creator density shows how many recorded creator profiles exist relative to each market's estimated Instagram audience. In LATAM it is high in Brazil, Paraguay and Argentina, below the regional benchmark in 17 of 20 markets and lowest in Cuba, Guatemala, Bolivia and Nicaragua. Use it to compare markets on a like-for-like basis, then combine it with absolute supply, follower tier and audience location before deciding where to recruit. [1]

06 → AUDIENCE ESTIMATES

Which markets have the highest Instagram audience-to-population ratios?

Chile has the highest estimated Instagram audience relative to population, at 68.3%, followed by Uruguay (67.6%), Argentina (65.5%) and Brazil (65.3%). At the other end, Nicaragua (16.8%), Honduras (17.8%) and Bolivia (18.1%) record ratios below one in five, a four-fold spread. Seven of the 20 markets exceed half their population reference, and the regional ratio of 49.6% sits between Europe (43.9%) and the US (56.5%). These are contextual ratios, not measured adoption rates. [1, 3, 4]

Market

Estimated users

Users / population

Creator density

Chile

13.50M

68.3%

4.43%

Uruguay

2.30M

67.6%

5.48%

Argentina

31.10M

65.5%

6.11%

Brazil

141.40M

65.3%

8.62%

Panama

2.80M

61.9%

4.51%

Dominican Republic

6.50M

56.2%

3.99%

Puerto Rico

1.60M

50.2%

2.47%

Costa Rica

2.60M

47.4%

3.22%

All 20 LATAM markets

323.50M

49.6%

5.69%

United States (50 states)

192.60M

56.5%

4.64%

Europe (30 markets)

294.50M

43.9%

4.21%

Bubble chart of LATAM markets by Instagram audience-to-population ratio and creator density: Brazil and Argentina are high on both, while Paraguay pairs high density with a lower audience ratio.

Figure 17 → Audience-to-population ratio and creator density measure different market characteristics. Source: [1].

Chile and Uruguay have close audience ratios but very different pools: 597,646 and 126,047 eligible profiles. A high ratio does not imply the same capacity for a large recruitment programme. Chile also has the footprint's highest unclassified share (41.3%), so check account type before treating its pool as individual creators. [1]

Where is Instagram audience reach the lowest?

Seven markets record estimated users below 35% of their population reference: Venezuela (31.0%), Peru (30.1%), El Salvador (29.8%), Cuba (25.6%), Bolivia (18.1%), Honduras (17.8%) and Nicaragua (16.8%). Together they hold 17.0% of the footprint's population reference but only 9.1% of estimated users and 4.3% of eligible profiles. The unweighted market median is 39.9%, well below the 49.6% regional ratio, because Brazil and Argentina pull the weighted figure up. [1]
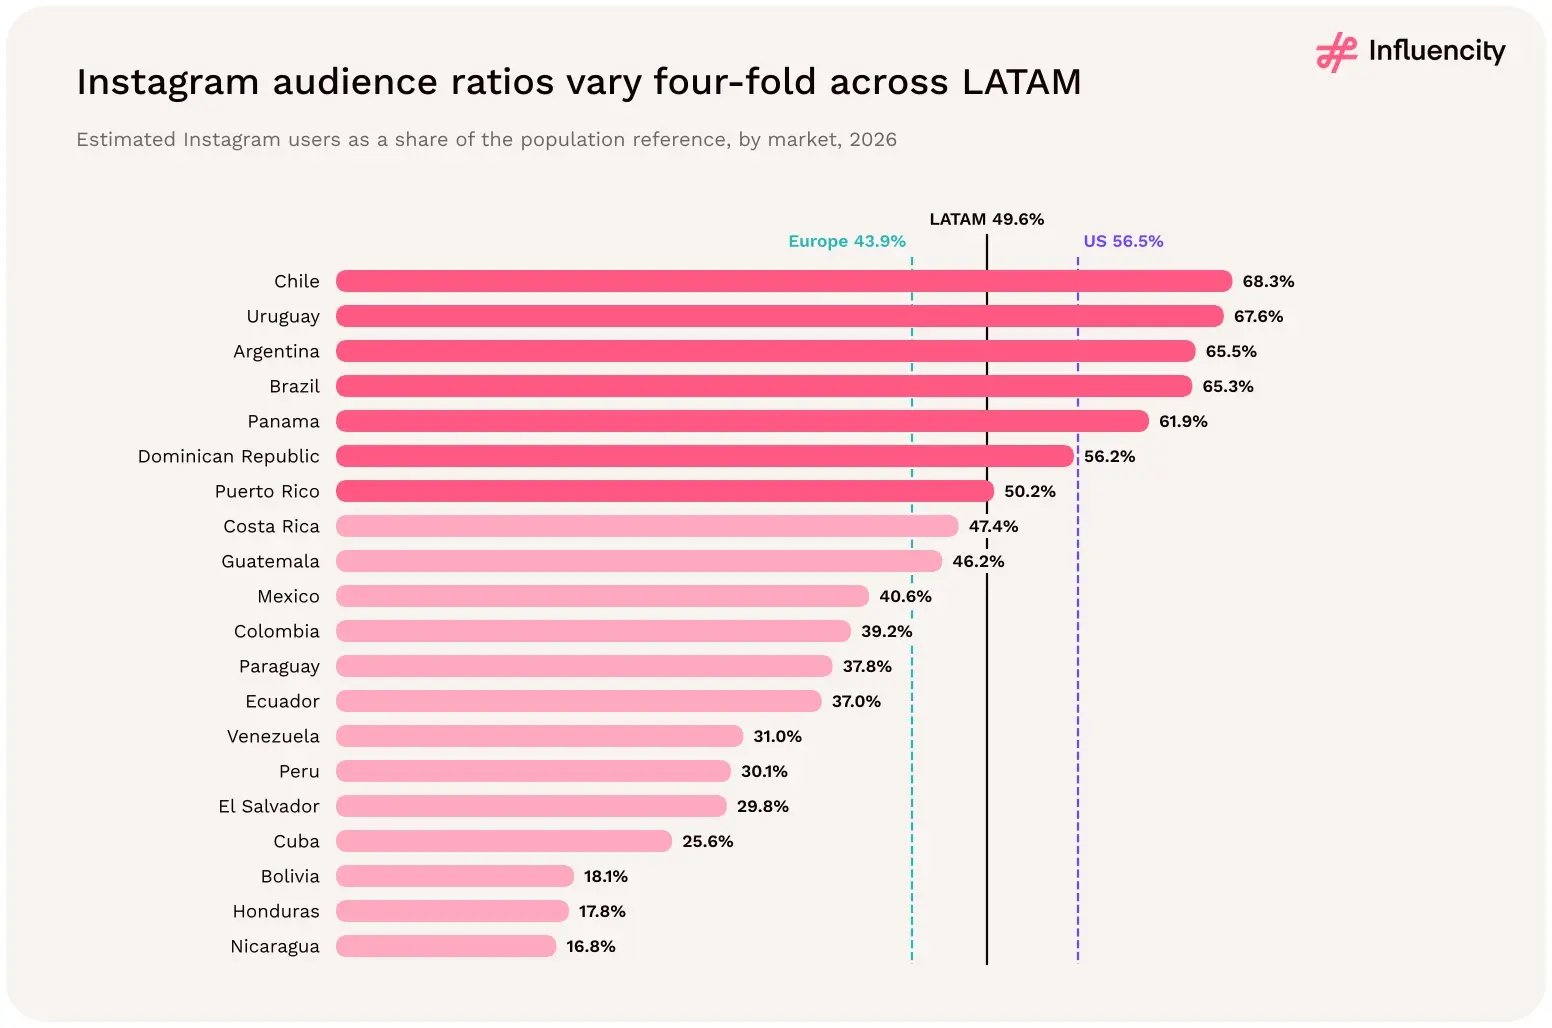
Estimated Instagram users as a share of population by LATAM market in 2026, from Chile (68.3%) to Nicaragua (16.8%), against ratios of 49.6% for LATAM, 56.5% for the US and 43.9% for Europe.

Figure 18 → Estimated Instagram users as a share of each market's population reference, with the LATAM, US and Europe ratios, 2026. Sources: [1, 3, 4].

Grouping markets by audience ratio shows how reach and creator supply cluster. The seven markets at 50% or more hold 47.0% of the population reference but 82.7% of eligible profiles, with a combined creator density of 7.65%. The two lower bands record densities of 2.52% and 2.69%, less than half the regional benchmark. [1]
Audience ratio band

Markets

Share of population

Share of users

Share of profiles

Creator density

50% or more

Chile, Uruguay, Argentina, Brazil, Panama, Dominican Republic, Puerto Rico

47.0%

61.6%

82.7%

7.65%

35% to 50%

Costa Rica, Guatemala, Mexico, Colombia, Paraguay, Ecuador

35.9%

29.3%

13.0%

2.52%

Below 35%

Venezuela, Peru, El Salvador, Cuba, Bolivia, Honduras, Nicaragua

17.0%

9.1%

4.3%

2.69%

Source: [1], Appendix A. Bands use each market's estimated users / population reference; creator density is recalculated for each band from summed profiles and users.

Does a larger Instagram audience mean more influencers?

Usually, but not always, as Figure 17 shows. Across the 20 markets, the audience-to-population ratio and creator density are positively correlated (Pearson r = 0.66; 0.62 excluding Brazil): where Instagram reaches more of the population, more eligible profiles tend to be recorded per user. Brazil and Argentina sit above both regional benchmarks. Chile, Uruguay, Panama, the Dominican Republic and Puerto Rico combine high audience ratios with below-benchmark density, while Paraguay is the reverse: a 37.8% audience ratio with 6.19% density. [1]

Mexico shows the largest absolute gap between population reference and estimated audience: 131.9M residents against 53.6M estimated users, a difference of 78.3M, larger than Brazil's 75.3M. Combined with its 1.94% creator density, this makes Mexico the clearest case where audience size, audience coverage and creator supply each need separate planning assumptions. [1]

What this means for audience planning

  • Use audience ratios for reach planning, not creator sourcing. A high ratio signals that Instagram reaches a large share of residents; it does not guarantee a deep creator pool, as Chile (68.3% audience ratio, 4.43% density) shows.
  • Plan low-ratio markets around targeted reach. The seven markets below 35% have 29.4M estimated users combined, about 9% of the regional audience, so tighter targeting and cross-border Spanish-language creators may be needed.
  • Treat Paraguay as a sourcing exception. Its creator density (6.19%) is the second highest in the footprint despite a 37.8% audience ratio, so its creator pool is deeper than its audience ratio suggests.
  • Quote both figures behind every ratio. Population references and user estimates come from different fields and dates; report the ratio with both numbers and avoid calling it an adoption rate.

07 → GENDER CLASSIFICATION

What is the gender mix of Instagram influencers in LATAM?

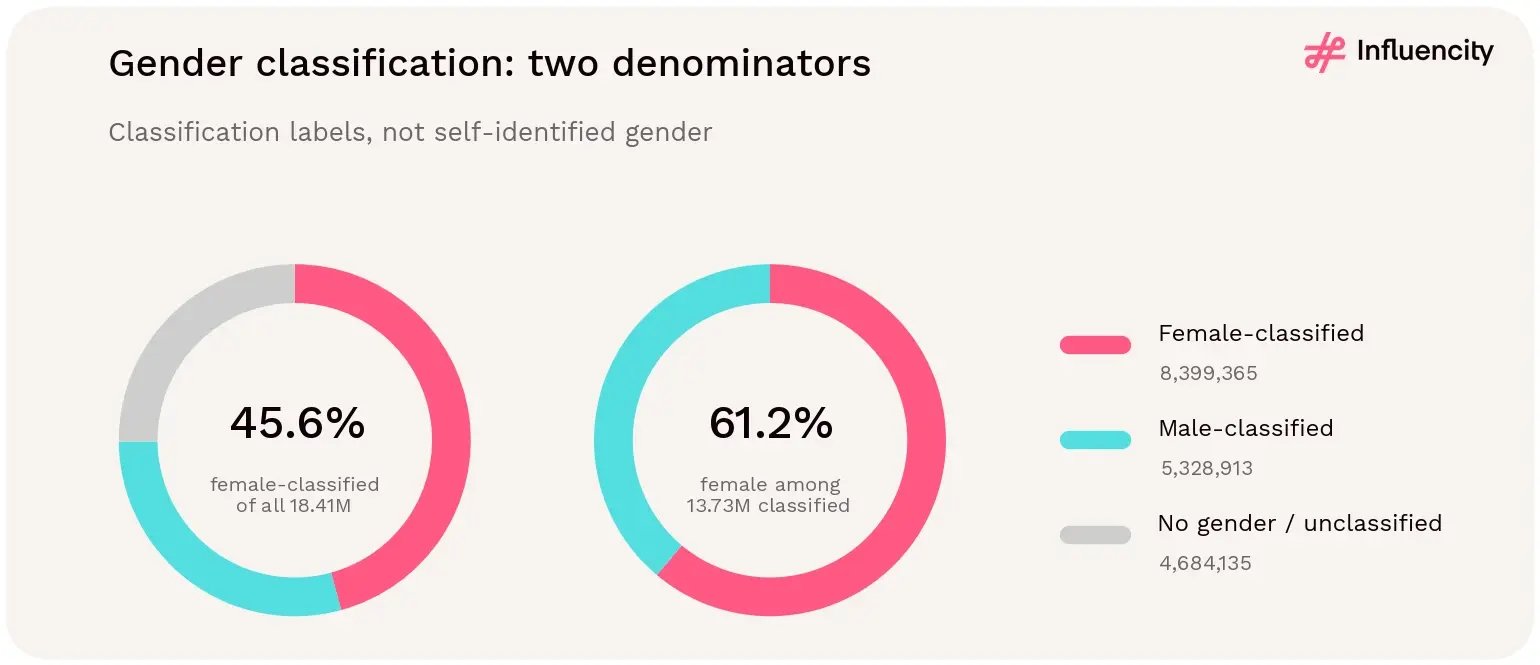
Female-classified profiles represent 61.18% of the 13,728,278 male/female-classified records, slightly above the US (60.2%) and Europe (59.8%). They represent 45.62% of all eligible profiles, because 4,684,135 records have no gender classification. The denominator must travel with the statistic. [1, 8, 9]

Gender classification at a glance

  • 1.58 female-classified profiles for every male-classified one. The 20 markets record 8,399,365 female-classified and 5,328,913 male-classified Instagram profiles. [1]
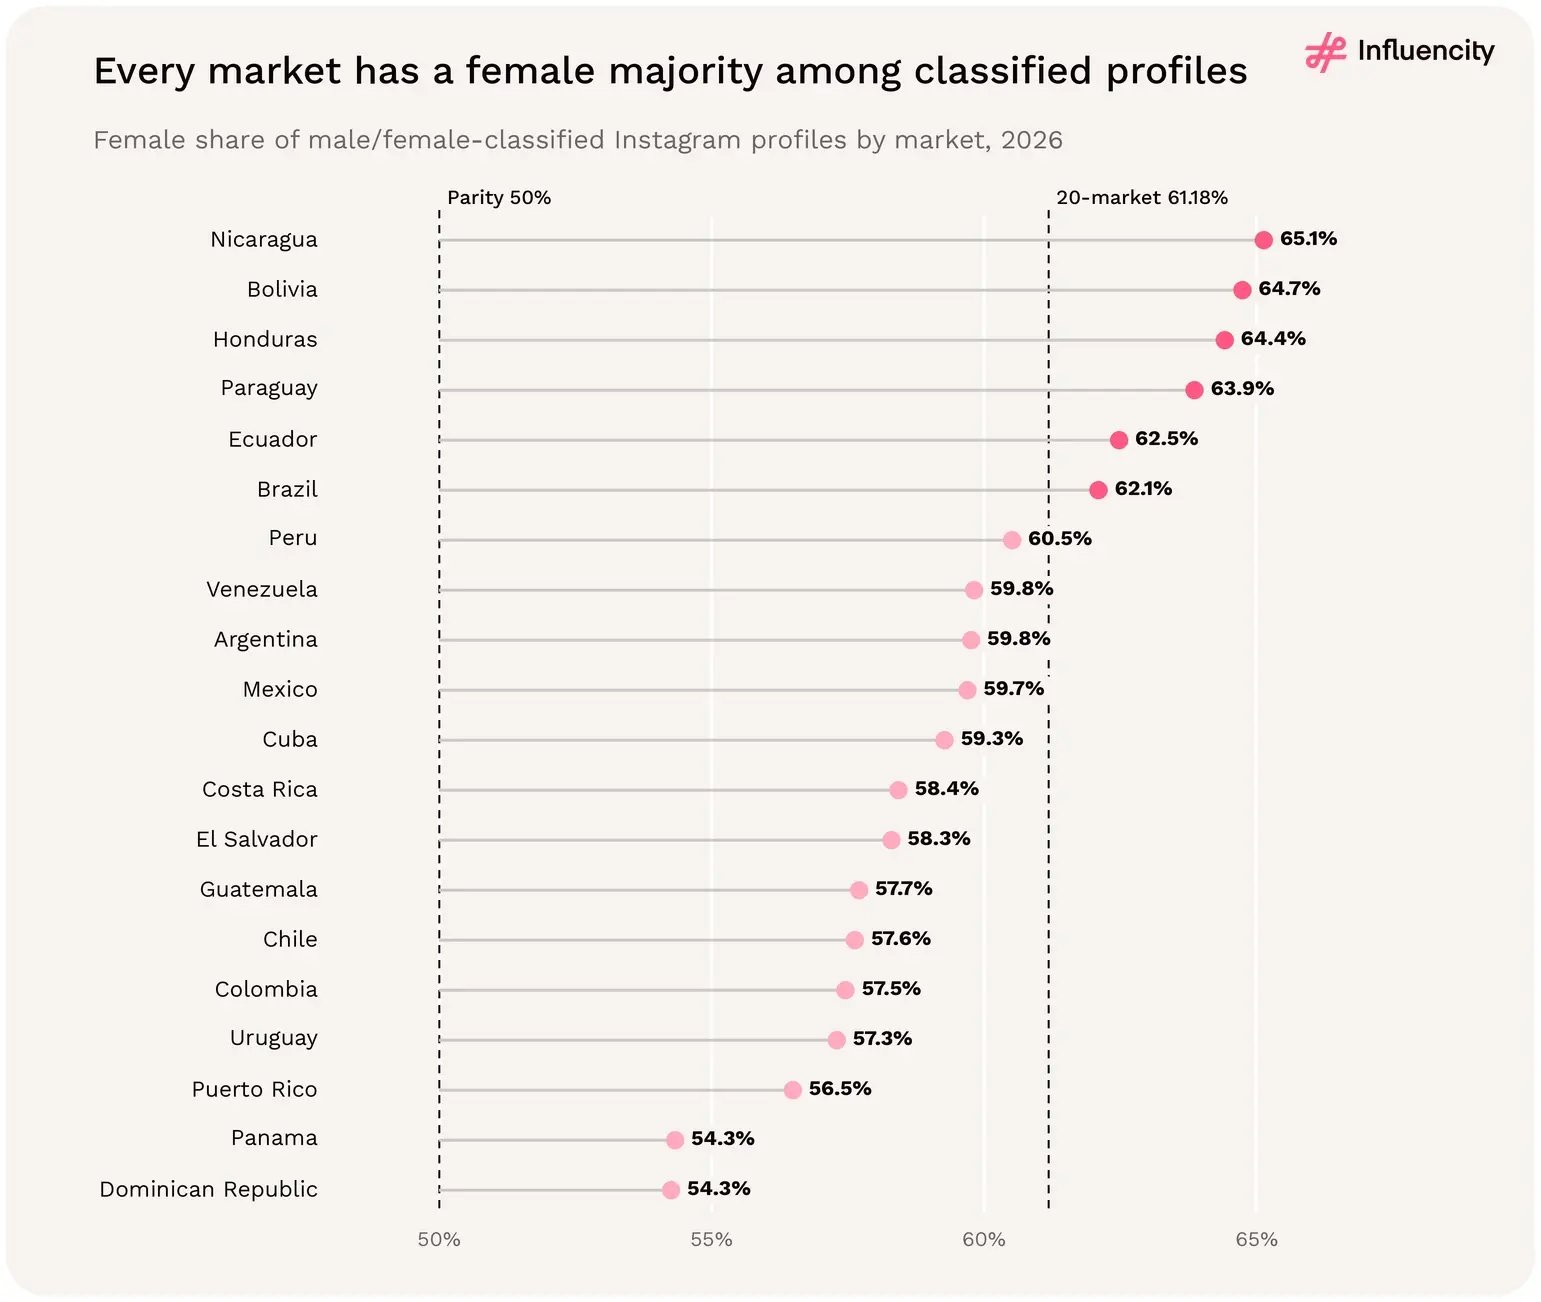
  • A female majority in all 20 markets. Among classified profiles, the female share ranges from 54.3% in the Dominican Republic and Panama to 65.1% in Nicaragua. [1]
  • Brazil sits above the rest of the region. Its female share of classified profiles is 62.1%, against 59.1% across the other 19 markets, and it holds 70.2% of all female-classified profiles. [1]
  • A quarter of profiles have no classification. The unclassified share is 25.4% overall, from 15.6% in Cuba to 41.3% in Chile. [1]
  • The all-profile female share is a floor, not an estimate. Female-classified profiles are 45.6% of all eligible profiles; the true share depends on the 4,684,135 unclassified records and could lie anywhere from 45.6% to 71.1%. [1]

Classification

Profiles

Share of all profiles

Share of classified

Female

8,399,365

45.62%

61.18%

Male

5,328,913

28.94%

38.82%

No gender / unclassified

4,684,135

25.44%

Excluded

Female-classified profiles are 45.6% of all 18.41 million eligible LATAM Instagram profiles and 61.2% of the 13.73 million classified, with 4,684,135 profiles left unclassified.

Figure 19 → Female-classified profiles lead within the classified subset; unclassified profiles remain visible. Source: [1].
Pattern

Markets and shares

Highest female shares

Nicaragua 65.1%; Bolivia 64.7%; Honduras 64.4%

Closest to parity

Dominican Republic 54.3%; Panama 54.3%; Puerto Rico 56.5%

Highest unclassified shares

Chile 41.3%; Venezuela 39.9%; Uruguay 36.1% of all profiles

Classification is not a survey of self-identified gender. The unclassified field can reflect missing or inapplicable classification; it should not be relabelled as non-binary. This data describes creator accounts, not their audiences, spending power or campaign effectiveness. [1]

How does the gender mix of Instagram influencers vary by market?

Moderately. Every market has a female majority among classified profiles, but the margin varies by 10.8 percentage points: from 54.3% in the Dominican Republic and Panama to 65.1% in Nicaragua. Among the five largest markets, Brazil has the highest female share (62.1%), followed by Argentina (59.8%), Mexico (59.7%), Chile (57.6%) and Colombia (57.5%). [1]

Brazil lifts the regional figure. Its 62.1% female share compares with 59.1% across the 19 markets outside Brazil, and Brazil holds 70.2% of female-classified profiles but 67.5% of male-classified ones. Smaller markets lead the ranking: Nicaragua, Bolivia and Honduras each have fewer than 20,000 female-classified profiles. [1]

Market

Female

Male

Unclassified

Female share of classified

Unclassified share of all

Brazil

5,892,463

3,595,759

2,693,993

62.1%

22.1%

Argentina

784,039

527,878

589,729

59.8%

31.0%

Mexico

459,973

310,557

266,790

59.7%

25.7%

Colombia

321,313

237,880

277,957

57.5%

33.2%

Chile

202,094

148,576

246,976

57.6%

41.3%

Venezuela

146,519

98,419

162,752

59.8%

39.9%

Dominican Republic

100,667

84,870

73,626

54.3%

28.4%

Peru

88,648

57,840

74,841

60.5%

33.8%

Ecuador

86,537

51,967

63,082

62.5%

31.3%

Paraguay

77,686

43,956

39,364

63.9%

24.4%

All 20 markets

8,399,365

5,328,913

4,684,135

61.2%

25.4%

Source: [1]. Ten largest markets by eligible profiles. Female share of classified = female / (female + male); unclassified share uses all eligible profiles.

Every LATAM market has a female majority among male/female-classified Instagram profiles in 2026, from 65.1% in Nicaragua to 54.3% in Panama and the Dominican Republic, against a 20-market figure of 61.18%.

Figure 20 → Female share of male/female-classified Instagram profiles by market, with parity and the 61.18% 20-market figure, 2026. Source: [1].

How much do unclassified profiles change the gender picture?

Substantially. Female-classified profiles make up 45.6% of all eligible profiles. If every unclassified record were female, the share would be 71.1%; if every one were male, the male share would be 54.4%. The data therefore support a female majority among classified profiles, not a confirmed majority of all creators. [1]

The unclassified share also changes market comparisons. Cuba ranks 11th for female share of classified profiles (59.3%) but first for female share of all profiles (50.0%), because only 15.6% of its profiles are unclassified. Chile has a similar classified share (57.6%) but only 33.8% of all its profiles are female-classified, because 41.3% are unclassified. Brazil's unclassified share is 22.1%, against 31.9% across the other 19 markets, and 12 of the 20 markets exceed 30%. [1]
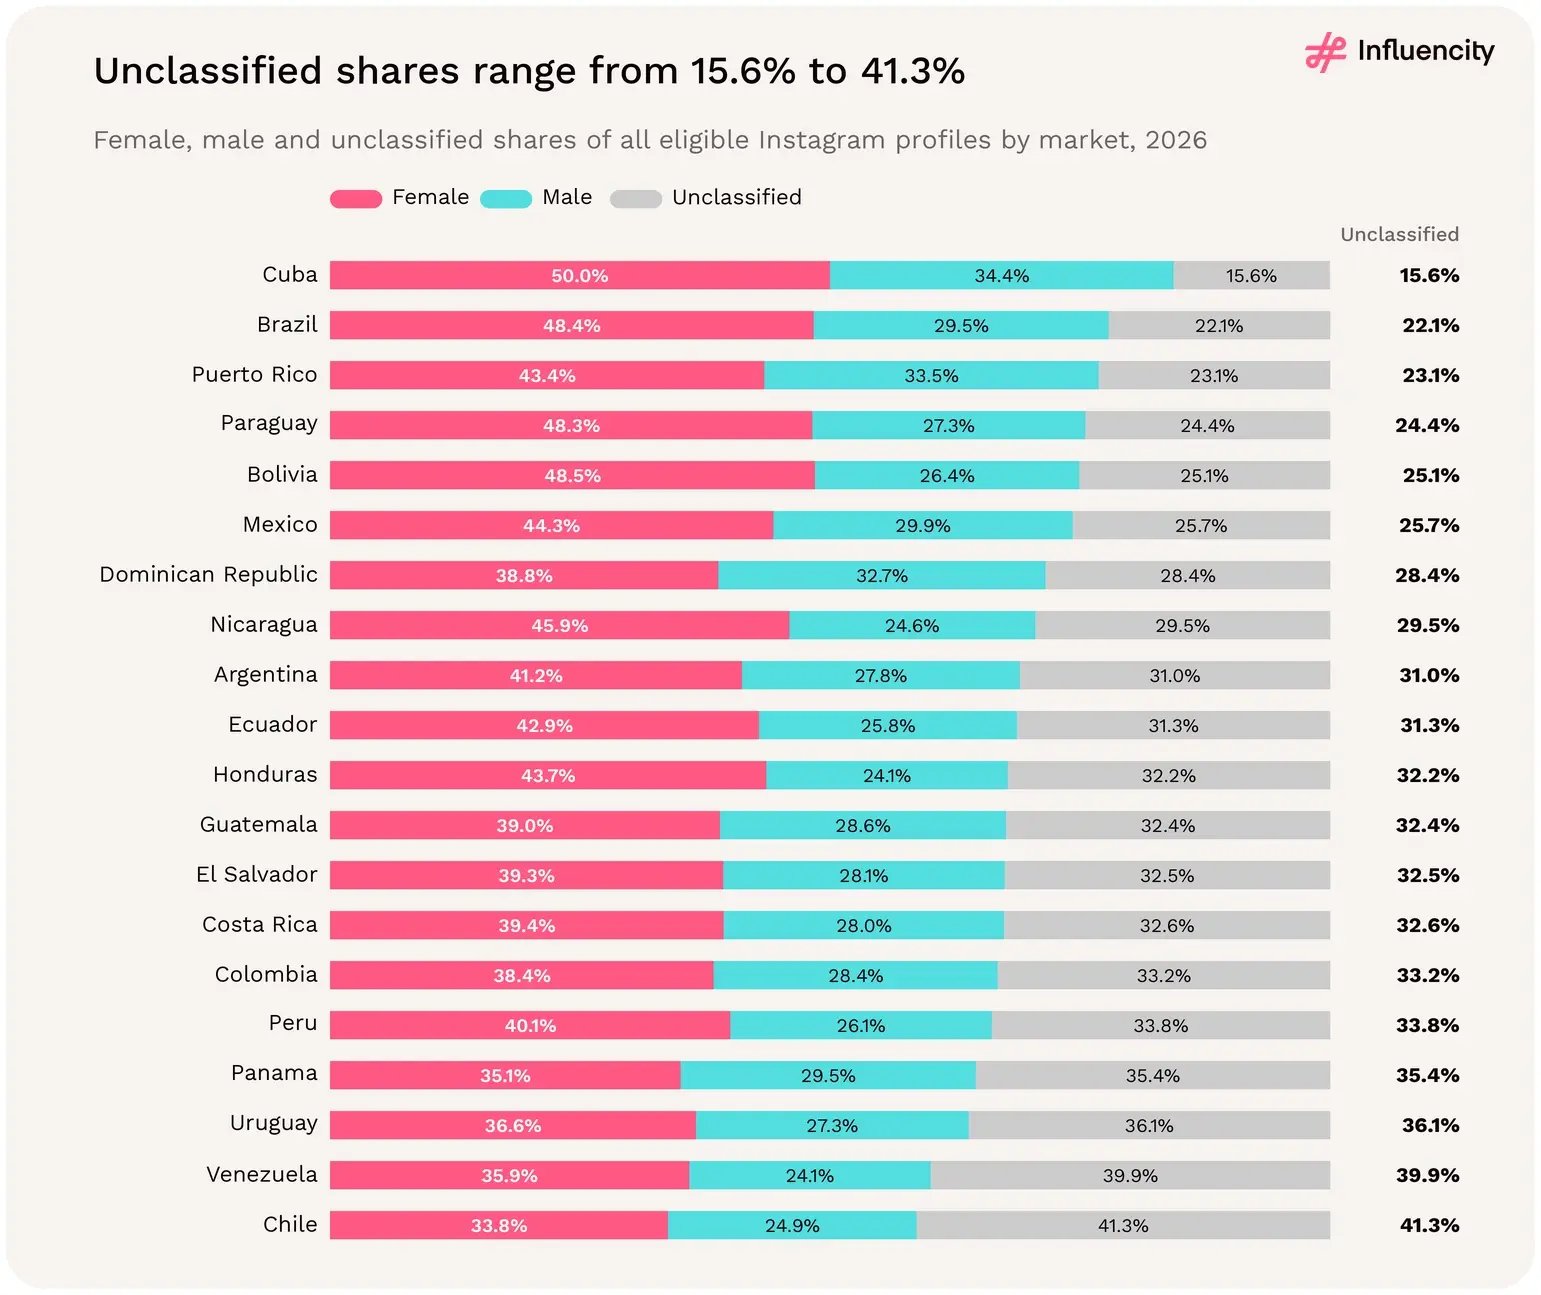
Unclassified profiles range from 15.6% of eligible Instagram profiles in Cuba to 41.3% in Chile in 2026; Brazil splits 48.4% female, 29.5% male and 22.1% unclassified.

Figure 21 → Female, male and unclassified shares of all eligible Instagram profiles by market, sorted by unclassified share, 2026. Source: [1].

How many female-classified Instagram influencers are there per 1,000 users?

About 26 across the 20 markets: 8,399,365 female-classified profiles against 323.5M estimated Instagram users. Brazil records 41.7 per 1,000 estimated users, Paraguay 29.9 and Argentina 25.2, while Mexico records 8.6, Guatemala 3.2 and Cuba 2.9. The ratio measures creator supply relative to the whole estimated audience, not the gender of that audience. [1]
How should brands use creator gender data?

  • State the denominator every time. Quote 61.2% as a share of classified profiles and 45.6% as a share of all eligible profiles; the two figures answer different questions. [1]
  • Size gender-specific briefs with classified counts. Mexico, for example, records 459,973 female-classified and 310,557 male-classified profiles; unclassified profiles need review before they are counted for either group. [1]
  • Allow for unclassified profiles in high-gap markets. In Chile, Venezuela and Uruguay more than a third of eligible profiles are unclassified, so a filter on classified gender alone will miss a large part of the pool. [1]
  • Compare markets on the classified share. All-profile shares mix gender differences with differences in classification coverage, as the Cuba and Chile contrast shows. [1]

Female-classified creators outnumber male-classified creators in every covered market, by 1.58 to one across the region, but a quarter of eligible profiles carry no classification. Treat the classified split as a reliable guide to the classified pool, report unclassified profiles alongside it and confirm creator and audience characteristics individually before building a gender-focused programme. [1]

08 → GENDER EXCEPTIONS BY TIER

Does the gender pattern change among larger creators?

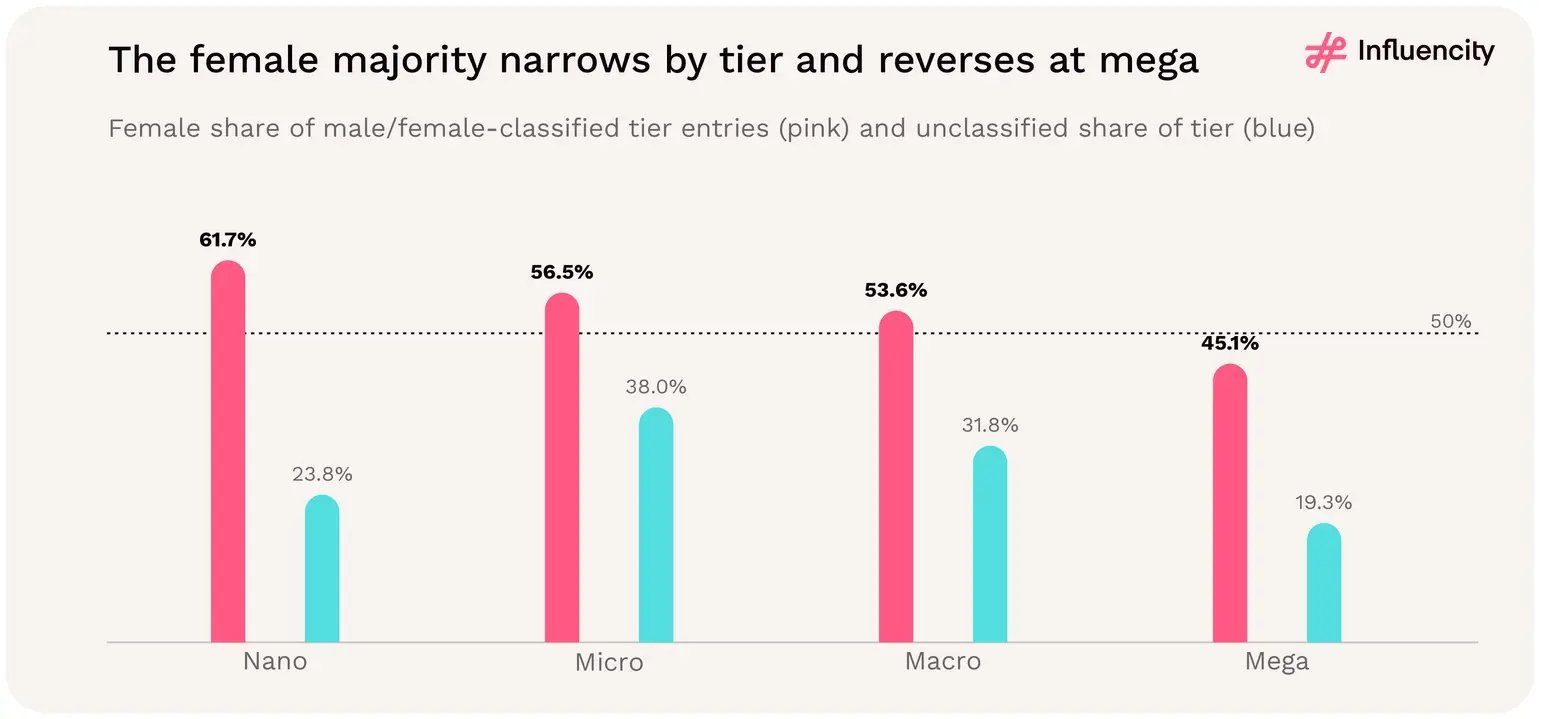
Yes. The female share of classified profiles falls at every step up the follower ladder, from 61.7% in nano to 56.5% in micro, 53.6% in macro and 45.1% in mega. Mega is the only tier with a male majority (5,719 male against 4,691 female records), even though every market total has a female majority among classified records. Relative to their numbers, men are 1.92 times as likely as women to reach 1 million followers. [1]

Tier

Male records

Female records

Female share, classified

Unclassified

Nano

4,719,431

7,618,311

61.7%

3,859,059

Micro

529,882

689,248

56.5%

746,512

Macro

65,438

75,568

53.6%

65,602

Mega

5,719

4,691

45.1%

2,486

The female share of classified Instagram profiles narrows from 61.7% at nano tier to 56.5% at micro and 53.6% at macro, then falls below parity to 45.1% at mega tier.

Figure 22 → The classified gender majority reverses in the mega-tier records. Shares use tier entries. Source: [1].
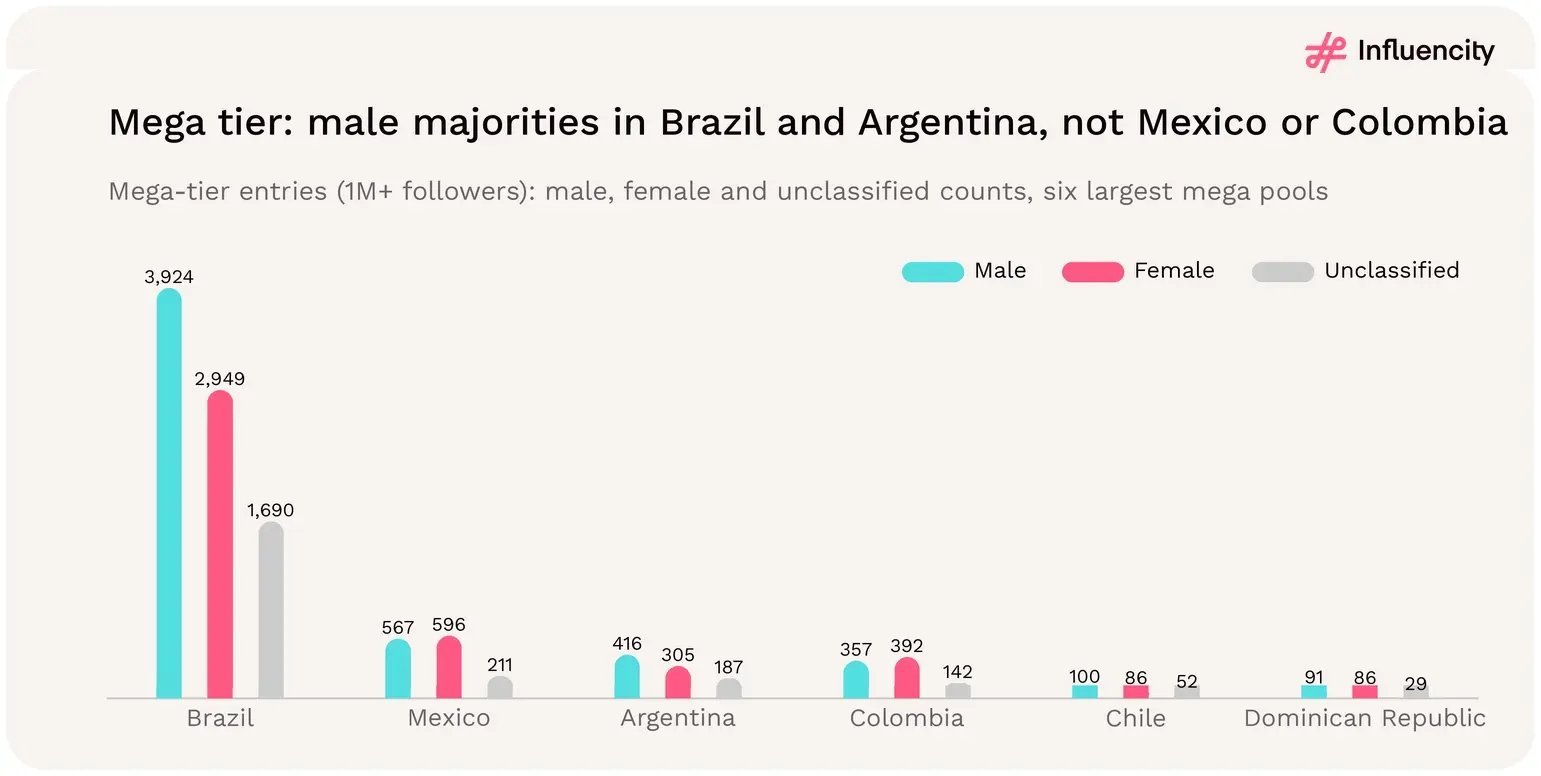
Brazil has 3,924 male and 2,949 female mega-tier Instagram profiles (1M+ followers), and Argentina 416 versus 305, while Mexico (596 female, 567 male) and Colombia lean slightly female.

Figure 23 → Mega-tier gender counts in the six largest mega pools. Brazil, Argentina, Chile and the Dominican Republic have male majorities; Mexico and Colombia slight female majorities. Source: [1].

Twelve markets have male-majority classified mega records. Small denominators matter: Puerto Rico (33 male, 13 female) and Uruguay (21, 5) show large male shares from small counts, and Cuba has two classified mega records and Nicaragua one. Outside Brazil, the pooled mega split is close to parity, at 50.75% male. [1]

The same top-of-ladder pattern now appears in four of Influencity's five 2026 regional datasets: male majorities among classified mega records in LATAM Instagram (54.9%), Europe Instagram (55.5%), Europe TikTok (55.9%) and US TikTok (52.4%), with US Instagram near parity (49.9% male). Its causes are not established in any of them. [1, 8–11]

How much more likely are men to reach the top tiers?

Men are a minority of classified LATAM Instagram profiles but a growing share of each higher follower threshold. Per 1,000 classified profiles of each gender, 113.0 male and 91.7 female profiles have 10,000 or more followers (1.23 times); at 100,000 the rates are 13.4 and 9.6 (1.40 times); at 1 million they are 1.07 and 0.56 (1.92 times). The gap almost doubles between the first and last threshold. [1]
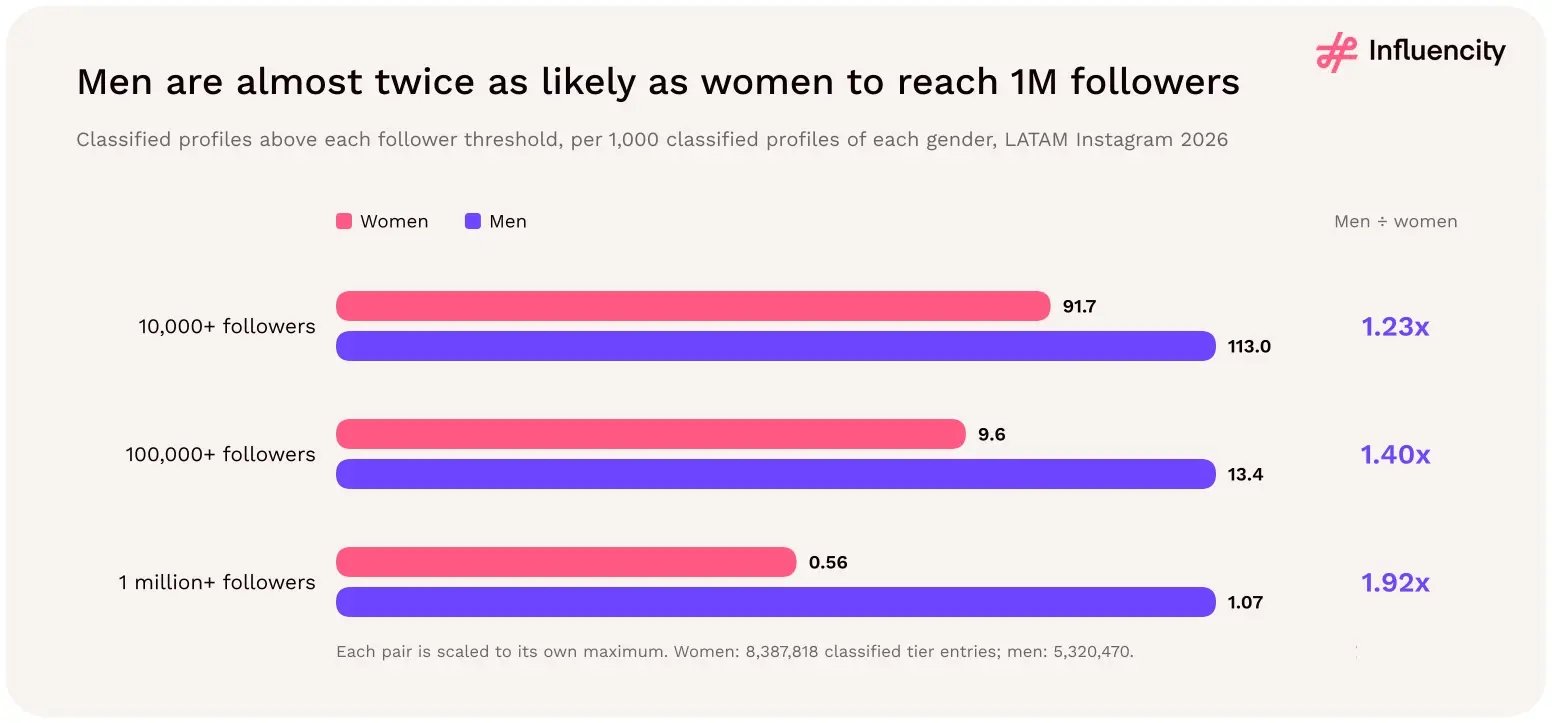
Per 1,000 classified LATAM Instagram profiles, men reach 1 million+ followers 1.92 times as often as women (1.07 vs 0.56), compared with 1.23 times at the 10,000+ follower threshold.

Figure 24 → Classified profiles above each follower threshold per 1,000 classified profiles of each gender, LATAM Instagram, 2026. Source: [1].

In absolute numbers, women still lead by 2,898,880 profiles in nano, 159,366 in micro and 10,130 in macro; the male lead in mega is only 1,028 profiles. Unclassified records also matter here: 38.0% of micro entries and 19.3% of mega entries carry no male/female label, so classified shares describe only the profiles with a gender classification, not every account in a tier. [1]

Threshold

Female-classified profiles

Per 1,000 female

Male-classified profiles

Per 1,000 male

Men ÷ women

10,000+ followers

769,507

91.7

601,039

113.0

1.23x

100,000+ followers

80,259

9.6

71,157

13.4

1.40x

1M+ followers

4,691

0.56

5,719

1.07

1.92x

Source: [1]. Rates use classified tier entries as the base: 8,387,818 female and 5,320,470 male. Thresholds are cumulative.

Is the mega-tier male majority unique to Latin America?

No. A male majority among classified mega-tier profiles appears in four of Influencity's five 2026 regional datasets: Europe TikTok (55.9%), Europe Instagram (55.5%), LATAM Instagram (54.9%) and US TikTok (52.4%). US Instagram is the exception, at parity (49.9% male). Within LATAM, the pattern is concentrated: outside Brazil, mega-tier classified profiles are 50.75% male, so Brazil's large mega pool drives most of the regional gap. [1, 8–11]
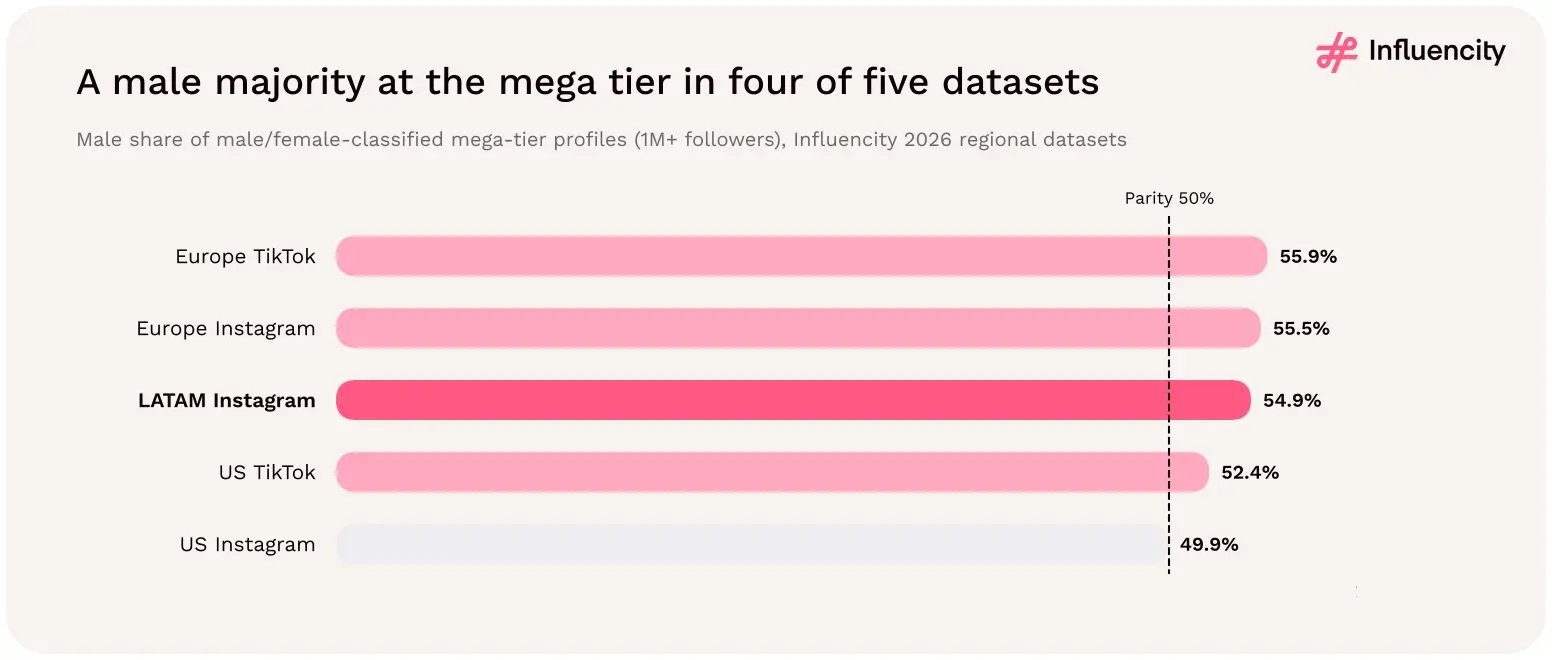
Men hold a majority of classified mega-tier profiles in four of Influencity's five 2026 regional datasets, led by Europe TikTok (55.9%); LATAM Instagram is at 54.9% and US Instagram at 49.9%.

Figure 25 → Male share of male/female-classified mega-tier profiles in Influencity's five 2026 regional datasets. Sources: [1, 8–11].
What this means for gender-balanced rosters

  • Set gender goals by tier, not by market. A 61.2% female classified base becomes 45.1% at mega, so a single market-level target will under-deliver at the top of the ladder.
  • Widen the search at the top of the ladder. With 0.56 female mega profiles per 1,000 classified women against 1.07 for men, female mega shortlists need a broader market or category net.
  • Check small mega pools by hand. In markets such as Puerto Rico, Uruguay, Cuba and Nicaragua, a few profiles can flip the mega-tier majority; review the names, not the percentage.
  • Combine tier with category. Gender mix varies strongly by interest (beauty skews female, gaming skews male; see section 10), so the tier effect should be read alongside category.

09 → CREATOR TIERS

How is the LATAM Instagram creator pool distributed by follower count?

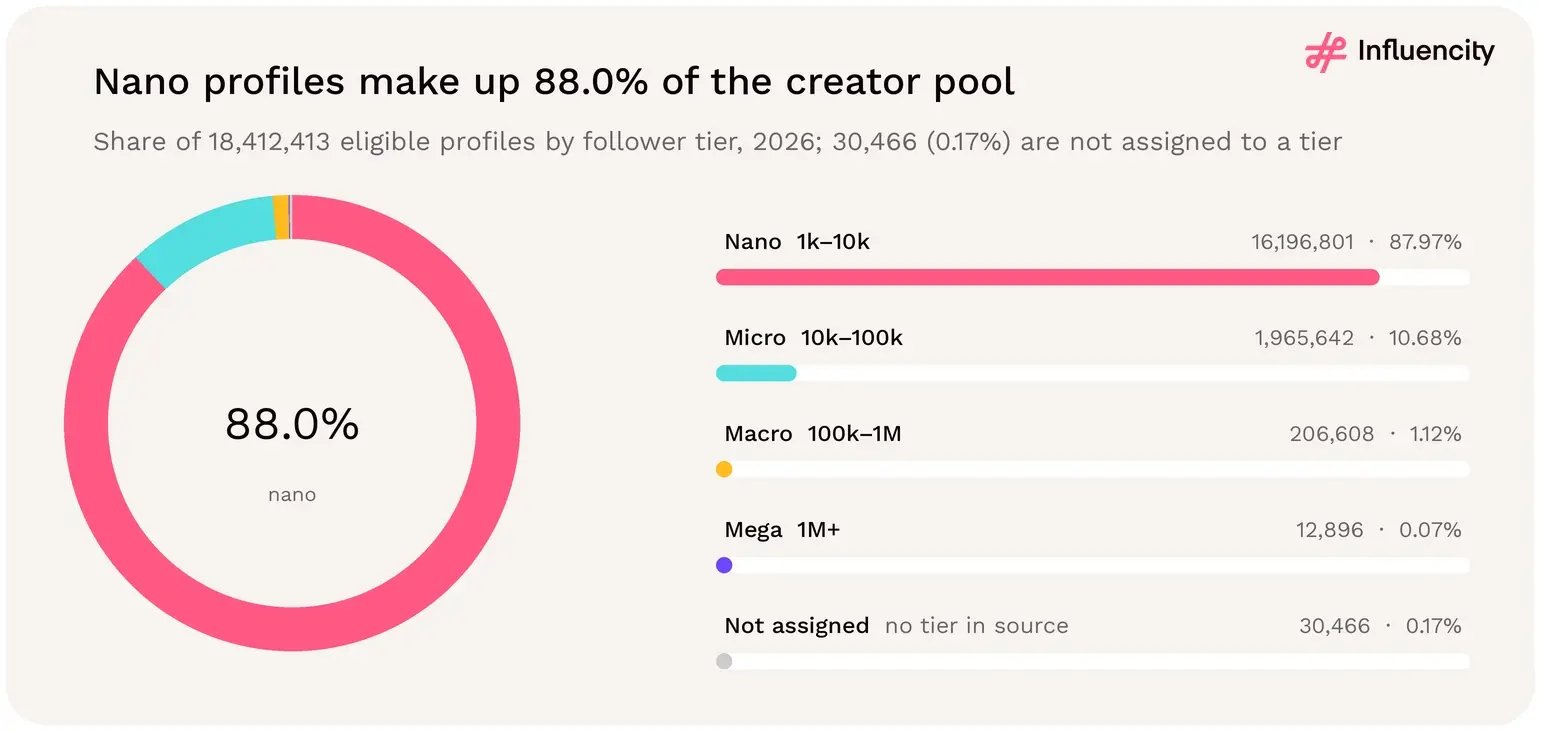
Nano profiles dominate the pool: 16.20M, or 87.97% of all 18,412,413 eligible profiles. Nano and micro together account for 98.64%. Measured against tier entries, the basis used in the US (89.4%) and Europe (87.3%) studies, the LATAM nano share is 88.11%, so the three regions are closely aligned. This is a distribution of recorded follower bands, not a measure of commercial value. [1, 8, 9]

Creator tiers at a glance

  • Each tier is an eighth to a sixteenth of the one below. There are 8.2 nano profiles for every micro profile, 9.5 micro for every macro and 16.0 macro for every mega: one mega profile for every 1,428 eligible profiles. [1]
  • 11.9% of profiles have 10,000+ followers. That is 2,185,146 micro, macro and mega profiles across the 20 markets. [1]
  • Colombia has the most top-heavy pool. 16.7% of its eligible profiles have 10,000+ followers, against 11.0% in Brazil, 10.8% in Argentina and 10.6% in Bolivia. [1]
  • Mega profiles cluster in five markets. Brazil, Mexico, Argentina, Colombia and Chile hold 92.9% of the 12,896 mega profiles; ten markets have fewer than 50. [1]
  • Brazil's share dips in the middle tiers. It holds 66.8% of nano and 66.4% of mega profiles, but 61.7% of micro and 60.1% of macro. [1]

Tier

Follower band as labelled

Profiles

Share of all eligible profiles

Nano

1,000–10,000

16,196,801

87.97%

Micro

10,000–100,000

1,965,642

10.68%

Macro

100,000–1 million

206,608

1.12%

Mega

1 million+

12,896

0.07%

Not assigned to a tier

No tier in the source data

30,466

0.17%

Total eligible profiles

18,412,413

100.00%

Nano profiles (1k to 10k followers) make up 88.0% of LATAM's 18,412,413 eligible Instagram profiles in 2026, followed by micro at 10.68%, macro at 1.12% and mega at 0.07% (12,896 profiles).

Figure 26 → Eligible profiles by follower tier; 30,466 profiles (0.17%) are not assigned to a tier in the source data. Source: [1].

How does the follower-tier mix vary by market?

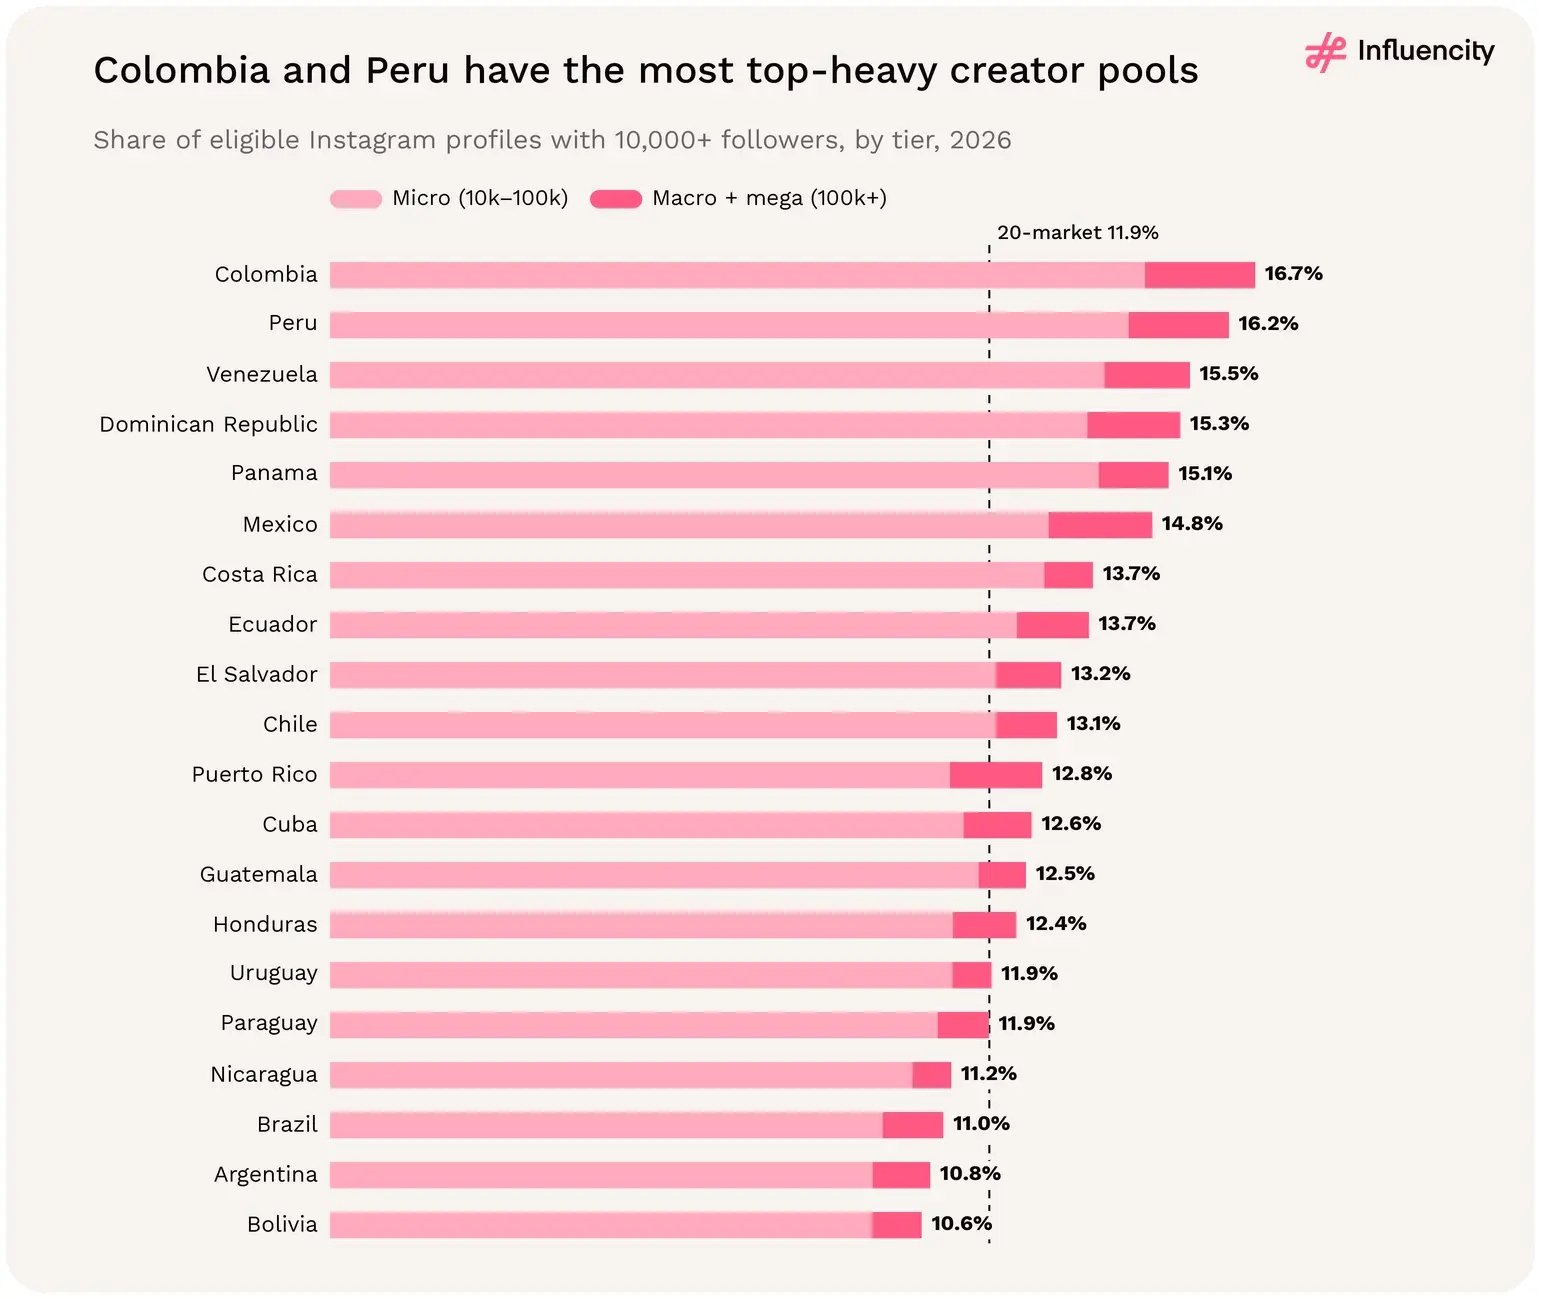
Within a narrow band. Nano profiles make up between 83.3% (Colombia) and 89.1% (Bolivia) of every market's eligible profiles. The share with 10,000+ followers is highest in Colombia (16.7%), Peru (16.2%), Venezuela (15.5%), the Dominican Republic (15.3%), Panama (15.1%) and Mexico (14.8%), and lowest in Bolivia (10.6%), Argentina (10.8%) and Brazil (11.0%). [1]

The difference matters at a shortlist scale. Colombia records 5.7 nano profiles for every micro profile; Argentina records 9.1 and Brazil 8.9. A search of the same size therefore returns proportionally more micro creators in Colombia, Peru or Mexico than in Argentina or Brazil. [1]
Market

Nano

Micro

Macro

Mega

10,000+ followers

Nano per micro profile

Brazil

88.8%

9.9%

1.02%

0.07%

11.0%

8.9

Argentina

89.0%

9.8%

0.99%

0.05%

10.8%

9.1

Mexico

85.1%

12.9%

1.72%

0.13%

14.8%

6.6

Colombia

83.3%

14.7%

1.87%

0.11%

16.7%

5.7

Chile

86.8%

12.0%

1.05%

0.04%

13.1%

7.2

Venezuela

84.5%

13.9%

1.49%

0.05%

15.5%

6.1

Dominican Republic

84.6%

13.6%

1.59%

0.08%

15.3%

6.2

Peru

83.6%

14.4%

1.72%

0.09%

16.2%

5.8

Ecuador

86.2%

12.4%

1.24%

0.05%

13.7%

7.0

Paraguay

88.0%

10.9%

0.89%

0.02%

11.9%

8.0

All 20 markets

88.0%

10.7%

1.12%

0.07%

11.9%

8.2

Source: [1]. Ten largest markets by eligible profiles. Tier shares use all eligible profiles in each market; shares may not sum to 100% because a few profiles are not assigned to a tier.

Colombia (16.7%) and Peru (16.2%) have the highest share of eligible Instagram profiles with 10,000+ followers in 2026, against a 20-market figure of 11.9%; Bolivia is lowest at 10.6%.

Figure 27 → Share of eligible Instagram profiles with 10,000+ followers by market, split into micro and macro-plus-mega tiers, with the 20-market figure, 2026. Source: [1].

How many micro, macro and mega influencers are there outside Brazil?

753,641 micro, 82,354 macro and 4,333 mega profiles across the other 19 markets. Argentina leads micro (185,782), ahead of Mexico (134,230) and Colombia (122,858); Argentina also leads macro (18,742), narrowly ahead of Mexico (17,879) and Colombia (15,646), while Mexico leads mega (1,374), ahead of Argentina (908) and Colombia (891). [1]

Brazil is under-represented in the middle of the ladder. It holds 66.2% of all eligible profiles and 66.8% of nano profiles, but 61.7% of micro and 60.1% of macro profiles, before rising again to 66.4% of mega profiles. Outside Brazil, micro profiles are 12.1% of eligible profiles, against 9.9% in Brazil. [1]
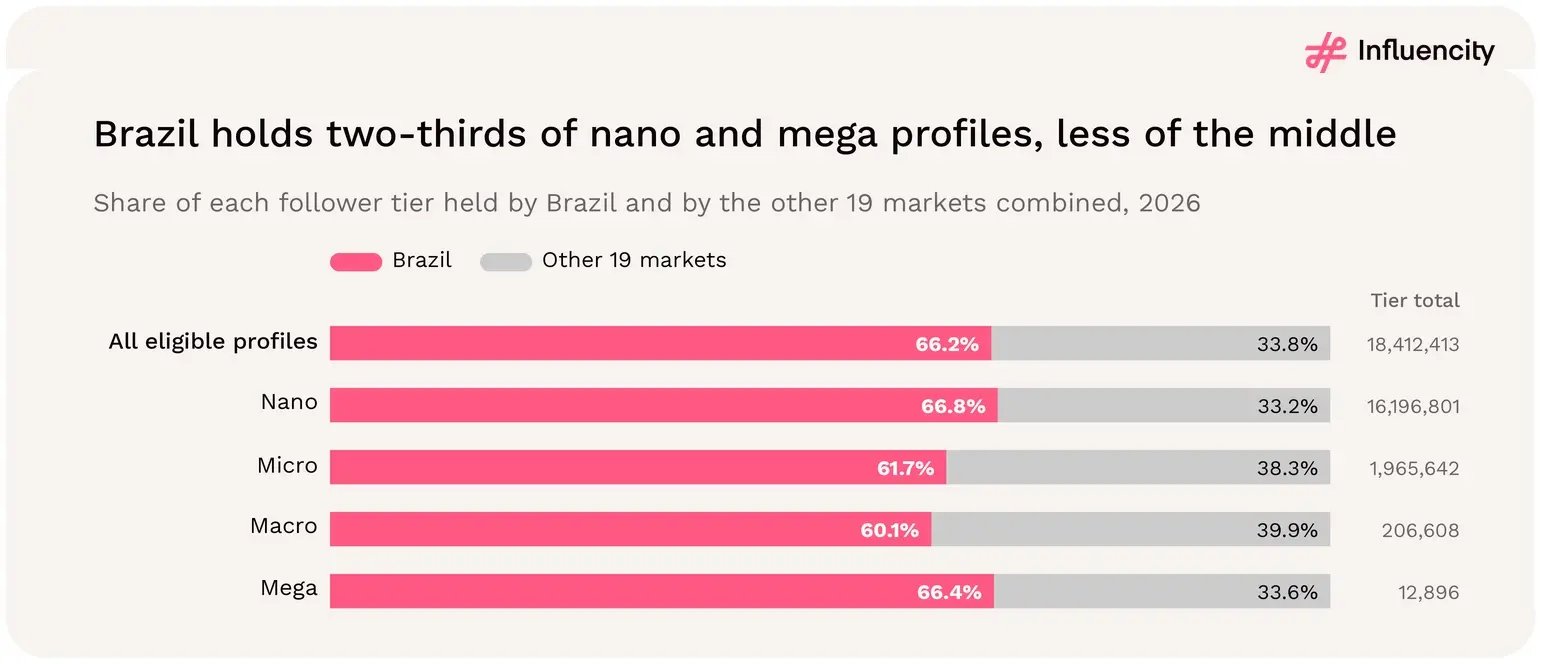
Brazil holds 66.2% of all eligible LATAM Instagram profiles in 2026, including 66.8% of nano and 66.4% of mega profiles, but a smaller share of micro (61.7%) and macro (60.1%) tiers.

Figure 28 → Share of each follower tier held by Brazil and by the other 19 markets combined, with tier totals, 2026. Source: [1].

How scarce are mega-tier Instagram influencers in LATAM?

Very. The 12,896 profiles with 1M+ followers are 0.07% of eligible profiles, or one for every 1,428. Brazil (8,563), Mexico (1,374), Argentina (908), Colombia (891) and Chile (238) hold 92.9% of them. Ten markets record fewer than 50 mega profiles and seven fewer than 20, including Nicaragua (1) and Cuba (2). [1]
How should brands use follower-tier data?

  • Plan nano-led programmes for volume. Nano profiles make up more than 83% of eligible profiles in every market, so programmes built on many small creators can draw on the deepest pools: 16.2M profiles across the region. [1]
  • Treat micro creators as the main mid-tier pool. The region records 1,965,642 micro profiles, 753,641 of them outside Brazil, compared with 219,504 macro and mega profiles combined. [1]
  • Shortlist macro and mega creators early in small markets. Ten markets have fewer than 50 mega profiles, so briefs that need 1M+ reach in smaller markets such as Uruguay, Paraguay, Bolivia or most of Central America may need cross-border creators. [1]
  • Compare tier mix within the market in scope. Colombia's 16.7% share above 10,000 followers and Argentina's 10.8% mean that the same search volume yields a different tier profile in each. [1]
  • Treat tiers as follower bands, not performance grades. The data does not measure engagement, cost or conversion; the category evidence below is a starting hypothesis to test, not a LATAM-wide result.

LATAM's Instagram creator pool is a steep pyramid: nearly nine in ten eligible profiles are nano, about one in eight has 10,000+ followers and fewer than one in 1,000 is mega. The shape is similar across markets, but Colombia, Peru, Venezuela and Mexico lean further up the ladder, while mega profiles are concentrated in five markets. Match the tier strategy to the market's actual pool before setting creator counts. [1]

Category evidence on tier performance (US and Mexico)

This data cannot show which tier performs best. Influencity's supplements study, which covers the US and Mexico, found average engagement falling from a reported 57% for creators under 100,000 followers to 24% above 1M, with micro-creators strongest "particularly on TikTok". In the food study (US), micro-creators accounted for more than half of tagged posts. See section 14. [12, 13]

10 → CREATOR NICHES

Which influencer niches are most common on Instagram in LATAM?

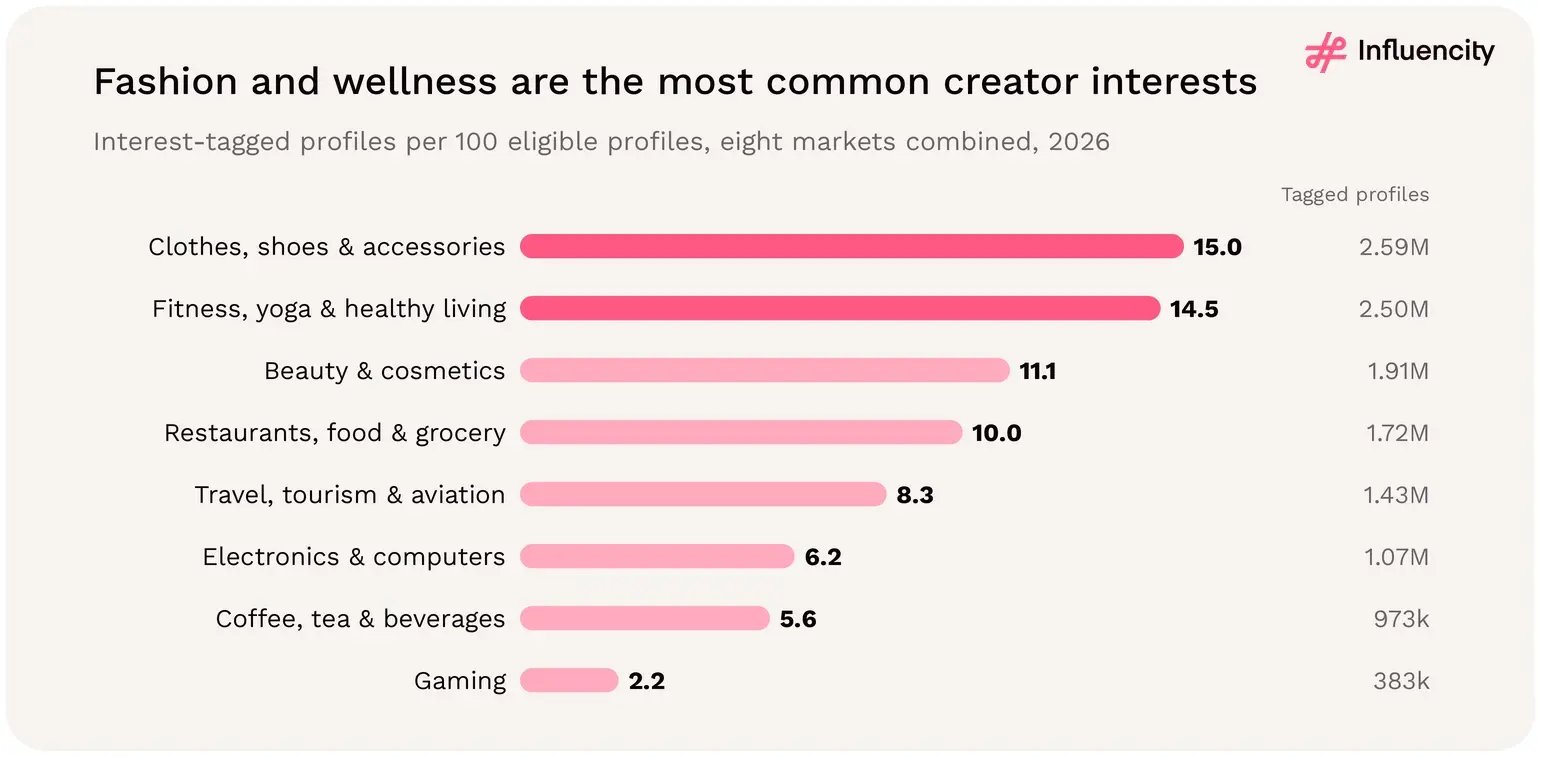
Fashion and wellness are the most common creator interests in every market covered by Influencity's niche data. Across eight markets that hold 93.7% of eligible LATAM profiles, 2.59M profiles are tagged with clothes, shoes, handbags and accessories (15.0 per 100 eligible profiles) and 2.50M with fitness, yoga and healthy lifestyle (14.5). Beauty and cosmetics (1.91M) and restaurants, food and grocery (1.72M) follow. [1, 14]

How to read the niche data

  • Interests overlap. One profile can carry several interest tags, so tags cannot be added up into a niche total or a share of creators. In Mexico, Chile and Venezuela the eight interests sum to more than the market's eligible profiles (114, 102 and 106 tags per 100 profiles). Each figure reads as profiles tagged with that interest.
  • Eight markets, not twenty. The tables cover Brazil, Argentina, Mexico, Colombia, Chile, Venezuela, Paraguay and Uruguay: 17,250,720 of 18,412,413 eligible profiles. Peru, Ecuador, the Dominican Republic and nine smaller markets are not included.
  • Unclassified is not a gender. The source tables label a third column “gender neutral”. Consistent with the rest of this study, it is shown as unclassified: profiles without a male or female classification, not a gender identity.
  • Supply, not performance. Interest tags describe what creators post about. They do not measure engagement, audience interests, pricing or campaign results.

Interest

Niche

Tagged profiles

Per 100 eligible profiles

Female share, classified

Unclassified share

Clothes, shoes, handbags & accessories

Fashion

2,588,305

15.0

64.5%

30.9%

Fitness & yoga + healthy lifestyle

Wellness

2,496,320

14.5

57.6%

25.2%

Beauty & cosmetics

Beauty

1,908,827

11.1

77.5%

19.9%

Restaurants, food & grocery

Food

1,724,798

10.0

59.7%

39.4%

Travel, tourism & aviation

Travel

1,428,176

8.3

53.1%

22.6%

Electronics & computers

Gaming & Tech

1,070,249

6.2

43.1%

33.1%

Coffee, tea & beverages

Food

972,945

5.6

57.6%

36.0%

Gaming

Gaming & Tech

382,830

2.2

37.5%

34.7%

Source: [14]; per-100 values use the 17,250,720 eligible profiles in the eight markets [1]. Rows overlap and must not be summed. Benchmarks for all eligible profiles in the eight markets: female share of classified 61.3%, unclassified 25.1%.

Clothes, shoes and accessories (15.0) and fitness, yoga and healthy living (14.5) are the most common interests per 100 eligible Instagram profiles across eight LATAM markets in 2026; gaming is 2.2.

Figure 29 → Interest-tagged profiles per 100 eligible profiles across the eight markets with niche data. Interests overlap; values do not add up. Sources: [1, 14].

Fashion and wellness lead in every market

Clothes, shoes, handbags and accessories is the largest interest in six of the eight markets. Fitness, yoga and healthy lifestyle is first in Mexico (223,497 tagged profiles) and Chile (112,778), with fashion a close second in both. Gaming is the smallest interest everywhere. [14]

Tagging intensity differs widely: from 47 interest tags per 100 eligible profiles in Paraguay to 114 in Mexico. Comparing tag counts across markets would therefore mix niche popularity with tagging depth. Each interest's share of a market's tags removes that effect, and on that basis the mix is notably stable: fashion takes 17.7%–21.1% of tags in every market and wellness 17.2%–20.7%. [1, 14]
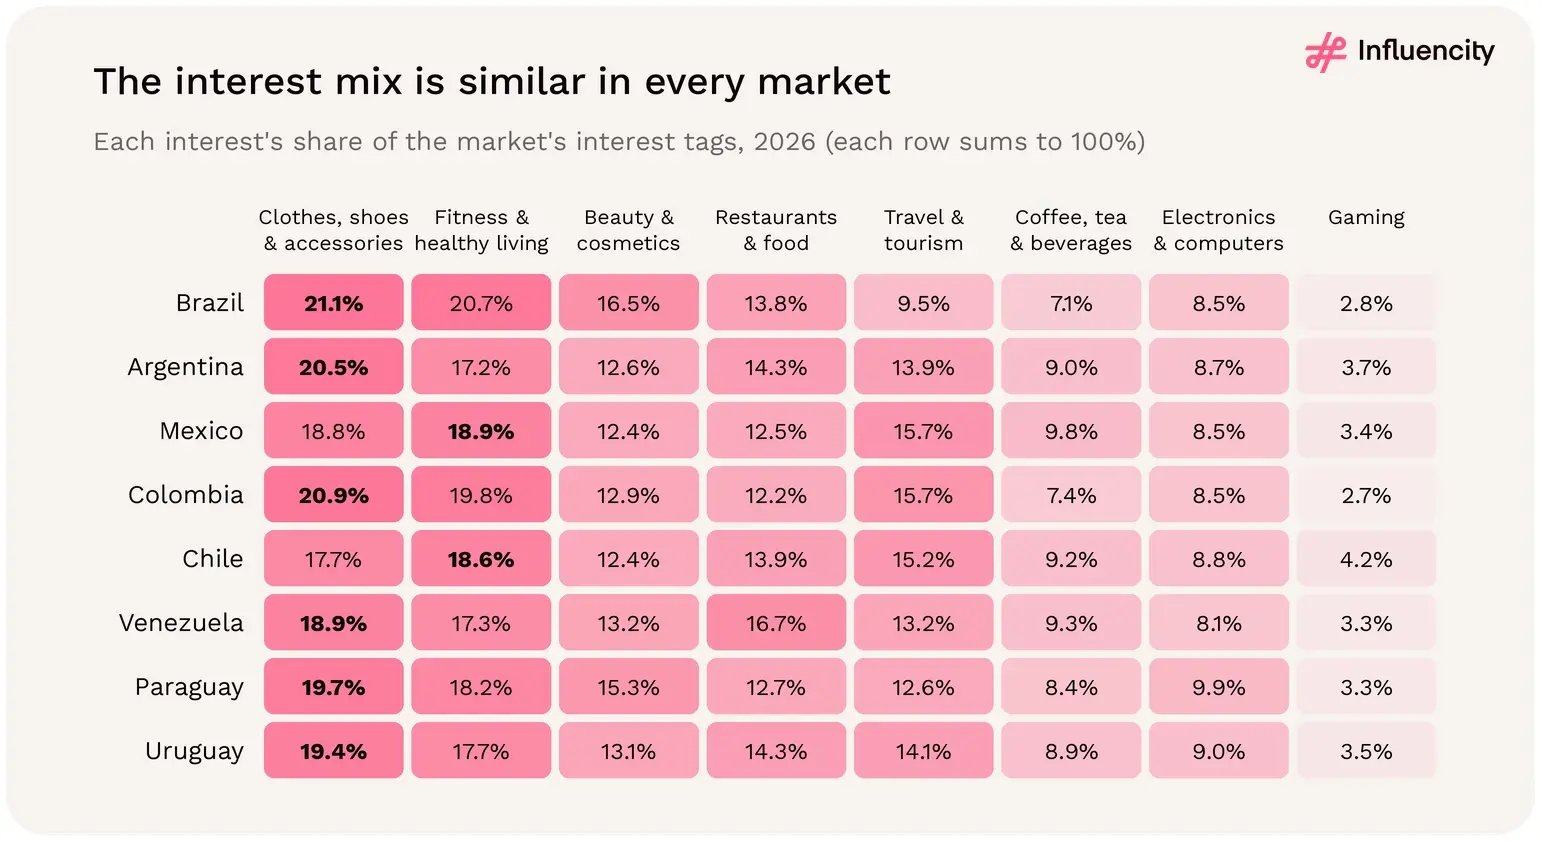
The Instagram interest mix is similar across eight LATAM markets in 2026: clothes, shoes and accessories or fitness leads everywhere, at 18.6% to 21.1% of tags, while gaming stays between 2.7% and 4.2%.

Figure 30 → Interest mix by market: each interest's share of the market's interest tags (rows sum to 100%). Bold marks each market's largest interest. Source: [14].

Market

Eligible profiles

Interest tags per 100 profiles

Largest interest (tagged profiles)

Second interest

Most above eight-market mix

Brazil

12,182,215

67

Fashion (1,729,135)

Fitness & wellness (1,689,186)

Beauty (+1.3 pp)

Argentina

1,901,646

63

Fashion (245,893)

Fitness & wellness (206,178)

Travel (+2.6 pp)

Mexico

1,037,320

114

Fitness & wellness (223,497)

Fashion (222,629)

Travel (+4.4 pp)

Colombia

837,150

97

Fashion (169,908)

Fitness & wellness (160,856)

Travel (+4.4 pp)

Chile

597,646

102

Fitness & wellness (112,778)

Fashion (107,473)

Travel (+3.9 pp)

Venezuela

407,690

106

Fashion (81,986)

Fitness & wellness (75,163)

Restaurants & food (+3.0 pp)

Paraguay

161,006

47

Fashion (14,977)

Fitness & wellness (13,787)

Electronics (+1.4 pp)

Uruguay

126,047

67

Fashion (16,304)

Fitness & wellness (14,875)

Travel (+2.8 pp)

Sources: [1, 14]. "Most above eight-market mix" compares each interest's share of the market's tags with its share of all tags in the eight markets, in percentage points.

Brazil leans to beauty; travel is more prominent elsewhere

Brazil accounts for 70.6% of eligible profiles in the eight markets and holds between 54.3% (travel) and 70.8% (beauty) of each interest's tags. Beauty takes 16.5% of Brazil's interest tags against 12.7% in the other seven markets combined, the largest positive gap. Travel takes 9.5% against 14.8%, the largest negative one, and is the third-largest interest in Mexico, Colombia and Chile. [1, 14]
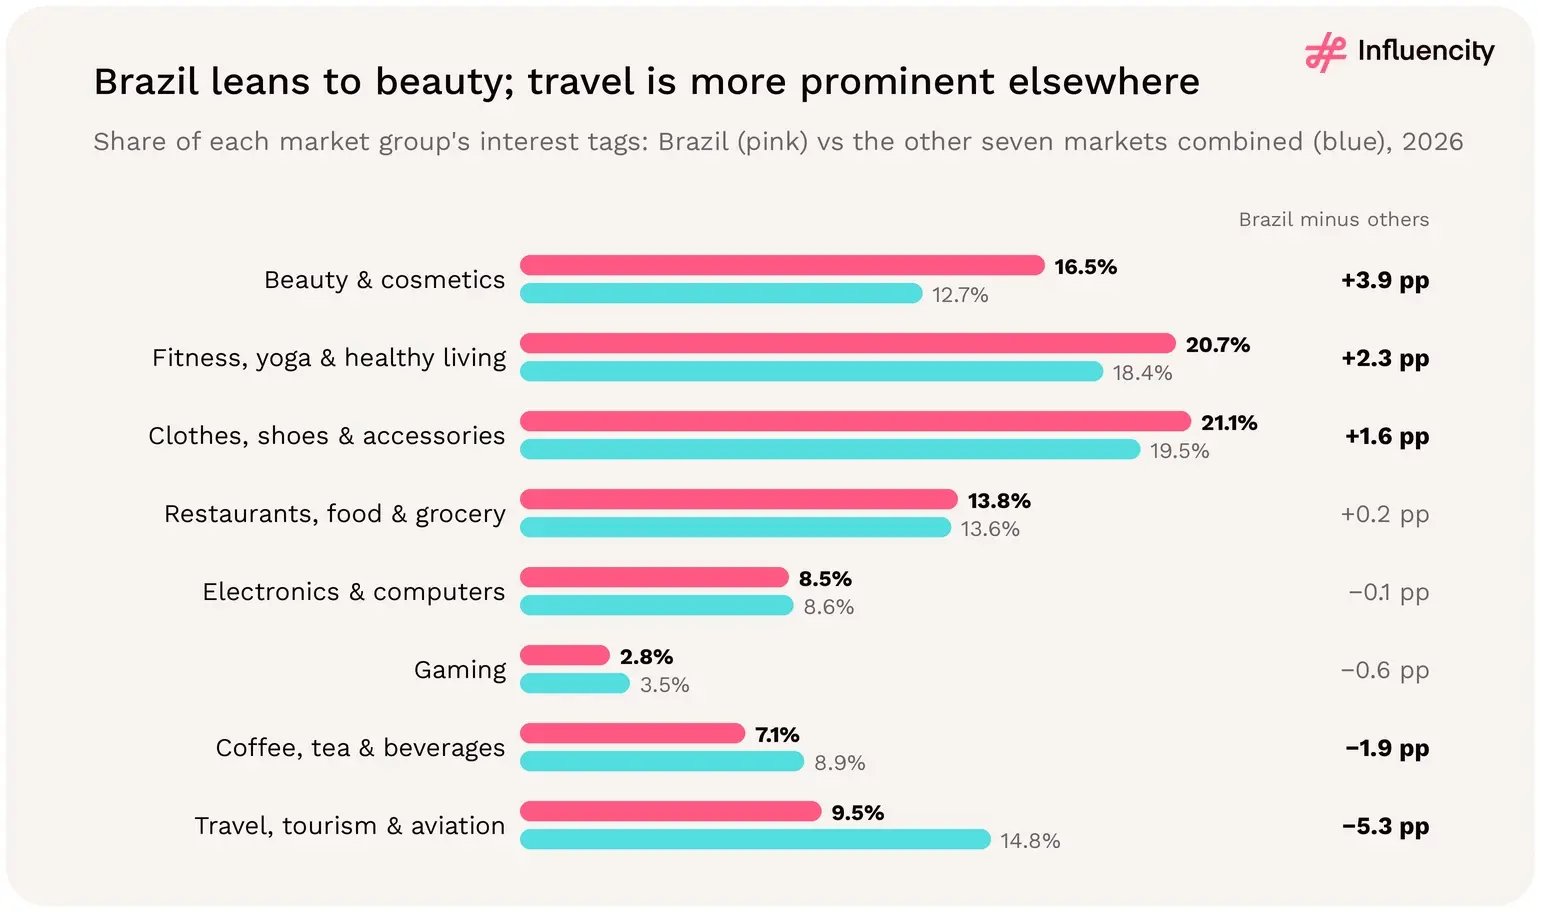
Beauty and cosmetics take 16.5% of Brazil's Instagram interest tags versus 12.7% in the other seven markets (+3.9 pp), while travel is 9.5% in Brazil against 14.8% elsewhere (-5.3 pp).

Figure 31 → Share of interest tags in Brazil versus the other seven markets combined, with the difference in percentage points. Source: [14].

Gender patterns differ sharply by interest

Beauty is the most female-skewed interest: 77.5% of its male/female-classified profiles are female, against 61.3% for all eligible profiles in the same eight markets, and it is above 69% in every market. Gaming (37.5% female) and electronics and computers (43.1%) are the only interests with male majorities across the eight markets combined, and they are male-majority in every market. Travel is closest to parity (53.1%) and tips male in Colombia (49.2% female). [1, 14]
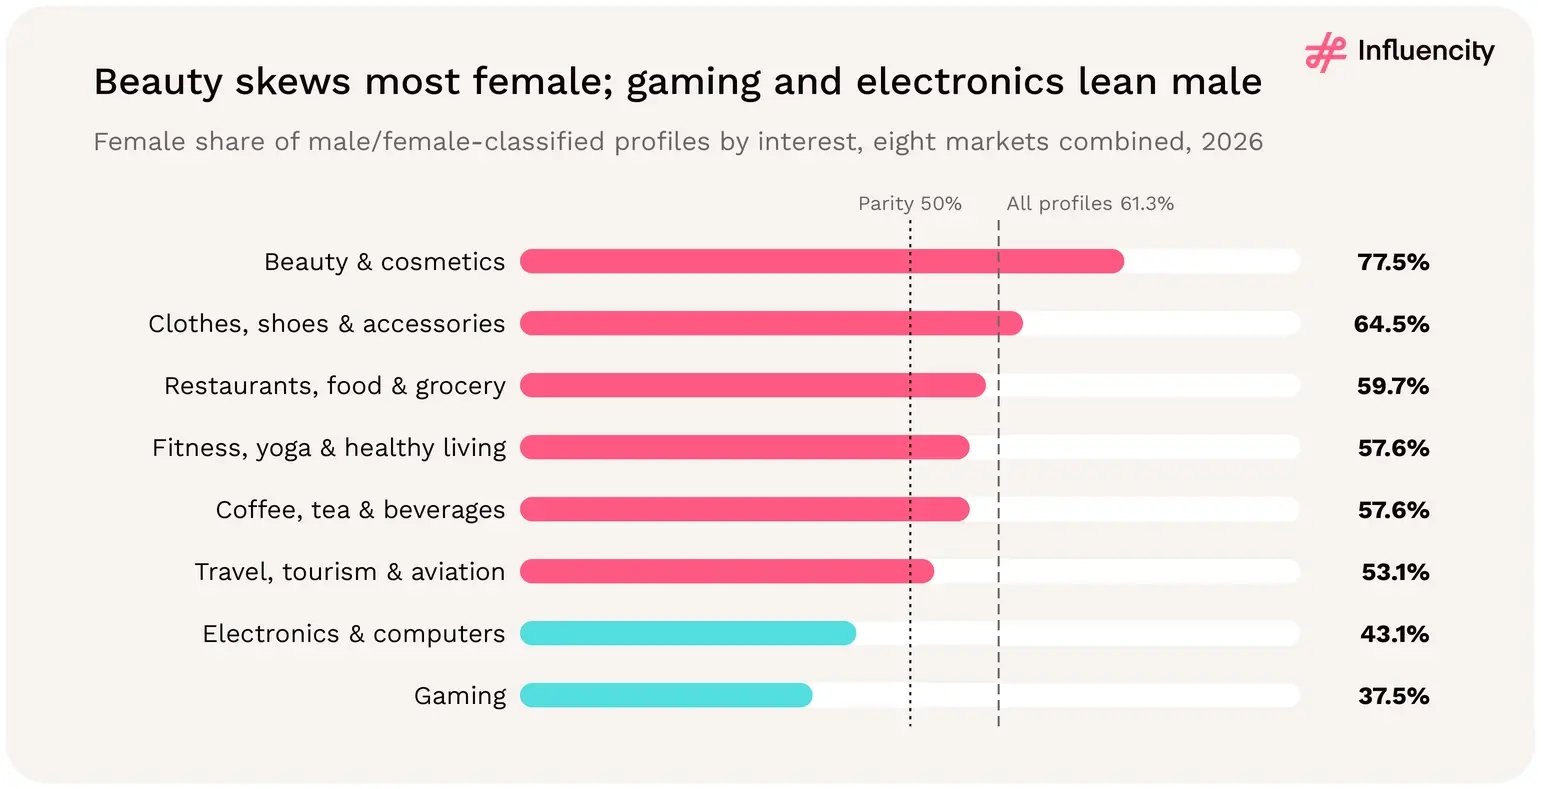
Beauty and cosmetics is the most female interest among classified LATAM Instagram profiles at 77.5%, against 61.3% for all profiles; electronics (43.1%) and gaming (37.5%) lean male.

Figure 32 → Female share of male/female-classified profiles by interest, eight markets combined, with the all-profile benchmark (61.3%) and parity. Unclassified profiles excluded. Sources: [1, 14].

Unclassified shares also vary. Restaurants, food and grocery has the highest (39.4% of tagged profiles, and 35.4%–53.1% by market), against 25.1% for all eligible profiles in the eight markets; beauty has the lowest (19.9%). Unclassified records may include venue, business or brand-run accounts as well as individuals whose gender was not classified. The data cannot separate the two, so food-led rosters need an account-type check. [1, 14]

What do Instagram male and female influencers post the most about?

Fitness and wellness is the top interest for male-classified creators: it holds 22.4% of their interest tags, ahead of fashion (18.0%) and travel (14.7%). Female-classified creators lead with beauty (22.0%) and fashion (21.4%), with wellness close behind (20.0%). Relative to women's mix, gaming is 2.54 times as prominent in men's tags, electronics 2.01 times and travel 1.35 times, while beauty is less than half as prominent (0.44 times). [14]
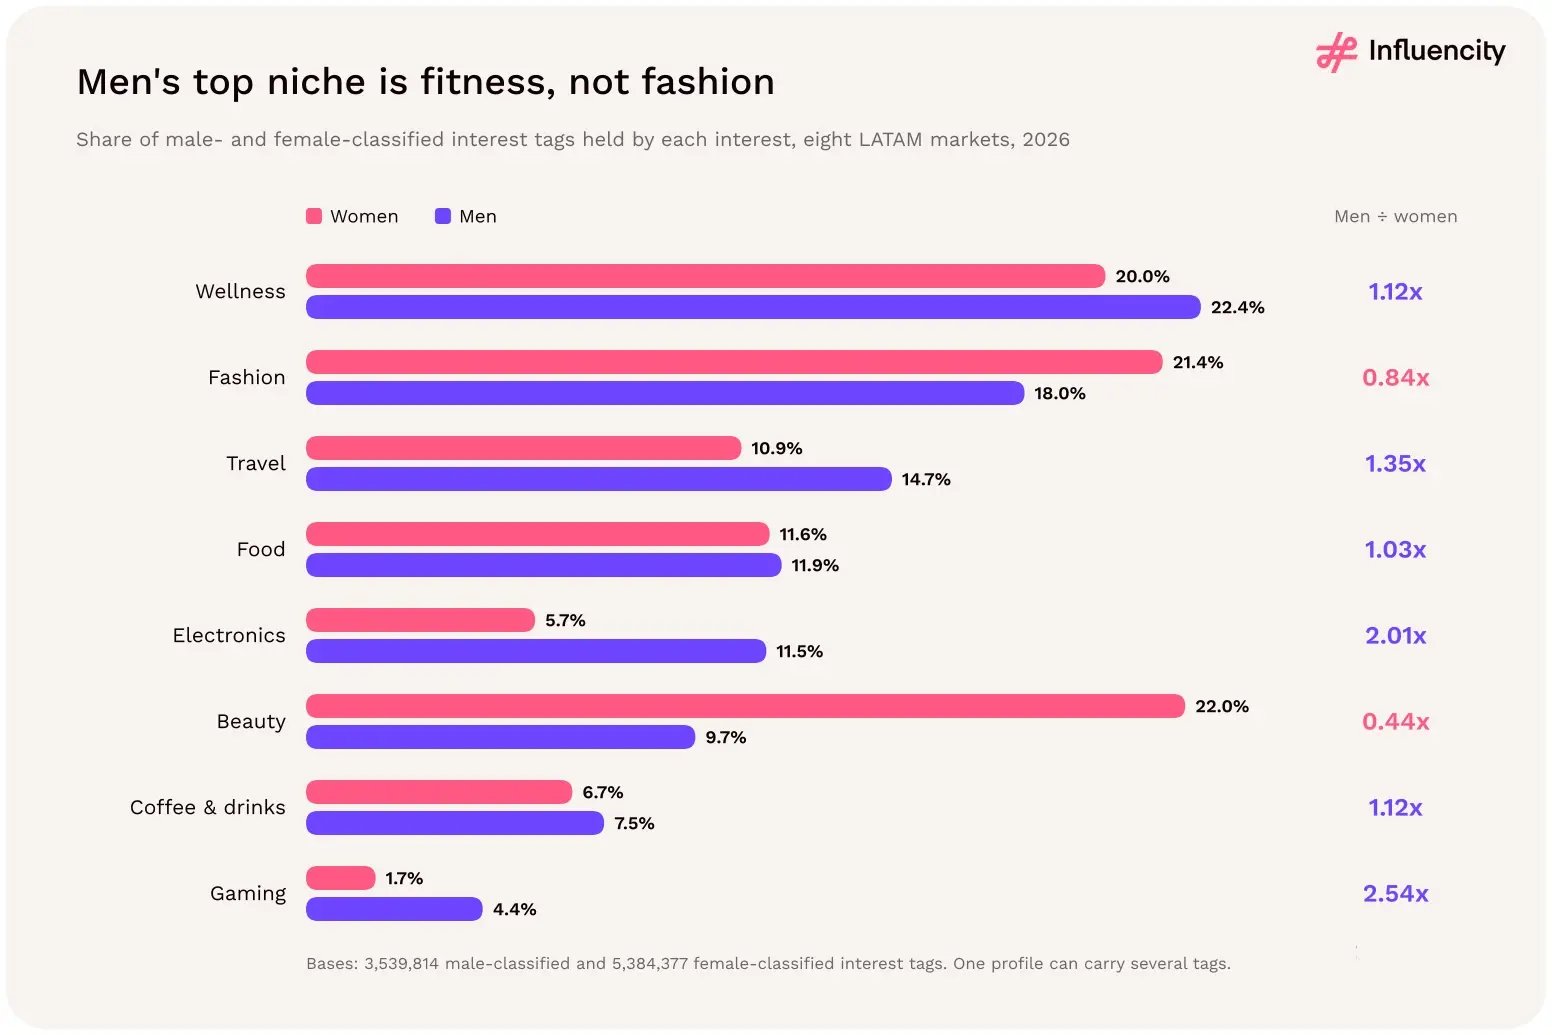
Wellness is men's top Instagram niche in eight LATAM markets at 22.4% of male-classified tags, ahead of fashion at 18.0%; beauty holds 22.0% of female tags but 9.7% of male tags.

Figure 33 → Share of male- and female-classified interest tags held by each interest, eight markets combined, with the ratio of the two shares. Tags overlap. Source: [14].

Shares and pool sizes tell different stories. The eight markets record 344,613 male-classified beauty profiles, 2.2 times the male gaming pool (156,390), as well as 93,761 female-classified gaming profiles and 308,462 female electronics profiles. Brands casting against type, such as male beauty or female tech creators, therefore have pools in the tens to hundreds of thousands, about two-thirds of them in Brazil (67.4% of male beauty and 62.9% of female gaming profiles). [14]

Interest

Male-classified profiles

Share of male tags

Female-classified profiles

Share of female tags

Men ÷ women

Fitness & wellness

791,970

22.4%

1,076,212

20.0%

1.12x

Fashion

635,941

18.0%

1,153,355

21.4%

0.84x

Travel

518,584

14.7%

586,195

10.9%

1.35x

Restaurants & food

420,974

11.9%

624,201

11.6%

1.03x

Electronics & computers

407,445

11.5%

308,462

5.7%

2.01x

Beauty & cosmetics

344,613

9.7%

1,183,616

22.0%

0.44x

Coffee, tea & beverages

263,897

7.5%

358,575

6.7%

1.12x

Gaming

156,390

4.4%

93,761

1.7%

2.54x

Source: [14], Appendix D. Shares use all male-classified (3,539,814) and female-classified (5,384,377) interest tags in the eight markets; one profile can carry several tags, so profile counts overlap across rows. Men ÷ women = share of male tags divided by share of female tags.

Which markets have the most male-leaning creator niches?

Colombia. It records the lowest female share of classified profiles in all eight interests, from 33.4% in gaming to 70.3% in beauty, and wellness (50.4%), coffee and beverages (50.9%) and food (51.5%) are close to parity there. Brazil is at the other end: it has the highest female share in five of the eight interests, and across all interest tags its female share is 62.7%, against 52.8% in Colombia. [14]
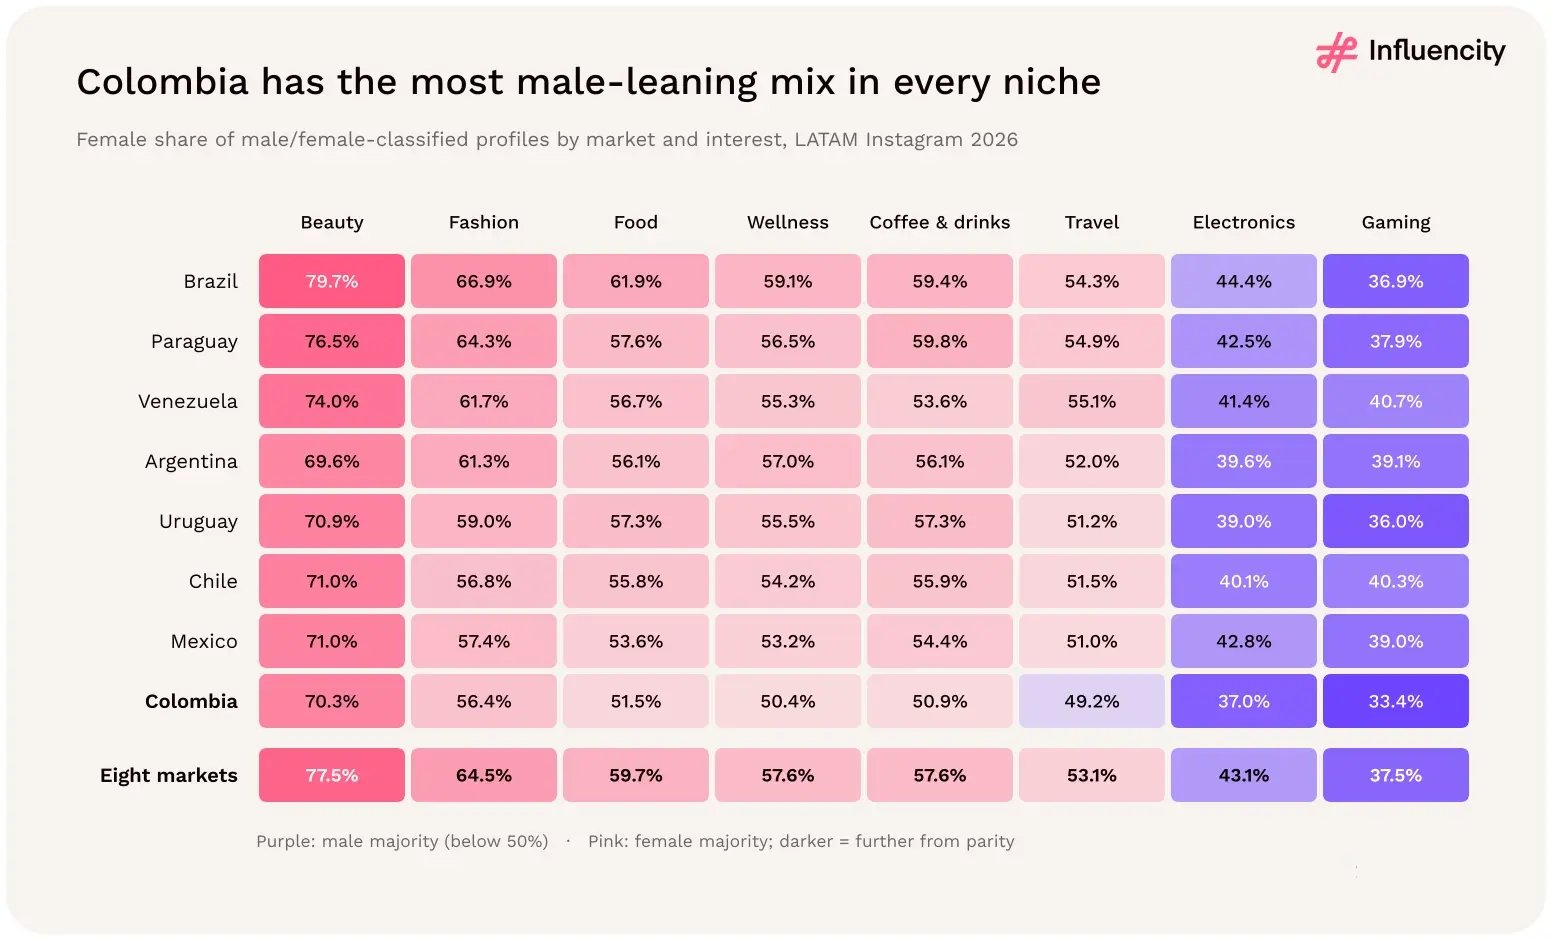
Colombia has the most male-leaning mix in every interest among eight LATAM markets, with travel at 49.2% female and gaming at 33.4%; Brazil's beauty niche is the most female at 79.7%.

Figure 34 → Female share of male/female-classified profiles by market and interest, with the eight-market total. Unclassified profiles excluded. Source: [14].

The ranking is broadly consistent across niches, which points to a market effect on top of the niche effect. Outside Brazil, the female share is 3.0 to 8.8 points lower than in Brazil in every interest except gaming, where Brazil (36.9% female) is slightly more male than the other seven markets combined (38.5%). Beauty is female-majority in every market (69.6%–79.7%) and gaming and electronics are male-majority in every market, so the direction of each niche's skew holds everywhere; only its size changes. [14]
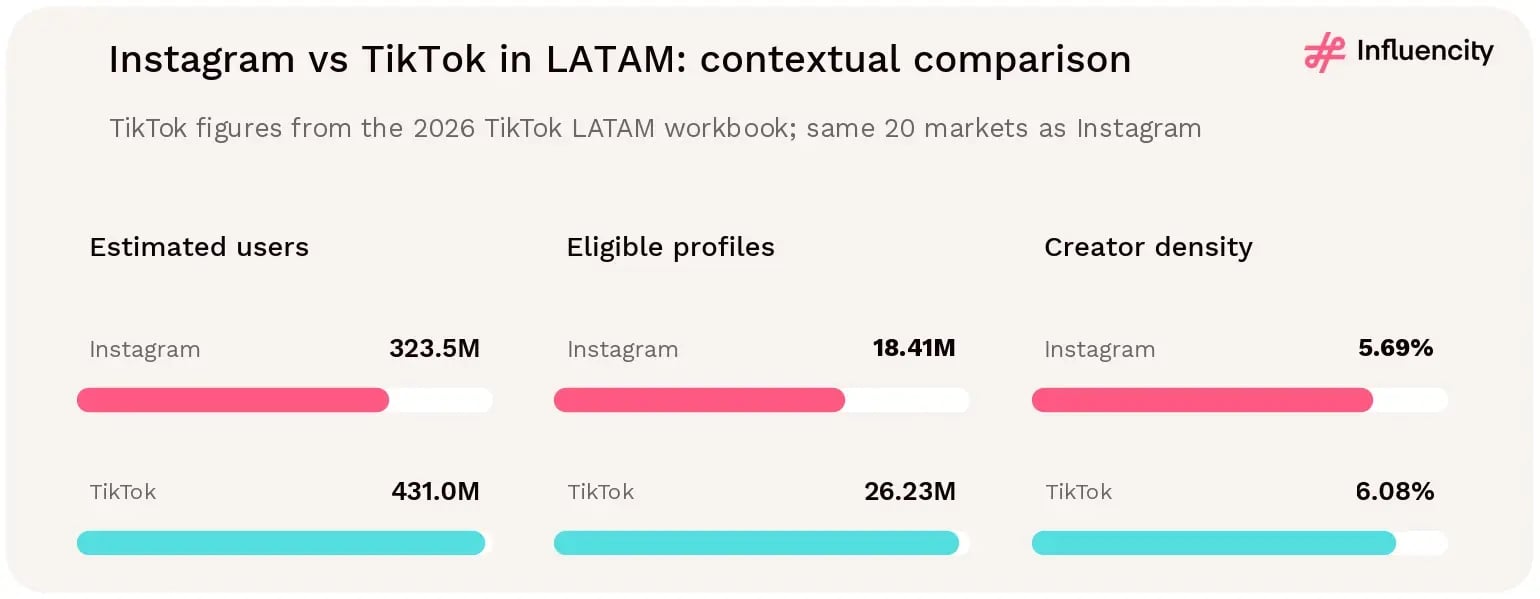
What this means for brands and agencies

  • Deepest pools. Fashion and wellness briefs can draw on the largest recorded pools in every covered market; even Paraguay and Uruguay have between 13,787 and 16,304 profiles tagged with each.
  • Brazil for beauty. Brazil holds 1,351,853 beauty-tagged profiles, 70.8% of the eight-market beauty pool. Spanish-speaking markets need separate, smaller beauty rosters.
  • Travel outside Brazil. Travel and tourism are proportionally stronger in Mexico, Colombia and Chile than in Brazil, which matters for tourism boards, airlines and hospitality brands planning regional programmes.
  • Plan gender mix by category. Gaming and electronics pools are male-majority in every market; beauty pools are heavily female. Set gender goals deliberately rather than assuming the regional female majority.
  • Cast against type where the pools allow. The eight markets hold 344,613 male-classified beauty profiles and 93,761 female-classified gaming profiles, enough for dedicated rosters, most of them in Brazil.
  • Adjust gender targets in Colombia. Colombia has the most male-leaning mix in every interest, so gender targets copied from Brazil, where female shares run highest, will be harder to meet.
  • Tags are a starting filter. Confirm content, audience location and account type at creator level. Influencity's category studies (section 14) add US and Mexico evidence on food and wellness creators. [12, 13]

11 → CROSS-PLATFORM COMPARISON

How does Instagram compare with TikTok in Latin America?

Influencity's 2026 TikTok LATAM dataset, which covers the same 20 markets, records a larger audience estimate and a larger eligible-profile pool than Instagram. However, its creator-density advantage is modest: 6.08% versus Instagram's 5.69%, a gap of 0.39 percentage points. [1, 2]

Instagram and TikTok at a glance

  • TikTok has the larger pool in 16 of 20 markets. Instagram records more eligible profiles only in Brazil, Argentina, Puerto Rico and Cuba. [1, 2]
  • Outside Brazil, TikTok's pool is 2.6 times Instagram's. The other 19 markets record 16,245,574 eligible TikTok profiles, against 6,230,198 on Instagram. [1, 2]
  • TikTok supply is far less concentrated. Brazil holds 38.1% of eligible TikTok profiles, against 66.2% on Instagram, and the five largest TikTok markets hold 73.3% of the pool, against 89.9%. [1, 2]
  • Mexico is TikTok's second-largest market. Its 3,793,376 eligible TikTok profiles are 3.66 times its Instagram pool, and it records 3,831 mega TikTok profiles, against 1,374 on Instagram. [1, 2]
  • The follower-tier shape is almost identical. 11.3% of TikTok profiles and 11.9% of Instagram profiles have 10,000+ followers; nano profiles account for 88.6% and 88.0% respectively. [1, 2]

Platform

Estimated users

Eligible profiles

Creator density

Instagram

323.5M

18.41M

5.69%

TikTok

431.0M

26.23M

6.08%

Across the same 20 LATAM markets in 2026, TikTok has 431.0 million estimated users and 26.23 million eligible profiles, versus 323.5 million and 18.41 million on Instagram; density is 6.08% vs 5.69%.

Figure 35 → Cross-platform scale and density comparison for the same 20 markets. Sources: [1, 2].

Why is TikTok's density advantage so small in LATAM?

TikTok has 42.4% more eligible profiles (26,226,153) and 33.2% more estimated users (431,043,500) than Instagram, so its density is only 1.07 times Instagram's. That is strikingly different from the US and Europe, where TikTok's reconciled density is 2.04 and 2.01 times Instagram's and TikTok has fewer estimated users than Instagram. The reason is Brazil: Instagram density there (8.62%) exceeds TikTok density (7.62%), and Brazil's weight pulls the regional ratio close to parity. Excluding Brazil, TikTok's density is 1.58 times Instagram's (5.41% vs 3.42%). [1, 2, 10, 11]

How does the Instagram–TikTok gap vary by market?

Widely. TikTok's eligible-profile pool is largest relative to Instagram's in Nicaragua (13.6 times), Bolivia (13.3), Guatemala (11.9), Honduras (9.8), Peru (8.6) and Ecuador (7.0). Instagram records the larger pool only in Brazil (12.18M vs 9.98M), Argentina (1.90M vs 1.58M), Puerto Rico and Cuba. [1, 2]

Density follows the same pattern. TikTok is denser in 14 of the 19 markets with a comparable TikTok record, peaking in Paraguay (11.14%), the Dominican Republic (9.96%) and Ecuador (9.14%); the widest gap is in Guatemala, at 7.06% against 0.82%. Instagram is denser in Brazil, Argentina, Venezuela, Panama and Puerto Rico. The TikTok data records only 500 estimated users and 172 eligible profiles for Cuba, so Cuba is excluded from market-level platform comparisons; Puerto Rico's TikTok record (4,941 profiles) is also small. [1, 2]
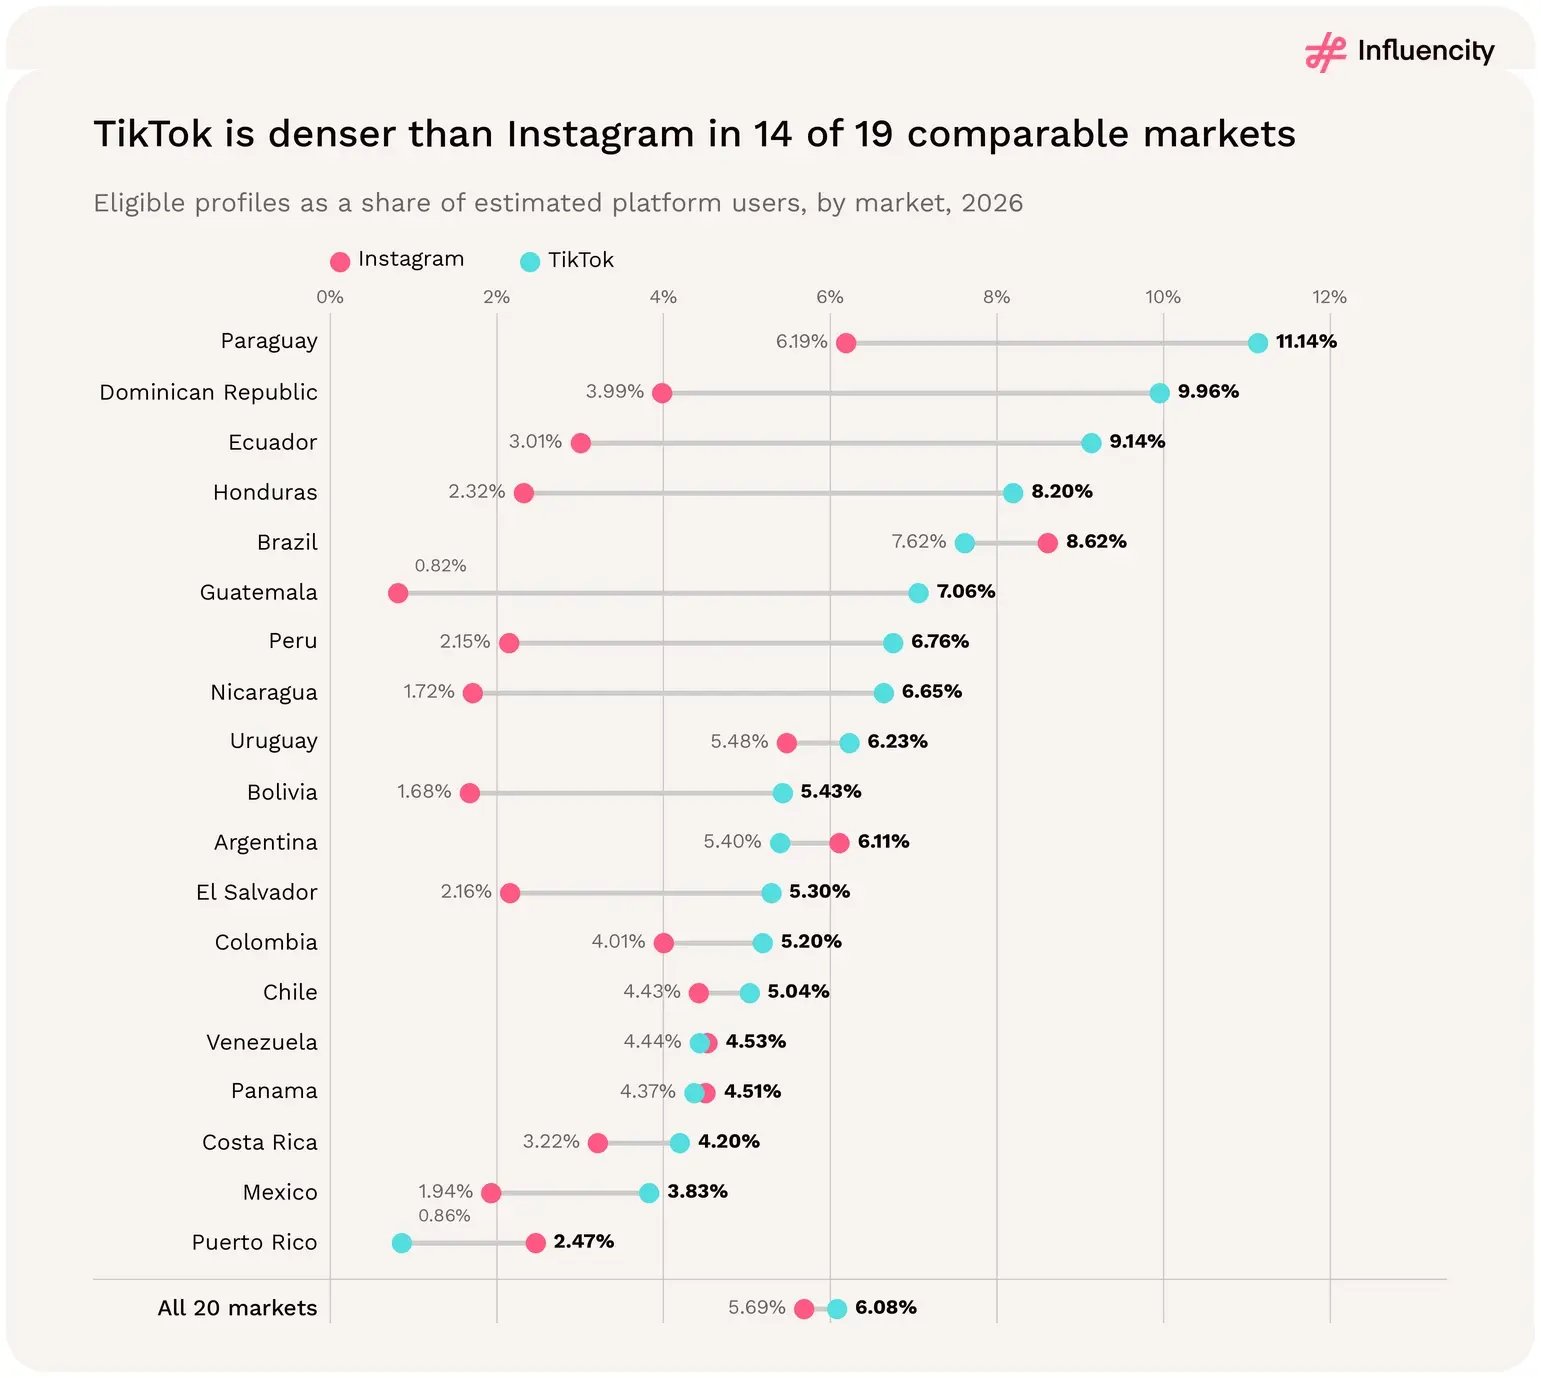
Market

Instagram profiles

TikTok profiles

TikTok ÷ Instagram

Instagram density

TikTok density

Brazil

12,182,215

9,980,579

0.82x

8.62%

7.62%

Mexico

1,037,320

3,793,376

3.66x

1.94%

3.83%

Colombia

837,150

1,958,517

2.34x

4.01%

5.20%

Peru

221,329

1,911,970

8.64x

2.15%

6.76%

Argentina

1,901,646

1,577,061

0.83x

6.11%

5.40%

Ecuador

201,586

1,407,376

6.98x

3.01%

9.14%

Guatemala

69,681

826,255

11.86x

0.82%

7.06%

Chile

597,646

816,106

1.37x

4.43%

5.04%

Dominican Republic

259,163

785,736

3.03x

3.99%

9.96%

Venezuela

407,690

736,867

1.81x

4.53%

4.44%

All 20 markets

18,412,413

26,226,153

1.42x

5.69%

6.08%

Sources: [1, 2]. Ten largest TikTok markets by eligible profiles. Creator density = eligible profiles ÷ estimated users on the same platform; each dataset supplies its own user estimates.

TikTok creator density exceeds Instagram's in 14 of 19 comparable LATAM markets in 2026, led by Paraguay at 11.14%; Brazil is denser on Instagram (8.62% vs 7.62%). All 20 markets: 6.08% TikTok vs 5.69% Instagram.

Figure 36 → Instagram and TikTok creator density by market, with the 20-market figures, 2026. Cuba is excluded. Sources: [1, 2].

How much does Brazil shape each platform's creator pool?

Far less on TikTok. Brazil holds 38.1% of eligible TikTok profiles and 30.4% of estimated TikTok users, against 66.2% and 43.7% on Instagram. Mexico takes up much of the difference: it holds 14.5% of TikTok profiles, 18.4% of TikTok profiles with 10,000+ followers and 23.1% of TikTok mega profiles, against 5.6%, 7.0% and 10.7% on Instagram. [1, 2]

Outside Brazil, TikTok's lead holds at every tier. The other 19 markets record 1,815,646 TikTok profiles with 10,000+ followers and 9,499 mega profiles, about 2.2 times Instagram's 840,328 and 4,333. Instagram records more mega profiles than TikTok only in Brazil (8,563 vs 7,085), Puerto Rico and Cuba. [1, 2]
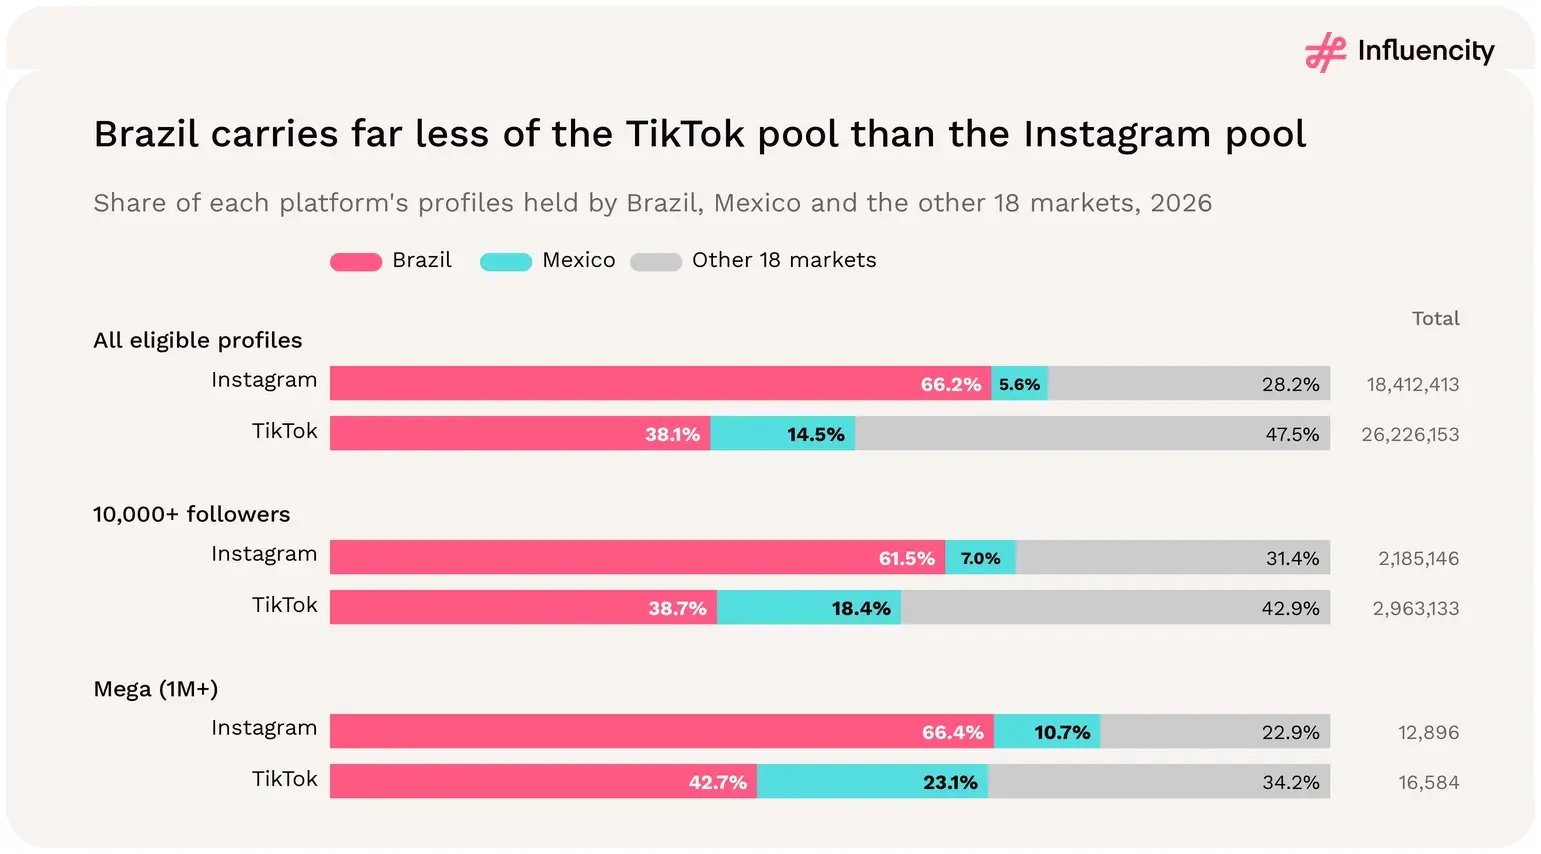
Brazil holds 66.2% of eligible LATAM Instagram profiles in 2026 but only 38.1% on TikTok, while Mexico rises from 5.6% to 14.5%; at mega tier Brazil's share is 66.4% on Instagram and 42.7% on TikTok.

Figure 37 → Share of eligible profiles, profiles with 10,000+ followers and mega profiles held by Brazil, Mexico and the other 18 markets on each platform, 2026. Sources: [1, 2].

Do Instagram and TikTok have the same tier and gender mix in LATAM?

The tier mix, yes; the gender mix, not quite. Nano profiles make up 88.6% of eligible TikTok profiles and 88.0% of Instagram profiles, and 11.3% and 11.9% respectively have 10,000+ followers. Mega profiles are 0.06% of the TikTok pool (16,584) and 0.07% of Instagram's (12,896). [1, 2]

TikTok's classified pool is more female. Women account for 65.9% of male/female-classified TikTok profiles, against 61.2% on Instagram, and TikTok's female share is higher in 18 of the 19 comparable markets, Paraguay being the exception. Among the larger markets, the widest gap is in Colombia (70.0% vs 57.5%). TikTok also has fewer unclassified profiles (15.0% against 25.4%), so part of the gap may reflect classification coverage rather than creator mix. [1, 2]
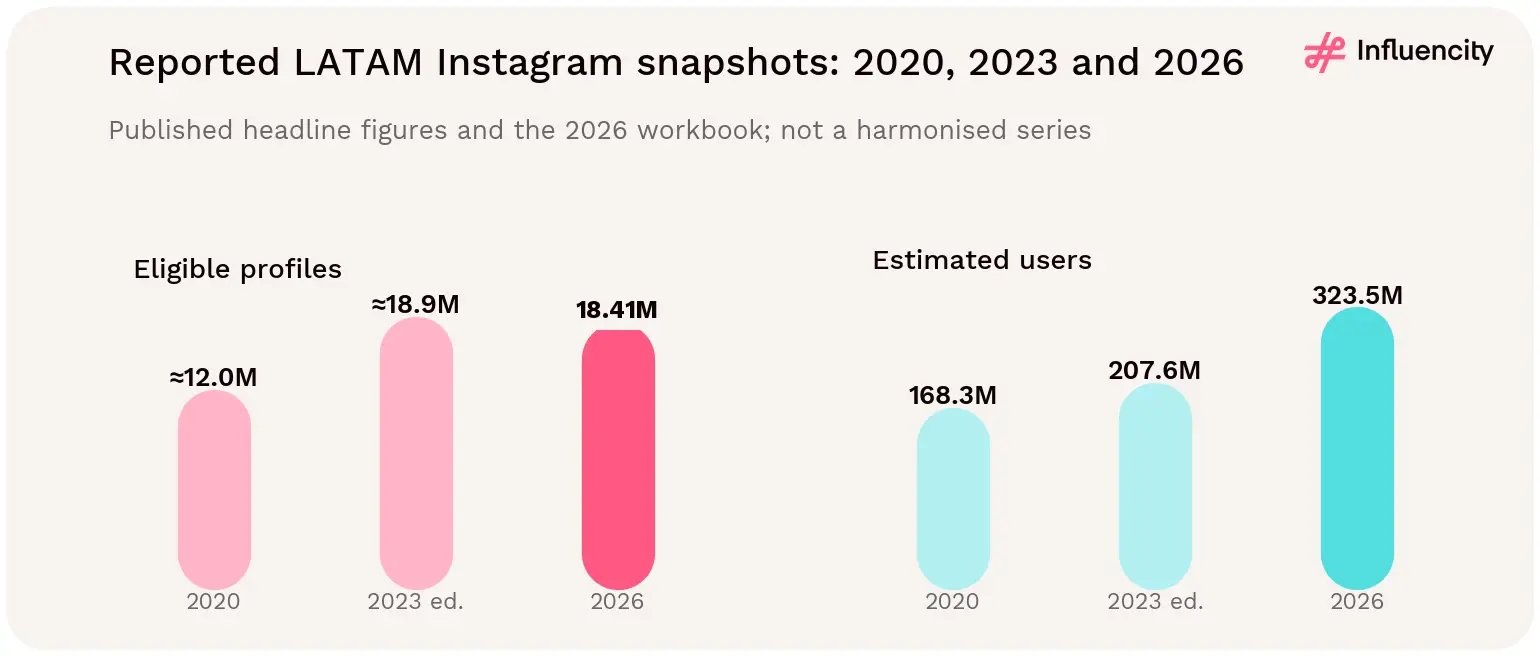
How should brands plan across Instagram and TikTok in LATAM?

  • Use TikTok data to size programmes outside Brazil. The other 19 markets record 2.6 times as many eligible TikTok profiles as Instagram profiles, and about 2.2 times as many with 10,000+ followers. [1, 2]
  • Do not assume TikTok-first in Brazil and Argentina. Both record larger and denser Instagram pools, so platform choice there should follow audience and content fit rather than creator supply. [1, 2]
  • Plan Mexico across both platforms. Mexico has 3.66 times as many eligible TikTok profiles as Instagram profiles and 2.8 times as many mega profiles, and Influencity's supplements study describes Mexican engagement as TikTok-led. [1, 2, 12]
  • Expect the widest TikTok advantage in Central America and the Andes. Guatemala, Honduras, Nicaragua, Bolivia, Peru and Ecuador record 7.0 to 13.6 times as many eligible TikTok profiles as Instagram profiles. [1, 2]
  • Check small TikTok records before planning. Cuba's and Puerto Rico's TikTok figures are too small to support platform comparisons; confirm availability at creator level. [2]
  • Screen each platform separately. Identify overlapping accounts where relevant, and do not add the platform totals to claim unique creators or unique reach.

Instagram and TikTok offer differently shaped creator pools in LATAM. Instagram's is concentrated in Brazil and Argentina; TikTok's is spread more widely, with Mexico, Colombia, Peru and Central America carrying far more weight. The regional density gap is small only because Brazil leans towards Instagram; in most other markets, TikTok offers the deeper pool. Choose the platform market by market, using each platform's own counts. [1, 2]

12 → HISTORICAL CONTEXT

How has the reported Instagram market changed since 2020 and 2023?

The reported audience has nearly doubled since 2020, while the reported creator count has levelled off since 2023. Influencity's 2020 study reported about 12.0M influencers and 168.3M Instagram users; the 2023 study reported 18.9M and 207.6M; the 2026 data records 18.41M profiles and 323.5M estimated users. Beneath the flat headline, supply has shifted away from Brazil: its reported count fell 15.6% between 2023 and 2026, while the rest of the region rose by about 39%. [1, 5, 6]

Published edition

Reported users

Reported profiles

Profiles / users

2020

168.3M

Approx. 12.0M

Approx. 7.13%

2023

207.6M

Approx. 18.9M

Approx. 9.10%

2026

323.5M

18.41M

5.69%

Sources: [1, 5, 6]. Historical ratios are recalculated using the platform-user denominator. Earlier publications also use the term density for profiles / population; those metrics are not interchangeable.

Influencity's published LATAM Instagram snapshots show about 12.0 million eligible profiles in 2020, about 18.9 million in 2023 and 18.41 million in 2026, as estimated users rose from 168.3 to 323.5 million.

Figure 38 → Published historical snapshots, not a harmonised longitudinal series. Sources: [1, 5, 6].

Against the rounded historical headlines, the 2026 profile count is 53.4% above 2020 and 2.6% below the 2023 publication. Estimated users are 92.2% above 2020 and 55.8% above the 2023 publication. These are changes in reported estimates, not proof of organic creator growth or attrition. The pattern resembles the US, whose recorded count also fell after its 2023 edition (−12.3%), and contrasts with Europe (+17.9%). [1, 5, 6, 8, 9]

Where has reported creator supply grown since 2023?

Outside Brazil. Of the eight markets with published 2023 counts, six recorded more profiles in 2026: Mexico (+54.6%, from 670,969 to 1,037,320), Colombia (+30.7%), Peru (+30.4%), Ecuador (+15.9%), Argentina (+8.8%) and Uruguay (+5.2%). Brazil fell from 14.43M to 12.18M (−15.6%) and Chile was broadly flat (−1.6%). As a result, Brazil's share of reported LATAM supply dropped from about 76% in both earlier editions to 66.2% in 2026. [1, 5, 6]
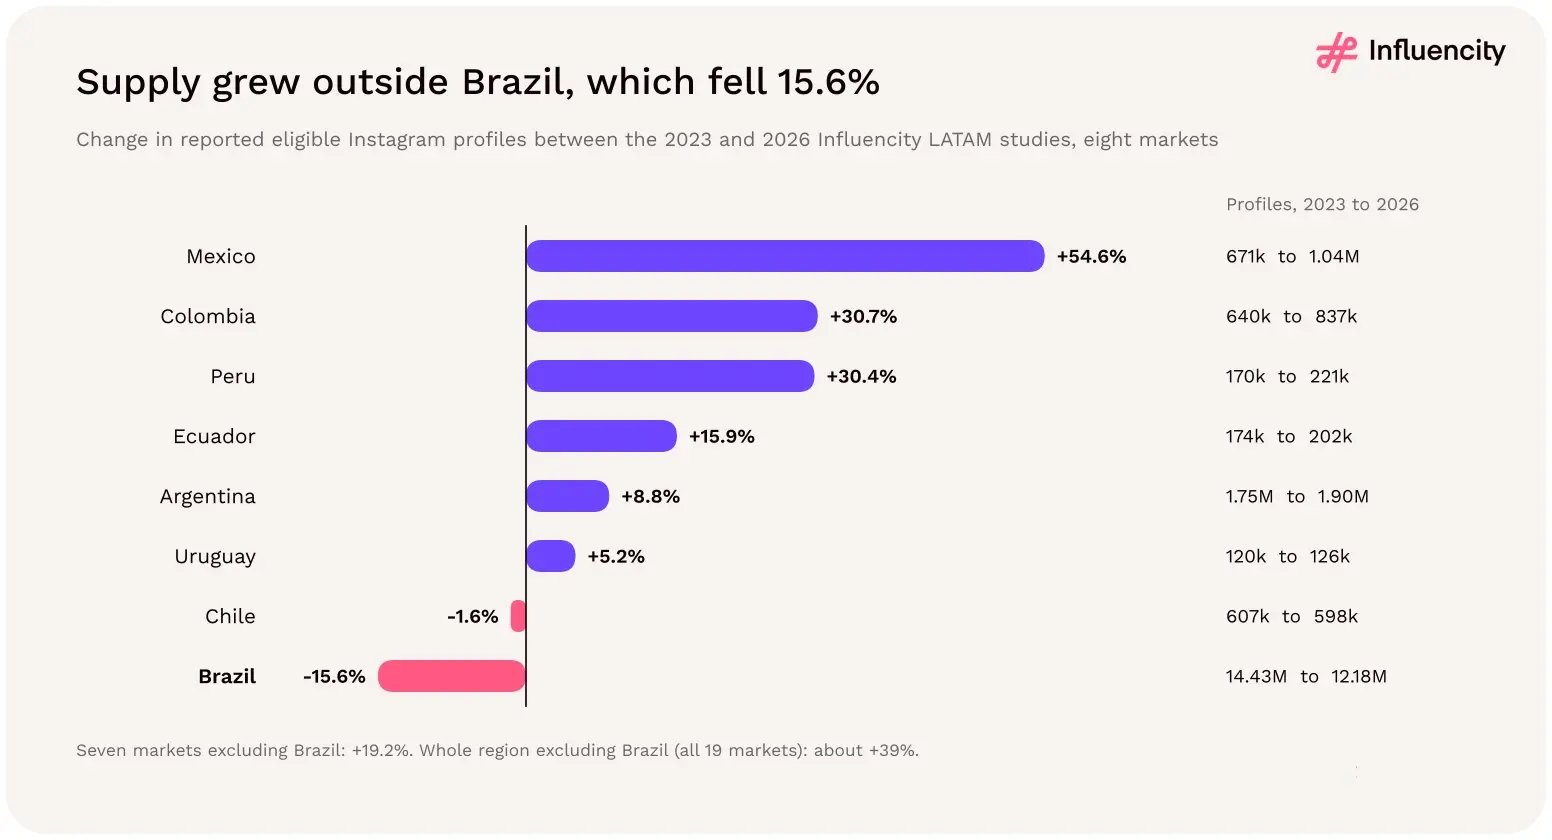
Between the 2023 and 2026 LATAM studies, eligible Instagram profiles grew in Mexico (+54.6%), Colombia (+30.7%) and Peru (+30.4%), while Brazil fell 15.6%, from 14.43 million to 12.18 million.

Figure 39 → Change in reported eligible Instagram profiles between the 2023 and 2026 Influencity LATAM studies, eight markets with published 2023 counts. Sources: [1, 6].

The flat regional headline therefore hides two opposite movements. Excluding Brazil, reported supply rose from about 4.47M profiles in 2023 to 6.23M in 2026, roughly 39%. The 12 smaller markets moved most: by subtraction from the rounded 2023 total, they held about 0.3M profiles then, against 1.31M now. Mexico has also grown fastest over the longer run, from 443,030 profiles in the 2020 edition to 1,037,320 (+134%), against +68% for Argentina and +33% for Brazil. [1, 5, 6]

Market

2020 edition

2023 edition

2026 study

Change 2023–2026

Brazil

9,176,375

14,432,050

12,182,215

−15.6%

Argentina

1,133,686

1,748,417

1,901,646

+8.8%

Mexico

443,030

670,969

1,037,320

+54.6%

Colombia

—

640,431

837,150

+30.7%

Chile

—

607,413

597,646

−1.6%

Peru

—

169,773

221,329

+30.4%

Ecuador

—

173,951

201,586

+15.9%

Uruguay

—

119,808

126,047

+5.2%

Seven markets excl. Brazil

—

4,130,762

4,922,724

+19.2%

Sources: 2020 counts [5]; 2023 counts as published in October 2023 [6]; 2026 counts [1], Appendix A. Editions used different methods and follower bands; changes describe reported estimates, not organic growth or attrition.

What else has changed across the three editions?

Three indicators move consistently. Estimated Instagram reach rose from 26.2% of the population in 2020 to 32% in 2023 and 49.6% in 2026. The creator pool has become less nano-heavy: nano profiles (1,000–10,000 followers) fell from 95.6% to 94.2% and 88.0% of the total, while the micro share (10,000–100,000) rose from 3.7% to 5.4% and then roughly doubled to 10.7%. The female share has stayed close to 62% throughout (62.2%, 62.3% and, among male/female-classified profiles, 61.2%). [1, 5, 6]
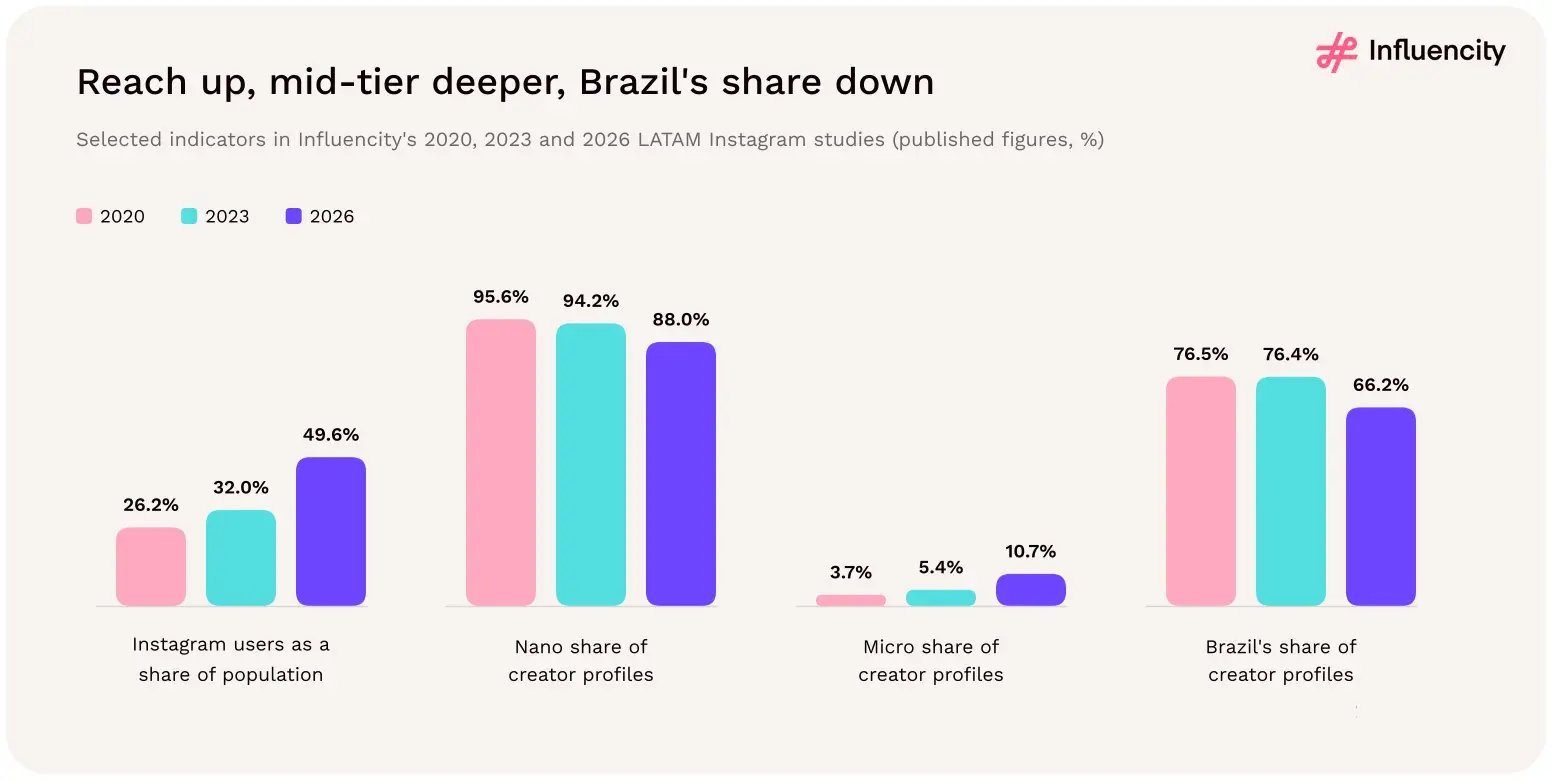
Across the 2020, 2023 and 2026 LATAM studies, Instagram users rose from 26.2% to 49.6% of population, the micro share grew from 3.7% to 10.7%, and Brazil's share of creator profiles fell from 76.5% to 66.2%.

Figure 40 → Selected indicators in Influencity's 2020, 2023 and 2026 LATAM Instagram studies, as published. Follower bands and denominators differ between editions. Sources: [1, 5, 6].

How to use the historical figures

  • Compare ratios, not raw counts. Shares and rates (reach, tier mix, gender split, Brazil's share) travel better between editions than absolute totals, which depend on each edition's eligibility rules.
  • Read Brazil's fall with care. A 15.6% drop in recorded profiles can reflect stricter eligibility or classification as well as real change; it does not by itself show creators leaving the platform.
  • Update benchmarks for the fast risers. Mexico, Colombia and Peru now record 30%–55% more profiles than in 2023, so sourcing targets built on older figures will understate their pools.
  • Plan for a deeper mid-tier. With the micro share now 10.7%, about twice its 2023 level, micro-led programmes have more choice than earlier editions suggest.

13 → REGIONAL COMPARISON

How does LATAM compare with the US and Europe?

Across the three Instagram datasets, the LATAM footprint has the largest recorded creator pool and the highest aggregate creator density: 5.69%, compared with 4.64% in the US and 4.21% in Europe. Its 18.41M profiles are 2.06 times the US count and 1.48 times Europe's. But the ordering reverses when each region's largest market is excluded, and LATAM is by far the most uneven region. [1, 3, 4]
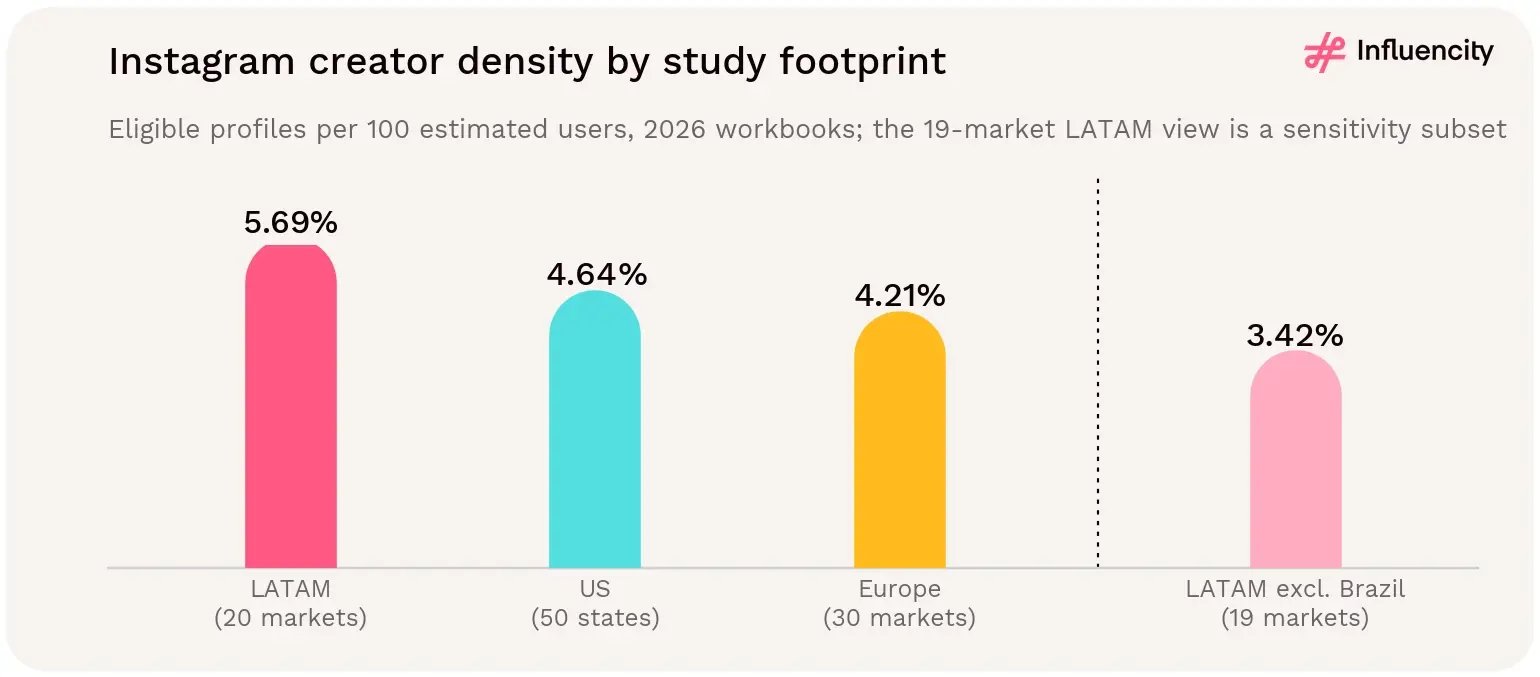
LATAM, the US and Europe at a glance

  • Brazil is the largest creator market in the three studies. Its 12.18M eligible profiles are 4.2 times the next largest of the 100 markets covered, Russia (2.88M). [1, 3]
  • Argentina ranks third of 100 markets. Its 1.90M eligible profiles put it ahead of California (1.81M) and the United Kingdom (1.79M); Mexico ranks ninth. [1, 3, 4]
  • LATAM supply is the most concentrated. In LATAM, one market holds more than half of the pool and three pass 80%. The US needs its five largest states to pass half and 17 to reach 80%; Europe needs three markets to pass half and eight to reach 80%. [1, 3, 4]
  • LATAM has the most profiles with 10,000+ followers. It records 2.19M, against 1.57M in Europe and 0.96M in the US: 6.75 per 1,000 estimated users, against 5.33 and 4.99. [1, 3, 4]
  • The US has the most mega creators per user. LATAM records the most mega profiles (12,896), but the US has 43.1 per million estimated users, against 39.9 in LATAM and 27.9 in Europe. [1, 3, 4]

LATAM has the highest Instagram creator density at 5.69% of estimated users, ahead of the US (4.64%) and Europe (4.21%), but LATAM excluding Brazil drops to 3.42%.

Figure 41 → Regional creator-density comparisons are sensitive to the countries included. The 19-market LATAM view is a sensitivity subset, not a fourth region. Sources: [1, 3, 4].
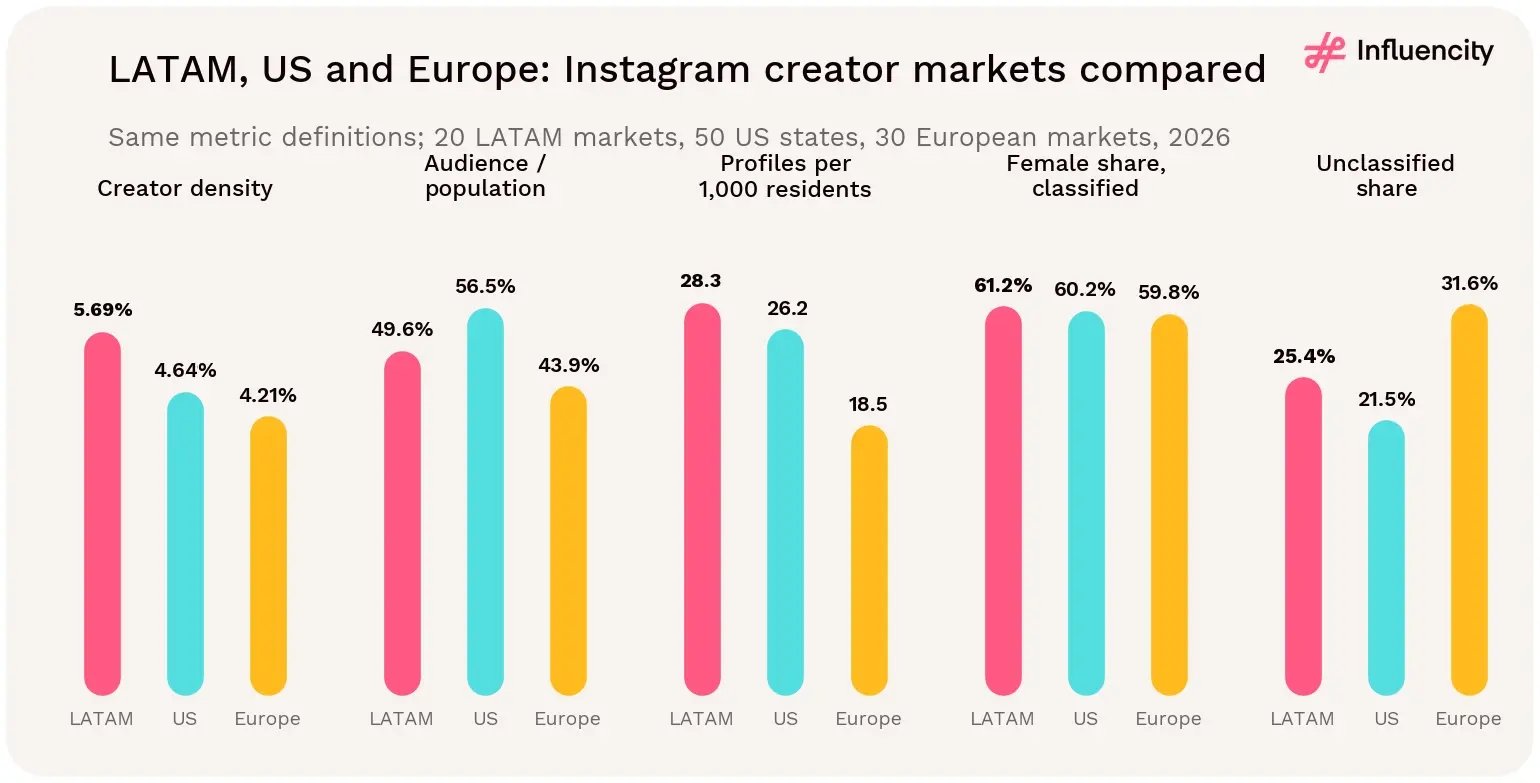
Metric

LATAM (20 markets) [1]

US (50 states) [4]

Europe (30 markets) [3]

Population reference

651.7M

341.1M

670.2M

Estimated Instagram users

323.5M

192.6M

294.5M

Influencer-eligible profiles

18.41M

8.94M

12.41M

Creator density

5.69%

4.64%

4.21%

Estimated users / population

49.6%

56.5%

43.9%

Profiles per 1,000 residents

28.3

26.2

18.5

Largest market (share of pool)

Brazil (66.2%)

California (20.2%)

Russia (23.2%)

Density excluding largest market

3.42%

4.21%

4.13%

Highest / lowest market density

8.62% / 0.58%

9.80% / 1.58%

5.57% / 2.69%

Markets above own benchmark

3 of 20

9 of 50

9 of 30

Female share, classified

61.2%

60.2%

59.8%

Unclassified share, all profiles

25.4%

21.5%

31.6%

Male share, classified mega tier

54.9%

49.9%

55.5%

Nano share

88.1% of tier entries

89.4% of tier entries

87.3% of tier entries

TikTok density ÷ Instagram density

1.07x

2.04x

≈2.01x

Change since 2023 edition

−2.6%

−12.3%

+17.9%

Sources: [1]; [4, 8] US Instagram dataset and study; [3, 9] Europe Instagram dataset and study; [2, 10, 11] TikTok. Nano shares are measured against each region's tier entries for comparability.

LATAM leads the US and Europe on creator density (5.69%) and profiles per 1,000 residents (28.3), while the US has the highest audience share of population (56.5%) and Europe the most unclassified profiles (31.6%).

Figure 42 → Five comparable ratios for the three regions. Sources: [1, 3, 4].

Why does LATAM have the highest creator density?

Brazil's 8.62% density is below New York's 9.80%, the highest US state, but above every European market. Excluding each region's largest market, LATAM falls to 3.42%, below the US without California (4.21%) and Europe without Russia (4.13%). Seventeen of the 20 LATAM markets sit below the regional rate, and the median market density is 3.11%. For planning, Brazil is the outlier, not Latin America as a whole. [1, 3, 4]

How uneven is creator density within each region?

LATAM market densities range 14.9-fold, from 0.58% in Cuba to 8.62% in Brazil, against 6.2-fold across US states and 2.1-fold across European countries. Only three of 20 LATAM markets exceed their regional benchmark, against nine in each of the other regions. Regional averages are least useful in LATAM. [1, 3, 4]
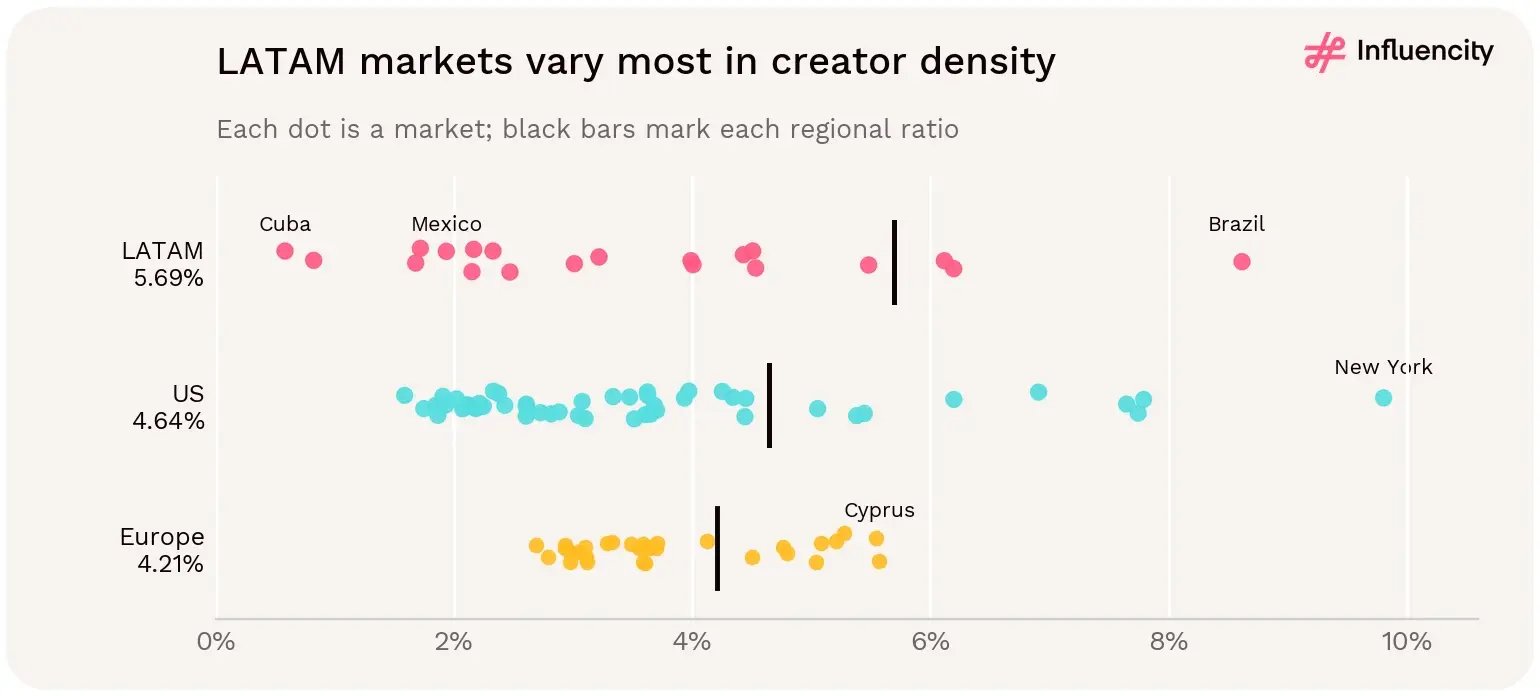
Creator density varies most across LATAM markets, from Cuba under 1% to Brazil above 8%, against regional ratios of 5.69% for LATAM, 4.64% for the US and 4.21% for Europe.

Figure 43 → Distribution of creator density across markets in the three regions. Sources: [1, 3, 4].

Do gender, tier and platform patterns differ across the regions?

The female share of classified profiles is within 1.4 points across the three regions, and nano accounts for roughly 87%–90% of the tier distribution in each. The clearest difference beyond Brazil is platform mix: TikTok's creator-density advantage over Instagram is about twofold in the US and Europe but only 1.07-fold in LATAM (1.58-fold excluding Brazil). [1–4, 8–11]
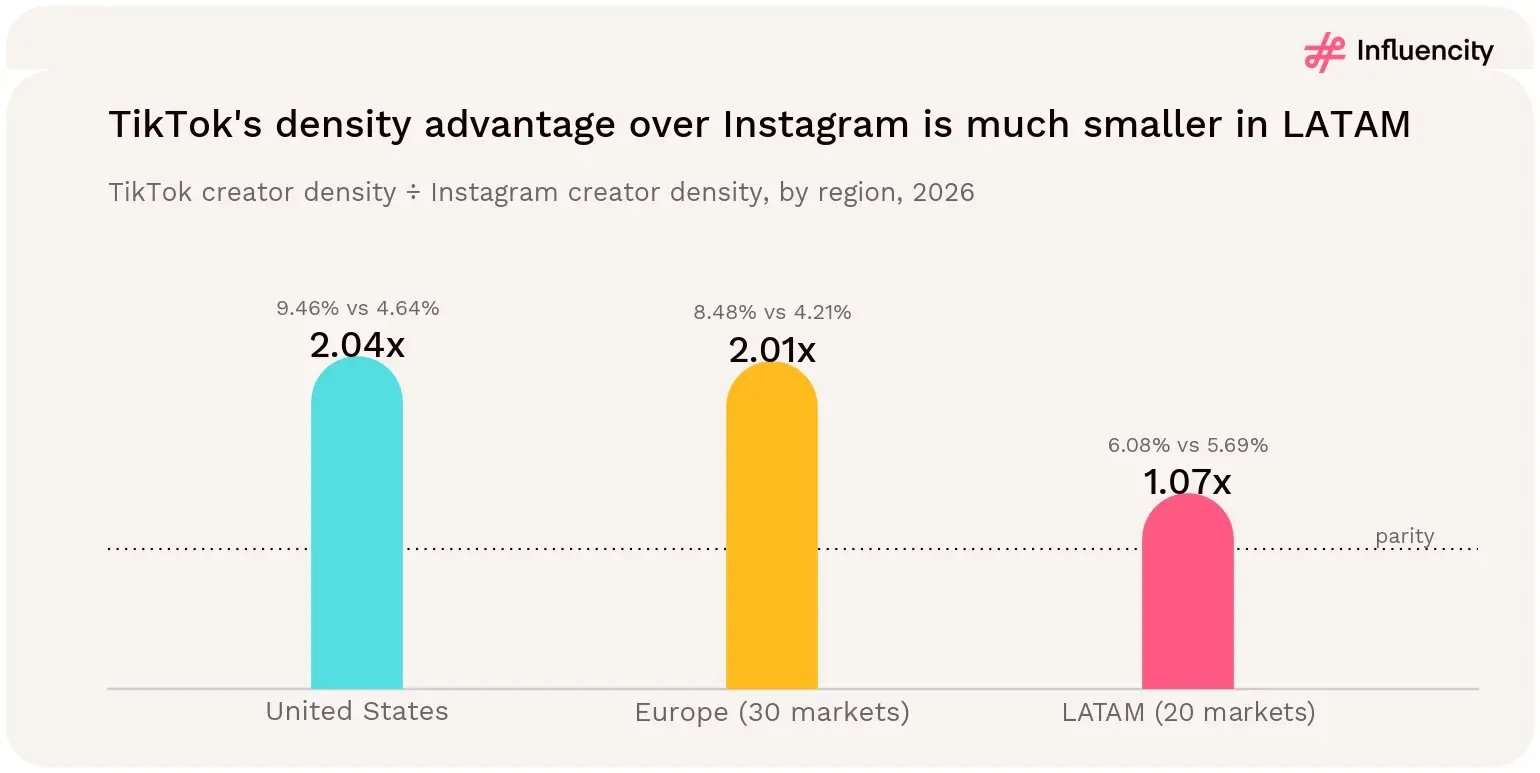
TikTok creator density is 2.04x Instagram's in the US and 2.01x in Europe, but only 1.07x in LATAM, where TikTok's 6.08% is close to Instagram's 5.69%.

Figure 44 → TikTok density divided by Instagram density in each region, 2026 datasets. Sources: [1–4, 10, 11].

How concentrated is creator supply in each region?

Far more in LATAM. Brazil alone holds 66.2% of eligible LATAM profiles, and Brazil, Argentina and Mexico together hold 82.1%. In the US, the five largest states hold 54.7% and 17 of 50 states are needed to reach 80%; in Europe, the five largest markets hold 69.6% and eight of 30 reach 80%. Measured as an effective number of equal-sized markets (the inverse of the Herfindahl index), LATAM's pool behaves like 2.2 markets, against 8.4 in Europe and 12.3 in the US. [1, 3, 4]

Without its largest market, each region looks different. LATAM's other 19 markets hold 6.23M profiles, fewer than the US without California (7.14M) or Europe without Russia (9.53M). [1, 3, 4]
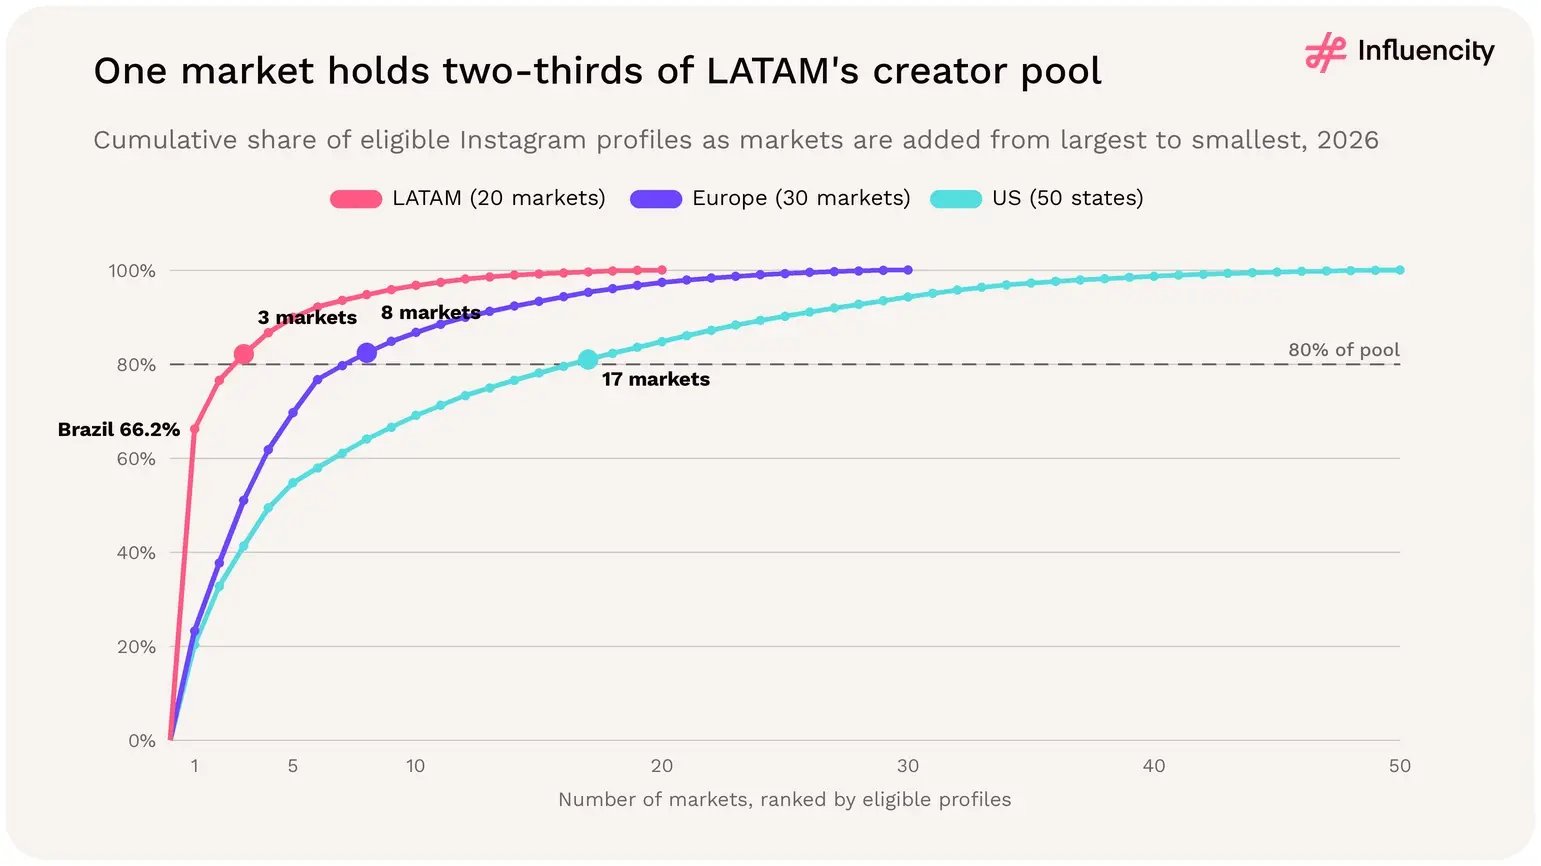
Brazil alone holds 66.2% of LATAM's eligible Instagram profiles and three markets pass 80% of the pool, compared with eight markets in Europe and 17 states in the US.

Figure 45 → Cumulative share of eligible Instagram profiles by number of markets, ranked from largest to smallest, in LATAM, the US and Europe, 2026. Sources: [1, 3, 4].

Where are the largest single Instagram influencer markets?

In Brazil, by a wide margin. Among the 100 markets covered by Influencity's three 2026 Instagram studies, Brazil's 12.18M eligible profiles are 4.2 times the next largest, Russia (2.88M). Argentina ranks third (1.90M), ahead of California (1.81M), the United Kingdom (1.79M) and Italy (1.66M). Mexico ranks ninth (1.04M), Colombia 12th (0.84M) and Chile 15th (0.60M). [1, 3, 4]

Market units differ: LATAM and Europe count countries and territories, while the US counts states. The ranking compares recorded pools, not national markets of equal standing. [1, 3, 4]
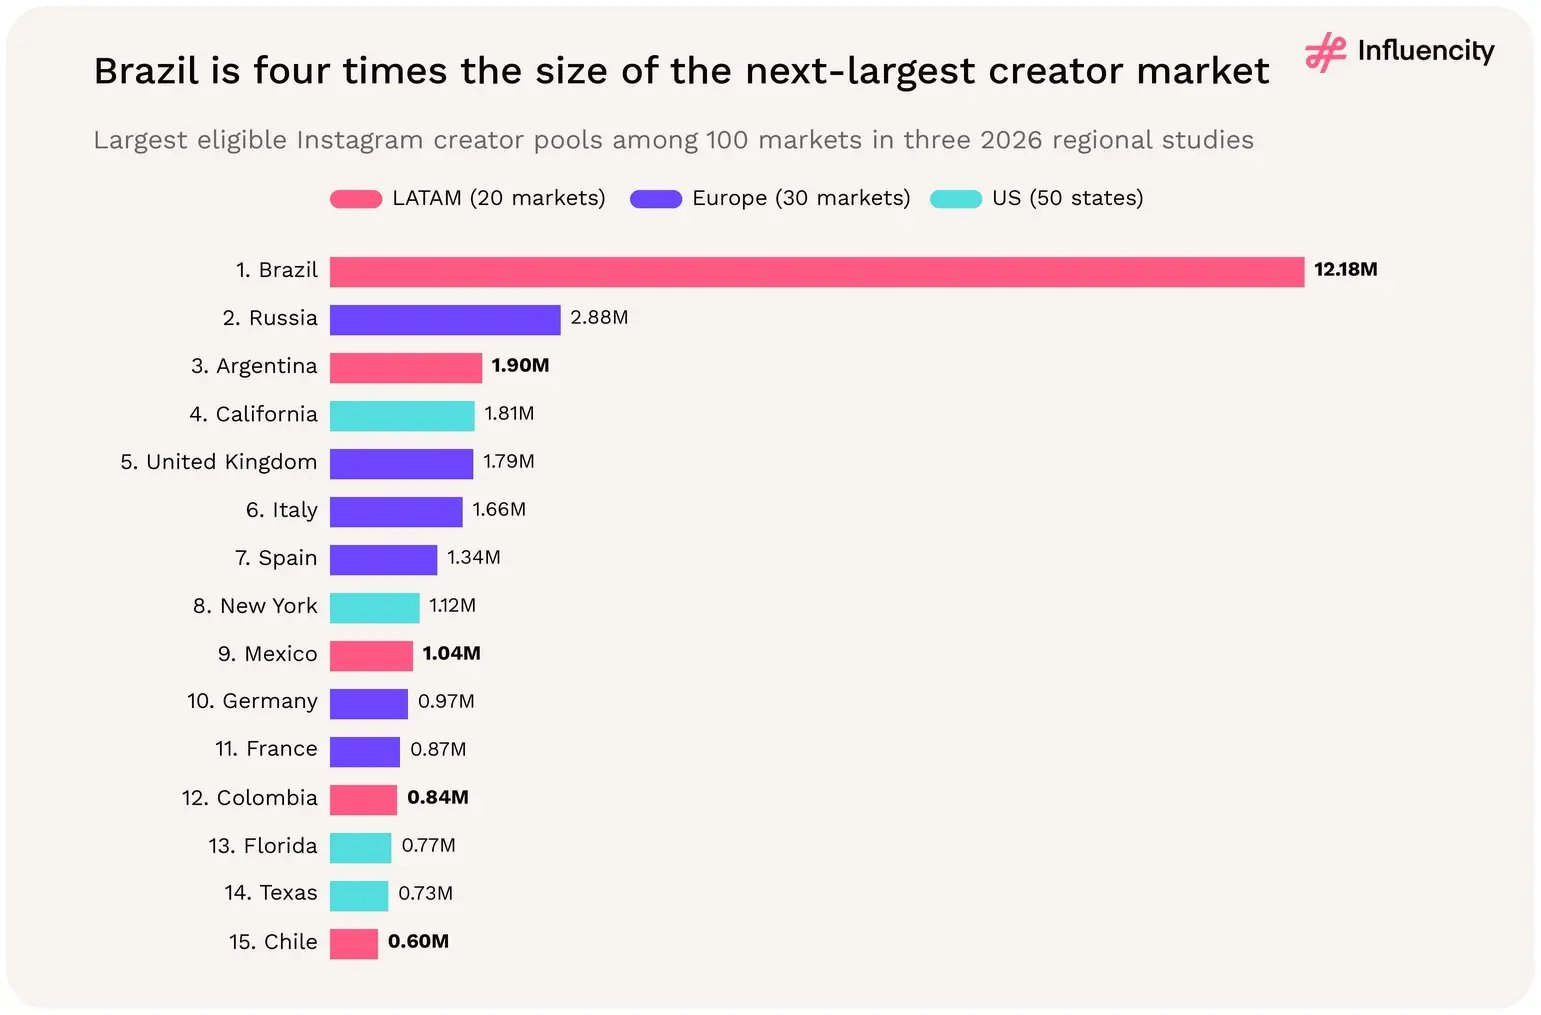
Brazil is the largest eligible Instagram creator pool among 100 markets in the LATAM, US and Europe studies with 12.18 million, four times Russia (2.88 million), with Argentina third at 1.90 million.

Figure 46 → The 15 largest eligible Instagram creator pools among the 100 markets in Influencity's 2026 LATAM, US and Europe studies. Sources: [1, 3, 4].

Which region has the deepest pool of creators with 10,000+ followers?

LATAM, in absolute terms. It records 2,185,146 profiles with 10,000+ followers, against 1,569,923 in Europe and 961,481 in the US, and the most per estimated user (6.75 per 1,000). Europe has the highest share of tier entries above 10,000 followers (12.7%), ahead of LATAM (11.9%) and the US (10.6%). [1, 3, 4]

The picture changes higher up and outside Brazil. LATAM records the fewest macro and mega profiles per 1,000 tier entries (11.9, against 13.1 in both the US and Europe), and the US has the most mega profiles per estimated user. Without Brazil, LATAM's 19 markets lean further up the ladder: 13.5% of their tier entries have 10,000+ followers, the highest share in the comparison. [1, 3, 4]

Region

Profiles with 10,000+ followers

Share of tier entries

Per 1,000 estimated users

Macro + mega per 1,000 tier entries

Mega profiles

Mega per million users

LATAM (20 markets)

2,185,146

11.9%

6.75

11.9

12,896

39.9

LATAM excl. Brazil (19)

840,328

13.5%

4.61

13.9

4,333

23.8

US (50 states)

961,481

10.6%

4.99

13.1

8,294

43.1

Europe (30 markets)

1,569,923

12.7%

5.33

13.1

8,219

27.9

Sources: [1, 3, 4], market rows of each 2026 Instagram dataset. Tier entries are the sum of nano, micro, macro and mega counts; per-user ratios use each dataset's estimated Instagram users.

How should brands use the regional comparison?

  • Decide platform mix market by market. The twofold TikTok density advantage seen in the US and Europe does not hold across LATAM (1.07 times), although it reappears outside Brazil (1.58 times). [1–4, 10, 11]
  • Set regional creator targets from recorded supply. Brazil holds 66.2% of LATAM's eligible profiles but 43.7% of estimated users, so targets split by audience share would ask far more of the smaller markets than their pools suggest. [1]
  • Look to LATAM for mid-tier scale. The region records more profiles with 10,000+ followers than Europe or the US, and the most per estimated user. [1, 3, 4]

A regional comparison can frame a discovery programme, but it cannot establish which region offers better returns. These datasets do not supply harmonised campaign costs, engagement outcomes, conversion rates, purchasing power or incrementality.

LATAM has the largest and densest recorded Instagram creator pool of the three regions, and the most profiles with 10,000+ followers, but those totals rest on Brazil. Without it, LATAM is smaller than the US or Europe in absolute supply and the thinnest of the three on density. Plan Brazil and the rest of LATAM as separate programmes, and benchmark each market against its own data rather than a regional average. [1, 3, 4]

14 → EVIDENCE FROM OUR CATEGORY STUDIES

What our category studies suggest for LATAM campaigns

The 2026 LATAM dataset counts profiles; it has no engagement, sentiment, disclosure or conversion fields. Influencity's 2025 supplements study measured those things on TikTok, Instagram and YouTube in the US and Mexico, making it the only Influencity performance evidence that covers a LATAM market. Its Mexico findings are directly relevant; its pooled figures mix both countries. The food study covers the US only. [12, 13]

Supplements study [12]

Food study [13]

Published

October 2025

November 2025

Sample

5,000+ sponsored posts; creators aged 18–50; 500+ comments per post

10,568 social mentions; 20-creator dataset; nine brand case studies

Platforms

TikTok, Instagram, YouTube

TikTok, Instagram, YouTube

Geography

United States and Mexico

United States (five states)

Period

January–June 2025

Not stated

Mexico: local narratives outperform generic messaging

The supplements study found Mexican content and audiences responding to "energy", "family", community and tradition-based wellness narratives, often drawing on "natural" and "ancestral" remedy themes, while US content leaned on "science-based" and "clinically backed" language. One-size-fits-all messaging underperformed, and Spanish-language comments were more positive towards "energy, family, vitality" narratives. The study describes engagement in Mexico as TikTok-led. [12]

Claims rules: COFEPRIS

In Mexico, supplement labelling, claims and advertising fall under COFEPRIS (Comisión Federal para la Protección contra Riesgos Sanitarios). The study notes that COFEPRIS prohibits advertising suggesting a supplement can diagnose, treat or cure a disease, limiting claims to nutritional or well-being benefits, and describes Mexico's enforcement environment as less digitised than the US. Other LATAM markets have their own regulators, which the study did not examine. [12]

Platform signals in the pooled US and Mexico sample

Across the combined sample, Instagram comments were 68% positive (TikTok 58%, YouTube 51%), 78% of Instagram posts carried an explicit #ad or #sponsored disclosure (TikTok 66%), and Instagram scored 69 out of 100 on the study's trust index against 23 for TikTok. Clearly disclosed posts performed 12% better on long-term engagement. These pooled figures are not reported separately for Mexico. [12]
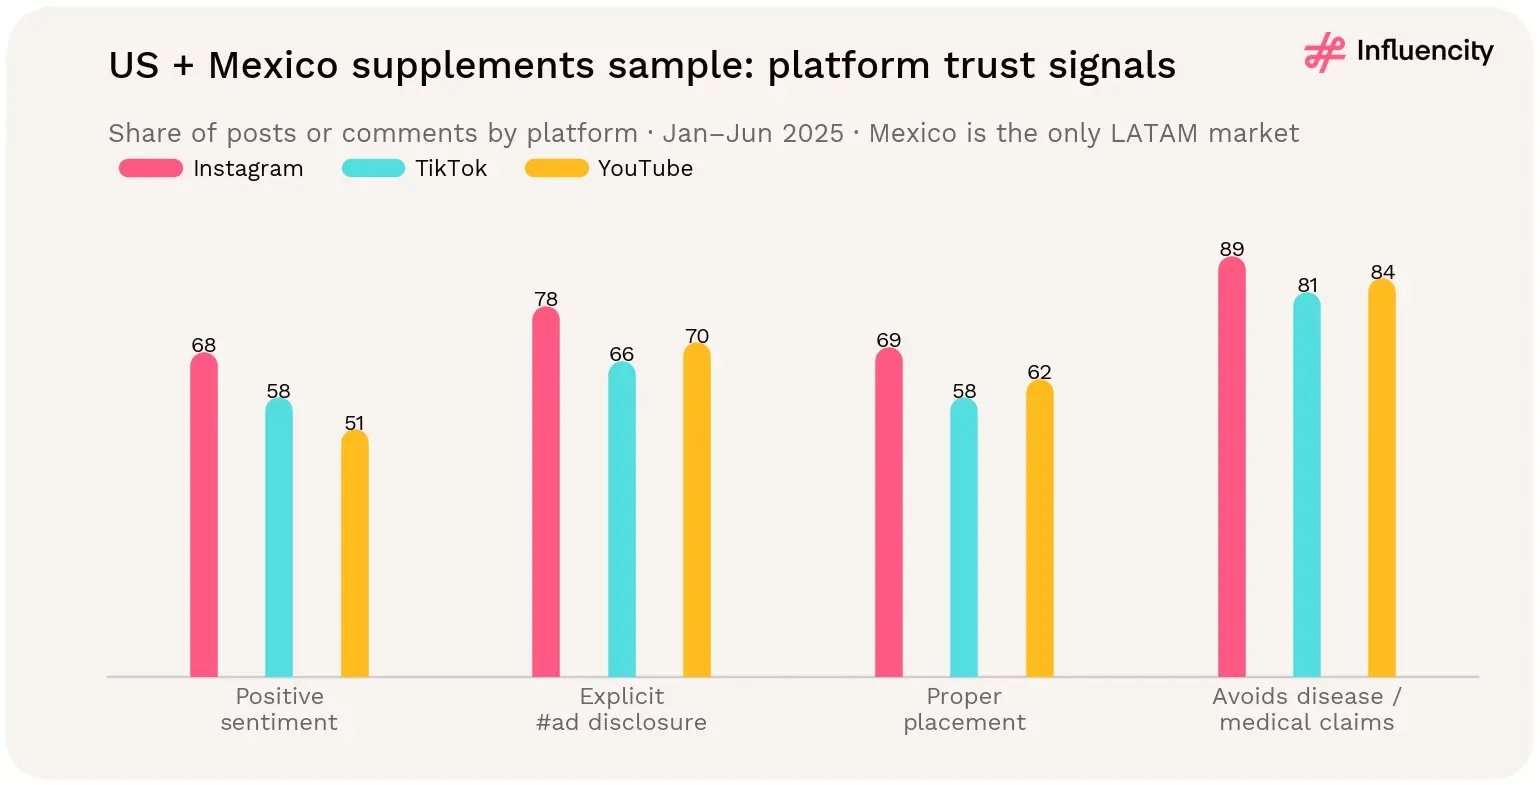
In the US and Mexico supplements sample, Instagram leads TikTok and YouTube on positive sentiment (68%), explicit #ad disclosure (78%), proper placement (69%) and avoiding medical claims (89%).

Figure 47 → Sentiment, disclosure and claim compliance by platform in Influencity's supplements study (US and Mexico combined). Source: [12].

Finding (source)

Evidence base

How to use it in LATAM

Family, energy and community narratives resonate in Mexico [12]

Mexico, supplements

Brief Mexican creators on local narratives; test the same in other Spanish-speaking markets

COFEPRIS limits supplement claims to nutritional/well-being benefits [12]

Mexico, regulatory

Approve claim wording before content goes live; check each market's regulator

Engagement in Mexico is TikTok-led [12]

Mexico, supplements

Plan Instagram and TikTok rosters together for Mexican campaigns

Creators under 100,000 followers earn the highest engagement (57% vs 24% above 1M, as reported) [12]

US + Mexico, supplements

Test rosters of creators under 100,000 followers, especially outside Brazil where pools are smaller

Clear #ad disclosure: +12% long-term engagement [12]

US + Mexico, supplements

Disclose on screen and in captions, including bilingual captions where relevant

Micro-creators > 50% of tagged food posts; national + city mix [13]

US, food

Pair national creators with city-level creators in large markets such as São Paulo or Mexico City

Which supplement categories do influencers promote most?

Protein. In Influencity's supplements study, protein supplements account for 26% of sponsored posts, followed by multivitamins (21%), gut health and probiotics (18%), energy boosters and nootropics (10%) and beauty supplements (8%): together 83% of the sample. Gut health appears on two lists: it is the third-largest category and, with weight-loss products, accounts for most of the potentially non-compliant claims, which affected 15% of posts overall. [12]
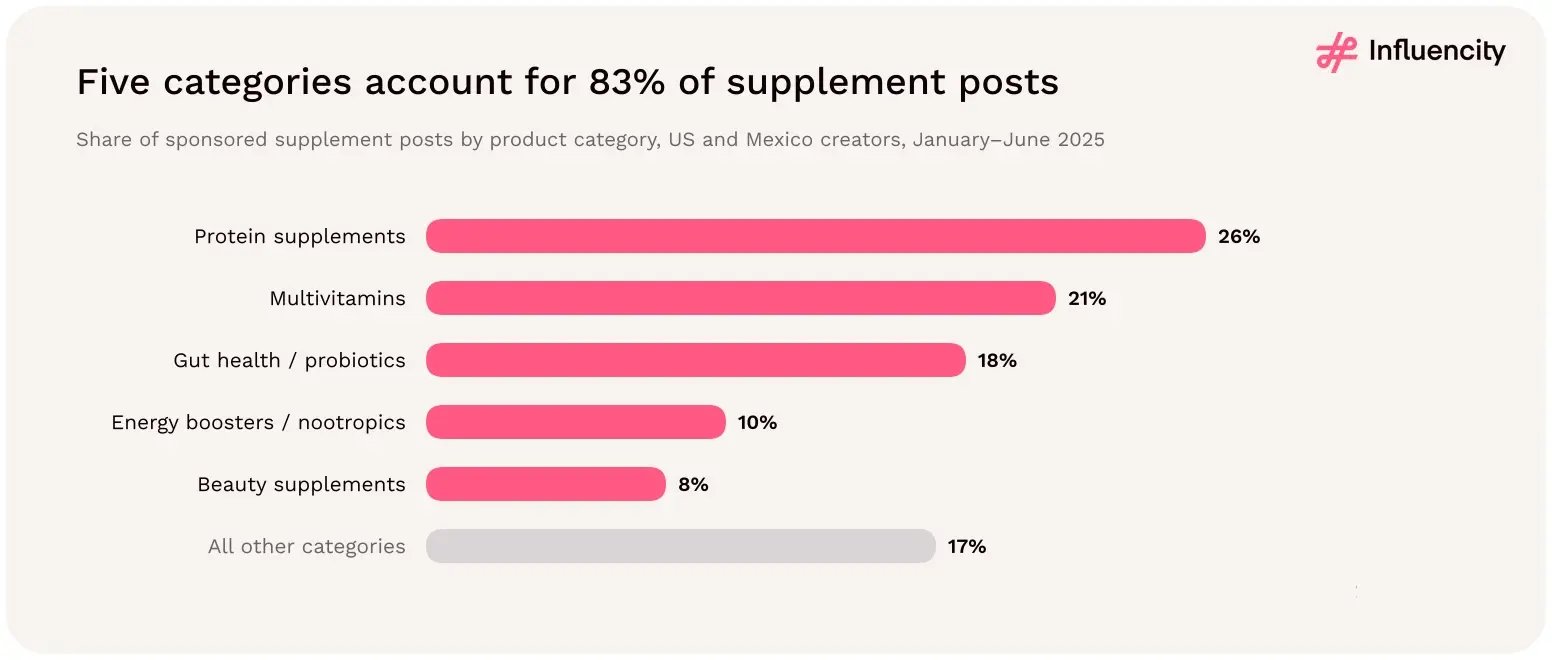
Five categories account for 83% of sponsored supplement posts by US and Mexico creators in January–June 2025, led by protein supplements (26%), multivitamins (21%) and gut health or probiotics (18%).

Figure 48 → Share of sponsored supplement posts by product category, US and Mexico creators, January–June 2025. Source: [12].

In LATAM terms, these categories sit inside the wellness niche covered in section 10. Fitness, yoga and healthy lifestyle is the largest interest in Mexico (223,497 tagged profiles) and the second largest across the eight markets with niche data (2,496,320). Mexican wellness profiles are also close to gender parity (53.2% female among classified profiles), so wellness rosters there do not need to skew female. [1, 12, 14]

Which creator tier gets the most engagement in supplement content?

Micro creators. The study reports average engagement of 57% for creators under 100,000 followers, 38% for macro creators (100,000–1M) and 24% for creators above 1M. The figures are published for the US and Mexico combined and are best read as a ranking rather than as rates comparable with other benchmarks. Routine-based, lifestyle content also drove nearly three times the engagement of hard-sell posts. [12]

The ranking fits LATAM supply. Micro is the deepest tier above nano in every market: Mexico records 134,230 micro profiles against 17,879 macro and 1,374 mega, about 7.5 micro creators for every macro creator, and the region records 1,965,642 micro profiles, 753,641 of them outside Brazil. [1, 12]
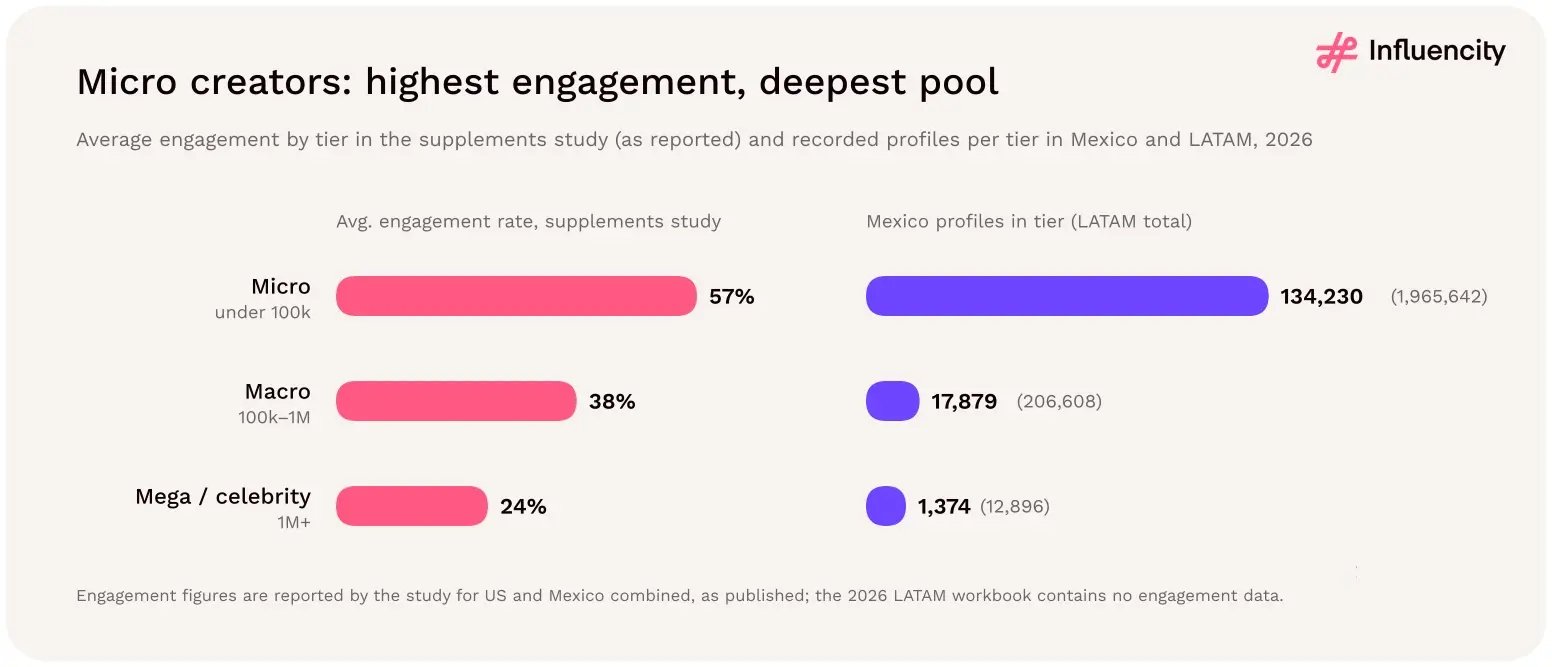
Micro creators show the highest average engagement in the supplements study (57%, versus 38% macro and 24% mega) and the deepest pool, with 134,230 profiles in Mexico and 1,965,642 across LATAM.

Figure 49 → Average engagement by tier in Influencity's supplements study (US and Mexico, as published) and recorded profiles per tier in Mexico, with LATAM totals in brackets. Sources: [1, 12].

Compliance gaps are widest on TikTok, the platform the study identifies as leading engagement in Mexico: 66% of TikTok posts carried an explicit #ad or #sponsored disclosure and 58% placed it visibly, against 78% and 69% on Instagram. Across all platforms, 85% of posts avoided disease or medical claims, leaving 15% at potential regulatory risk. [12]
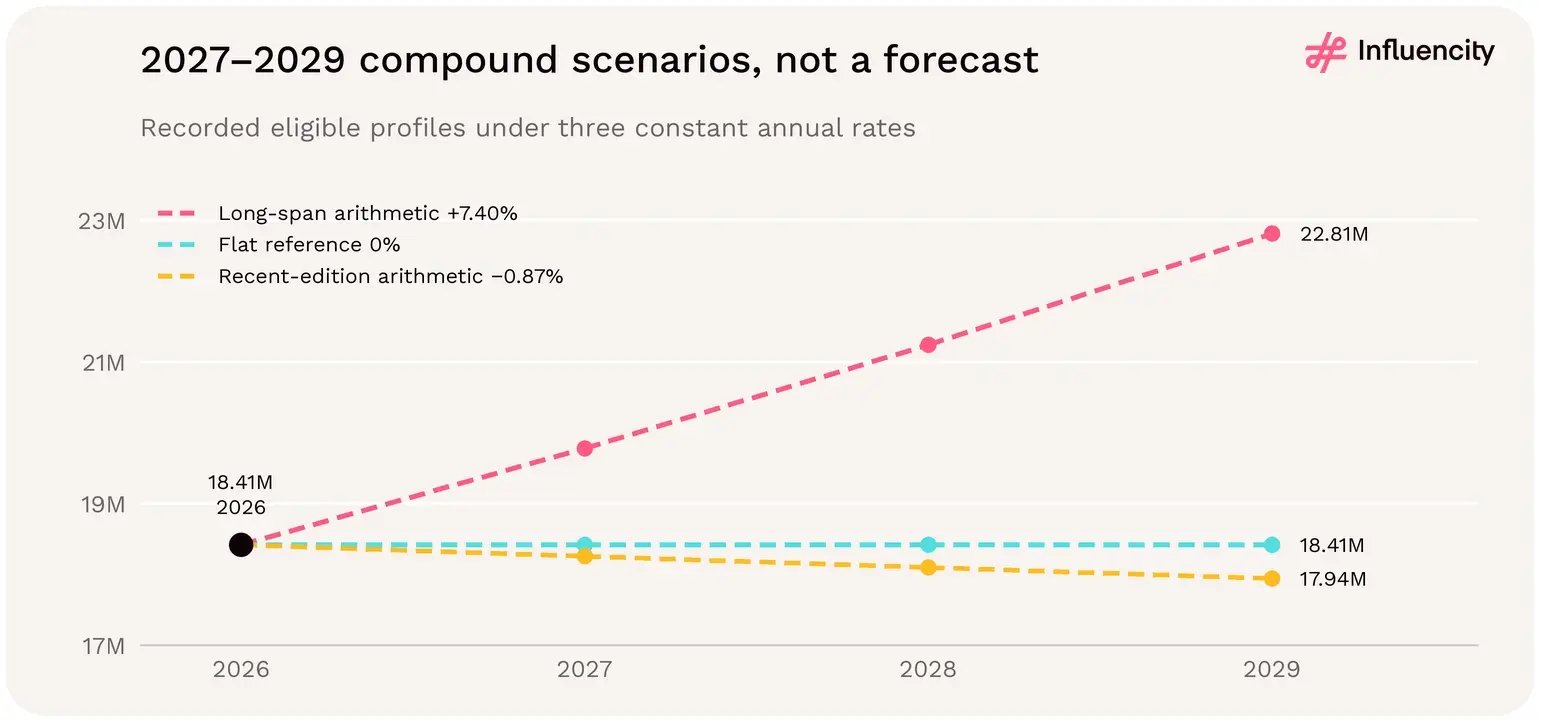
Compliance metric

Overall

TikTok

Instagram

YouTube

Posts with explicit disclosure (#ad, #sponsored)

71%

66%

78%

70%

Proper disclosure placement (visible caption or overlay)

63%

58%

69%

62%

Posts avoiding disease or medical claims

85%

81%

89%

84%

Source: [12], compliance scorecard, US and Mexico combined. The study does not report compliance for Mexico separately.

What the category evidence means for LATAM briefs

  • Lead with micro creators, then add reach. Micro creators topped the study's engagement ranking and form the deepest mid-tier pool in every LATAM market.
  • Brief TikTok creators on disclosure. TikTok led engagement in Mexico but trailed on disclosure, with 66% of posts explicitly labelled and 58% labelled visibly.
  • Pre-clear gut-health and weight-loss claims. These categories produced most of the potentially non-compliant claims; in Mexico, COFEPRIS limits supplement claims to nutritional or well-being benefits.
  • Favour routines over hard sells. Routine-based, lifestyle content drove nearly three times the engagement of overtly promotional posts.
  • Re-test before extending beyond Mexico. The study covers the US and Mexico only; other LATAM markets have their own regulators and wellness cultures.

15 → 2027–2029 SCENARIOS

What could the recorded creator pool look like over the next three years?

The table below is a sensitivity exercise, not a forecast. It applies three constant annual rates to the 2026 eligible-profile count. The rates bracket different readings of the historical headlines without assuming that any one represents the market's underlying growth process.

Year

Recent-edition arithmetic: −0.87%

Flat reference: 0%

Long-span arithmetic: +7.40%

2026 baseline

18.41M

18.41M

18.41M

2027

18.25M

18.41M

19.77M

2028

18.09M

18.41M

21.24M

2029

17.94M

18.41M

22.81M

From 18.41 million recorded eligible profiles in 2026, constant-rate scenarios reach 22.81 million in 2029 at +7.40% a year, stay at 18.41 million when flat, or fall to 17.94 million at -0.87%.

Figure 50 → Mechanical compound-rate scenarios for the recorded eligible-profile count. Sources: [1, 5, 6].

What happens if recent market trends continue?

The total could stay flat while its composition changes. Between the 2023 and 2026 editions, Brazil's reported count fell by an average of 5.5% a year and the rest of the region grew by about 11.7% a year. If both trends continued, the total would edge up to about 18.97M by 2029, within the range of the scenarios above, but Brazil's share would fall from 66.2% to about 54%. [1, 6]
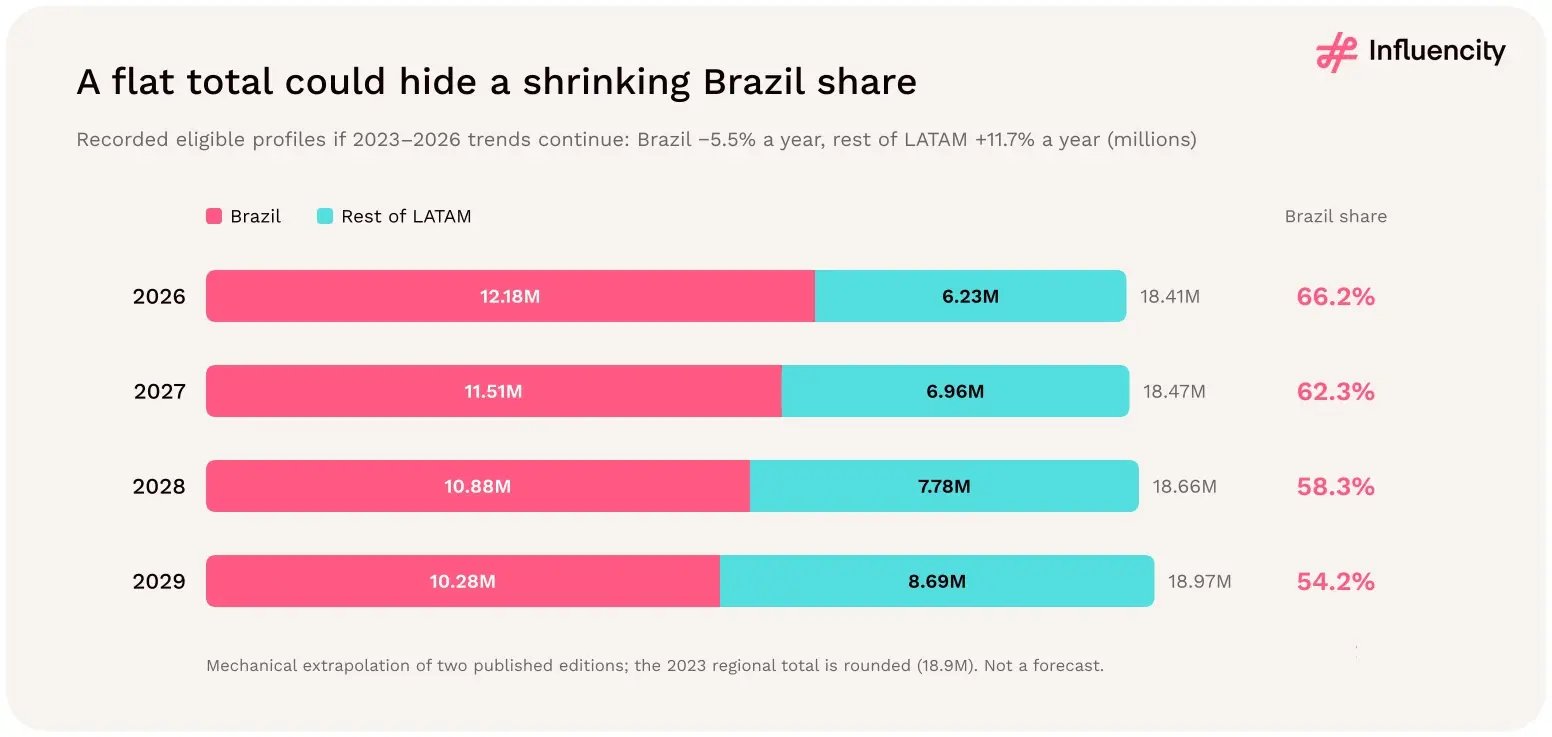
If 2023–2026 trends continued, LATAM's total would edge from 18.41 million to 18.97 million by 2029 while Brazil's share fell from 66.2% to 54.2%, a mechanical extrapolation rather than a forecast.

Figure 51 → Recorded eligible profiles in Brazil and the rest of LATAM, 2026, and on continued 2023–2026 trends to 2029. Mechanical extrapolation, not a forecast. Sources: [1, 6].

Year

Brazil

Rest of LATAM

Total

Brazil share

2026 (recorded)

12.18M

6.23M

18.41M

66.2%

2027

11.51M

6.96M

18.47M

62.3%

2028

10.88M

7.78M

18.66M

58.3%

2029

10.28M

8.69M

18.97M

54.2%

Sources: [1, 6]. Rates: Brazil (12,182,215 / 14,432,050)^(1/3) − 1 = −5.5%; rest of LATAM (6,230,198 / 4,467,950)^(1/3) − 1 = +11.7%, using the rounded 18.9M 2023 total.

Which markets would grow fastest on current trends?

Mexico. Its recorded pool grew by an average of 15.6% a year between the 2023 and 2026 editions; continued, that would take it from 1,037,320 to about 1.60M profiles by 2029. Colombia (+9.3% a year, to about 1.09M) and Peru (+9.2%, to about 289,000) follow. Argentina, growing 2.8% a year, would stay the second-largest market at about 2.07M, while Chile would be broadly flat. [1, 6]
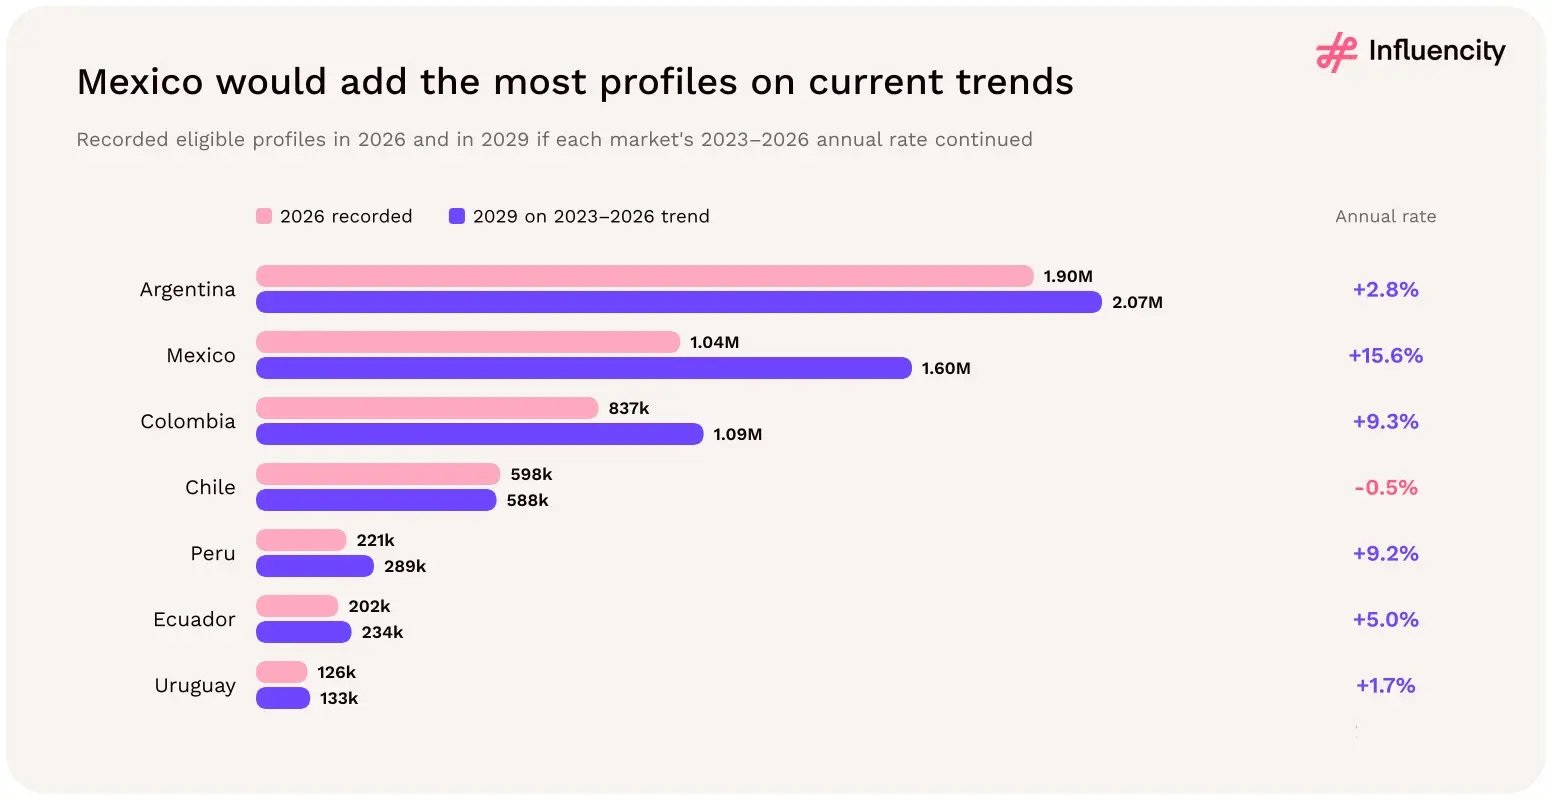
On each market's 2023–2026 annual rate, Mexico would add the most eligible profiles, from 1.04 million in 2026 to 1.60 million in 2029 (+15.6% a year), while Argentina would reach 2.07 million.

Figure 52 → Recorded eligible profiles in 2026 and in 2029 if each market's 2023–2026 annual rate continued, seven markets with published 2023 counts. Sources: [1, 6].

These paths depend on only two published data points per market and on any changes in eligibility rules between editions. Use them to decide where to build long-term creator relationships and where to refresh benchmarks first, not to set budgets. [1, 6]

How the scenarios are calculated

Future profiles = 18,412,413 × (1 + annual rate)^(years after 2026). Recent-edition rate = (18,412,413 / 18,900,000)^(1/3) − 1 = −0.8674%. Long-span rate = (18,412,413 / 12,000,000)^(1/6) − 1 = +7.3960%. The intervals are edition-year assumptions; no scenario is assigned a probability. Because Brazil is two-thirds of the base, any change in Brazilian coverage would dominate the path.

16 → CAMPAIGN PLANNING

How should brands and agencies use these market differences?

Use country statistics to decide where to investigate, then qualify individual creators. The dataset supports comparisons of recorded supply and audience scale; it does not establish which roster will sell more, cost less or produce better content.

Planning context

What the data indicates

Suggested next step

Brazil-inclusive programme

66.2% of regional supply is in Brazil.

Separate Brazil reporting and Portuguese-language, locally reviewed creative; allocate by commercial objectives, not profile share.

Programme excluding Brazil

The relevant pooled density is 3.42%, below the US and Europe.

Use the recalculated 19-market benchmark and country-specific recruitment targets.

Large audience, lower density

Mexico has 53.6M estimated users and 1.94% density.

Allow for audience-fit screening, consider cross-border Spanish-language creators, and brief on local narratives. [12]

Regulated categories

COFEPRIS limits supplement claims in Mexico. [12]

Specify approved claim wording and visible disclosure; check each market's regulator.

Smaller high-density market

Paraguay has 6.19% density but 161,006 profiles.

Test the depth of the relevant category, not the national ratio alone.

High audience-to-population ratio

Chile and Uruguay exceed 67%, with different pool sizes.

Set recruitment and coverage goals independently for each market.

Cross-platform plan

TikTok's LATAM density edge over Instagram is small (1.07x); Mexican engagement was TikTok-led. [2, 12]

Build Instagram and TikTok rosters separately but plan them together.

Market facts: [1]. Suggested next steps are planning interpretations, not observed campaign results.

Localisation starts with the brief

Define the target market, audience location, language, cultural context, product availability and commercial objective before choosing creators. Review each creator's actual content and audience data rather than inferring language or audience nationality from their country assignment. Influencity's Mexico evidence shows that the narrative frame, not just the language, needs localising. [12]

Which LATAM markets suit which campaign roles?

Grouping markets by audience size and mid-tier creator supply gives four planning archetypes. Scale markets (Brazil, Argentina, Colombia and Chile) combine at least 10M estimated users with 500 or more profiles of 10,000+ followers per 100,000 users; together they hold 64.0% of estimated users and 80.9% of the region's 10,000+ follower profiles. Audience-led markets (Mexico and Peru) have large audiences but thinner supply: 19.8% of users and 8.7% of these profiles. [1]
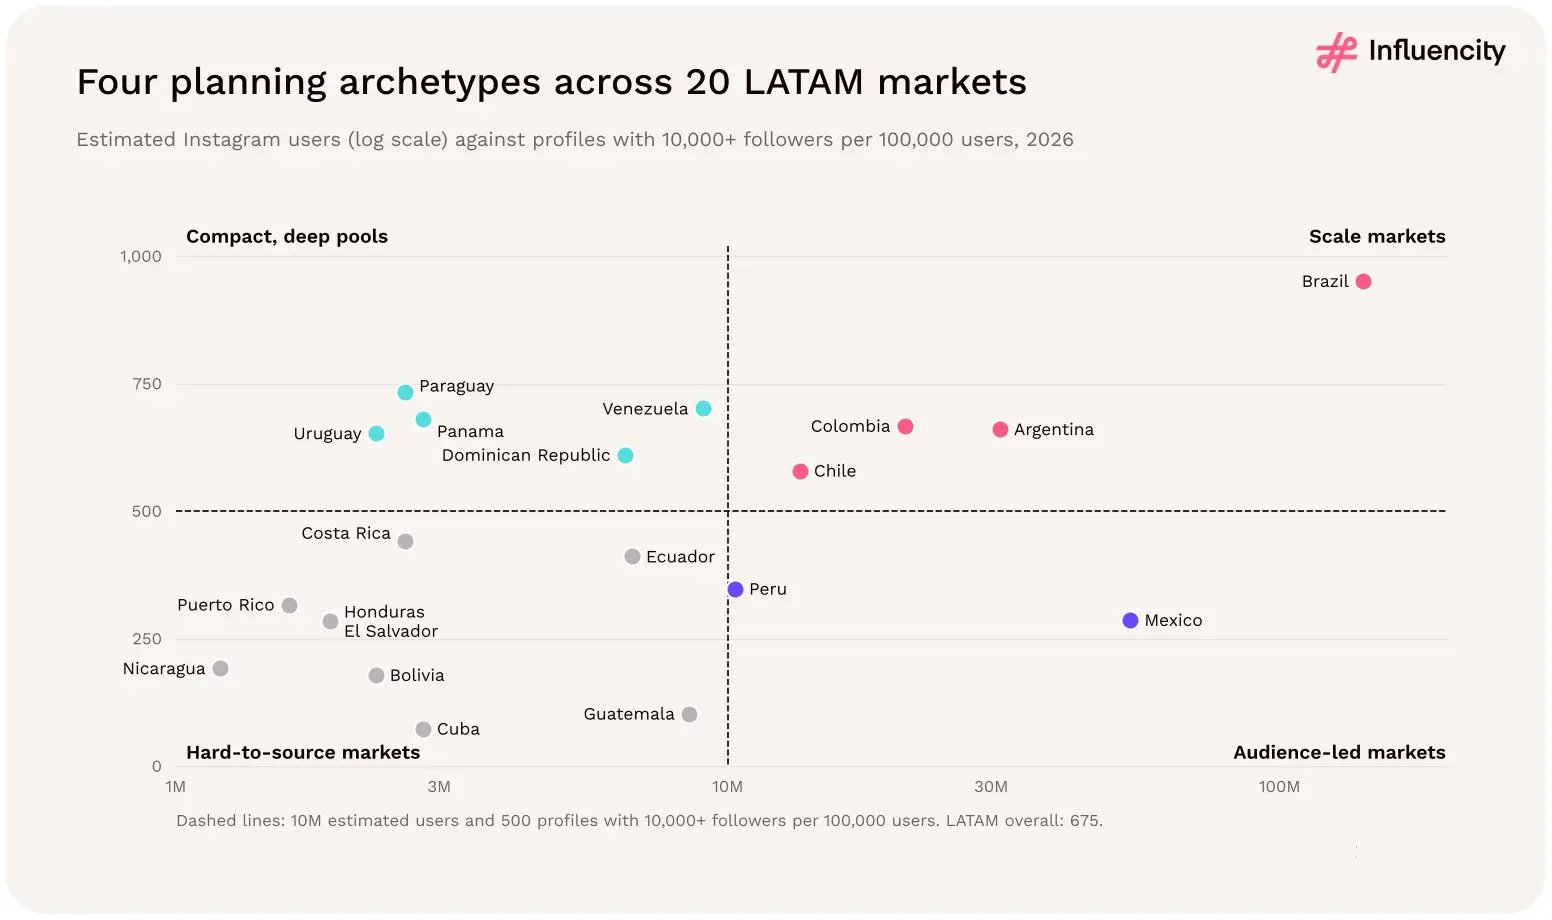
Plotting estimated Instagram users against profiles with 10,000+ followers per 100,000 users splits 20 LATAM markets into four archetypes, with Brazil as the largest scale market and Mexico audience-led.

Figure 53 → Estimated Instagram users (log scale) against profiles with 10,000+ followers per 100,000 users for the 20 markets; dashed lines mark 10M users and 500 per 100,000. Source: [1].

Compact, deep pools (Paraguay, Venezuela, Panama, Uruguay and the Dominican Republic) record 610 to 734 such profiles per 100,000 users, close to the 675 regional figure, but each has fewer than 10M users. The nine hard-to-source markets average 244, and Guatemala (103) and Cuba (73) are below one-sixth of the regional figure. The spread is 13-fold, from 951 in Brazil to 73 in Cuba. [1]

Archetype

Markets

Share of users

Share of 10,000+ profiles

Per 100,000 users

Planning role

Scale markets

Brazil, Argentina, Colombia, Chile

64.0%

80.9%

854

Anchor programmes; recruit locally at volume

Audience-led markets

Mexico, Peru

19.8%

8.7%

296

Plan reach early; widen sourcing and screening

Compact, deep pools

Paraguay, Venezuela, Panama, Uruguay, Dominican Republic

7.2%

7.1%

672

Efficient local tests; small absolute rosters

Hard-to-source markets

Costa Rica, Ecuador, Puerto Rico, Honduras, El Salvador, Nicaragua, Bolivia, Guatemala, Cuba

9.1%

3.3%

244

Regional or cross-border creators; longer lead times

Source: [1], Appendices A and C. 10,000+ followers = micro, macro and mega tier entries. The thresholds (10M users; 500 per 100,000 users) are planning conventions, not statistical breaks.

How should reach and influencer budgets be split across markets?

Separately. Allocating creator effort by audience share would put about a fifth of it into Mexico and Peru, where only 8.7% of 10,000+ follower profiles sit; allocating reach by creator supply would underweight their audiences by more than half. In Mexico alone, 16.6% of the region's estimated users are matched by 7.0% of its 10,000+ follower profiles. [1]
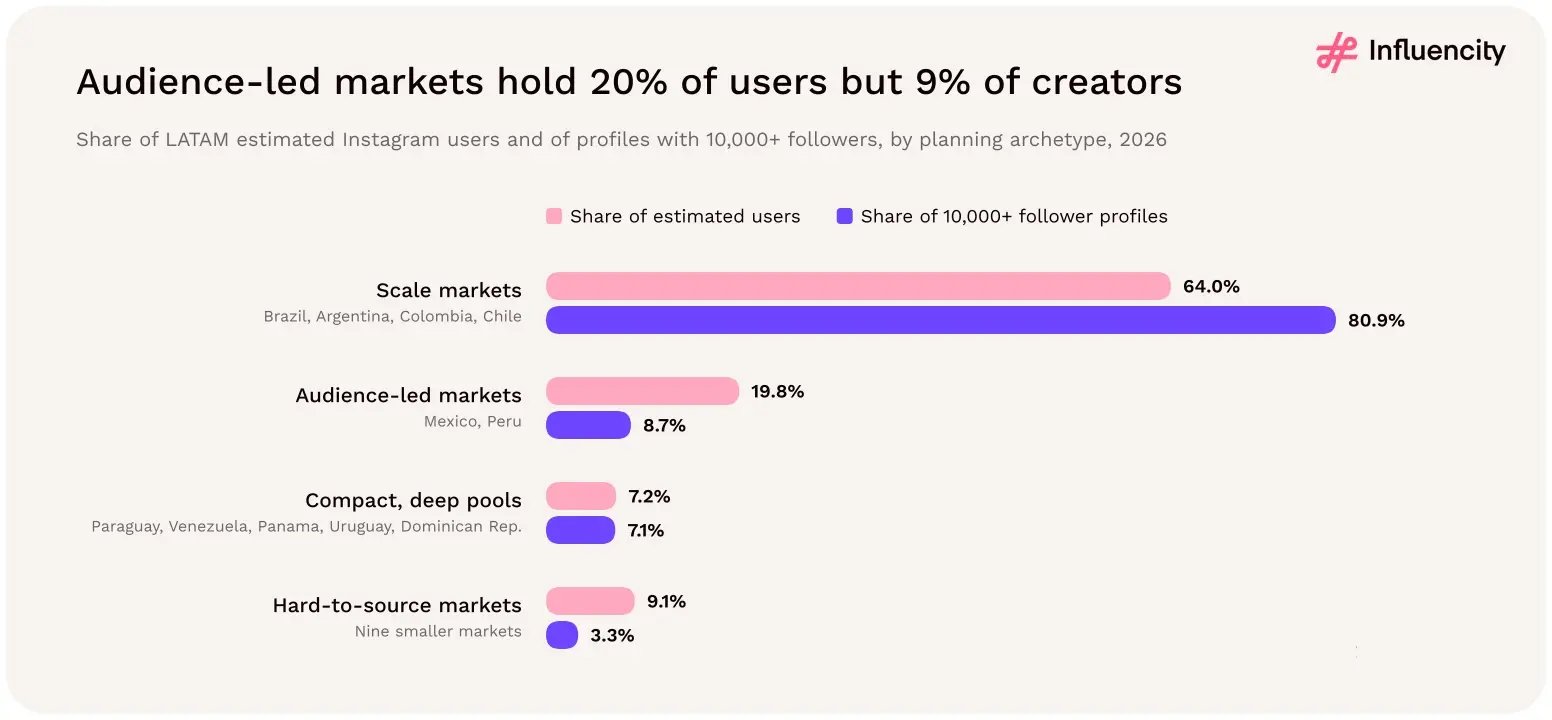
Scale markets (Brazil, Argentina, Colombia, Chile) hold 64.0% of LATAM's estimated Instagram users and 80.9% of 10,000+ follower profiles, while audience-led Mexico and Peru hold 19.8% of users but 8.7% of creators.

Figure 54 → Share of LATAM estimated Instagram users and of profiles with 10,000+ followers held by each planning archetype, 2026. Source: [1].

A practical split is to size paid amplification and media against audience share, and to size creator recruitment, briefing and approval effort against supply. Audience-led and hard-to-source markets need more lead time per creator, more screening and, where suitable, cross-border Spanish-language creators whose audiences reach the market; scale markets can absorb larger rosters faster. These are planning interpretations, not observed campaign results.

How would a three-market wellness programme be sized?

Take a wellness brand planning 60 Instagram creators across Brazil, Mexico and Chile, led by micro creators (10,000–100,000 followers) with a few macro creators (100,000–1M) for reach. The five steps below apply this section's planning logic, summarised in the checklist that follows, to the recorded tier counts in Appendix C and the niche data in Appendix D. [1, 14]

1. Split reach by audience. The three markets hold 208.5M estimated Instagram users: 67.8% in Brazil, 25.7% in Mexico and 6.5% in Chile. Paid amplification can follow that split.

2. Size the pool at the tiers you will recruit. Brazil records 1,336,255 micro and macro profiles, Mexico 152,109 and Chile 77,954. A roster weighted by that supply would put 51 of the 60 creators in Brazil, six in Mexico and three in Chile, well below Mexico's share of the audience.

3. Narrow to the niche. Fitness, yoga and healthy-lifestyle tags cover 13.9 profiles per 100 in Brazil, 21.5 in Mexico and 18.9 in Chile. Applied to the micro and macro pools, that gives about 185,300, 32,800 and 14,700 wellness profiles. Relative to its audience, Mexico is thinnest: about 610 such profiles per million estimated users, against 1,310 in Brazil and 1,090 in Chile.

4. Set the roster. Audience share alone would give 41, 15 and 4 creators. Keeping at least 10 creators per market, so that each can be measured on its own, gives 35 in Brazil, 15 in Mexico and 10 in Chile, split between micro and macro roughly in line with each market's recorded tier mix.

5. Plan the screening effort. Reviewing eight candidates for each slot produces shortlists of 280, 120 and 80 profiles: 0.15% of Brazil's estimated wellness pool, but 0.37% of Mexico's and 0.54% of Chile's, so repeat waves will exhaust the smaller pools sooner. Chile's 41.3% unclassified share adds account-type checks, and Mexico's wellness profiles are close to gender parity (53.2% female among classified, against 59.1% in Brazil), so gender targets should be set per market.

Market

Estimated users (share)

Micro + macro profiles

Est. wellness profiles

Suggested roster (micro + macro)

Shortlist to review

Share of wellness pool reviewed

Brazil

141.4M (67.8%)

1,336,255

185,300

35 (32 + 3)

280

0.15%

Mexico

53.6M (25.7%)

152,109

32,800

15 (13 + 2)

120

0.37%

Chile

13.5M (6.5%)

77,954

14,700

10 (9 + 1)

80

0.54%

Total

208.5M

1,566,318

232,800

60

480

0.21%

Sources: [1], Appendix C; [14], Appendix D. Wellness estimates apply each market's fitness, yoga and healthy-lifestyle tag rate to its micro and macro pools, because interest tags are not reported by tier. Roster sizes and the eight-candidates-per-slot screening ratio are illustrative assumptions, not findings.

The numbers matter less than the pattern. Audience share sets where reach goes, recorded supply sets how hard each slot is to fill, and a minimum roster keeps the smallest market measurable. Mexico is where the two pressures meet, which is also why a parallel TikTok roster is worth testing there (section 11). [1, 2]

A five-step LATAM campaign planning checklist

  • Classify each market first. Decide whether a market is a scale, audience-led, compact or hard-to-source market before setting targets (Figure 53).
  • Set recruitment targets from supply. Base roster sizes on recorded tier counts in each market (Appendix C), not on audience size or regional averages.
  • Budget reach from audience. Size paid amplification against estimated users, where Mexico and Peru carry far more weight than their creator pools.
  • Add lead time where supply is thin. Allow longer sourcing and approval windows in audience-led and hard-to-source markets, and consider cross-border creators.
  • Measure by market, not region. Report results for each market separately so that Brazil's scale does not mask performance elsewhere (section 17).

17 → MEASUREMENT AND ACTIVATION

What should a LATAM Instagram campaign measure?

Planning question

Possible evidence

Interpretation safeguard

Did we reach the intended audience?

Audience geography; reported reach; qualified views where available.

Define qualified views; separate organic from paid delivery.

Did the content create useful interaction?

Saves, shares, relevant comments and their rates.

Use a stated denominator; do not equate a save with a sale.

How did audiences respond?

Comment sentiment by language; sceptical questions; disclosure presence and placement.

Positive comments do not prove effectiveness. [12]

Did people take a next step?

Tagged links, landing-page visits, enquiries or other tracked actions.

Record the attribution window and avoid duplicate counting.

Did the activity support commercial outcomes?

Tracked purchases, leads, revenue and assisted conversions.

Separate attributed outcomes from proven incremental impact.

Should a creator be retained?

Audience fit, delivery quality, repeat outcomes and reliability.

Compare creators within a relevant market and objective.

Running the three-market test

For a programme like the worked example in section 16, begin with three separate discovery pools, apply the same minimum quality checks, and then use local audience and product-availability requirements. During the test, compare asset-level outcomes within each market before pooling results, and use matched comparisons or a holdout when the goal is incremental impact.

Why should LATAM results be reported market by market?

Because pooled results are mostly Brazilian. Brazil holds 66.2% of recorded eligible profiles and between 60.1% and 66.8% of each follower tier, but only 43.7% of estimated Instagram users and 33.3% of the population reference. A roster sampled in proportion to creator supply would therefore report Brazil's engagement, costs and sentiment as the regional average, even for brands whose sales or audiences sit mainly elsewhere. [1]
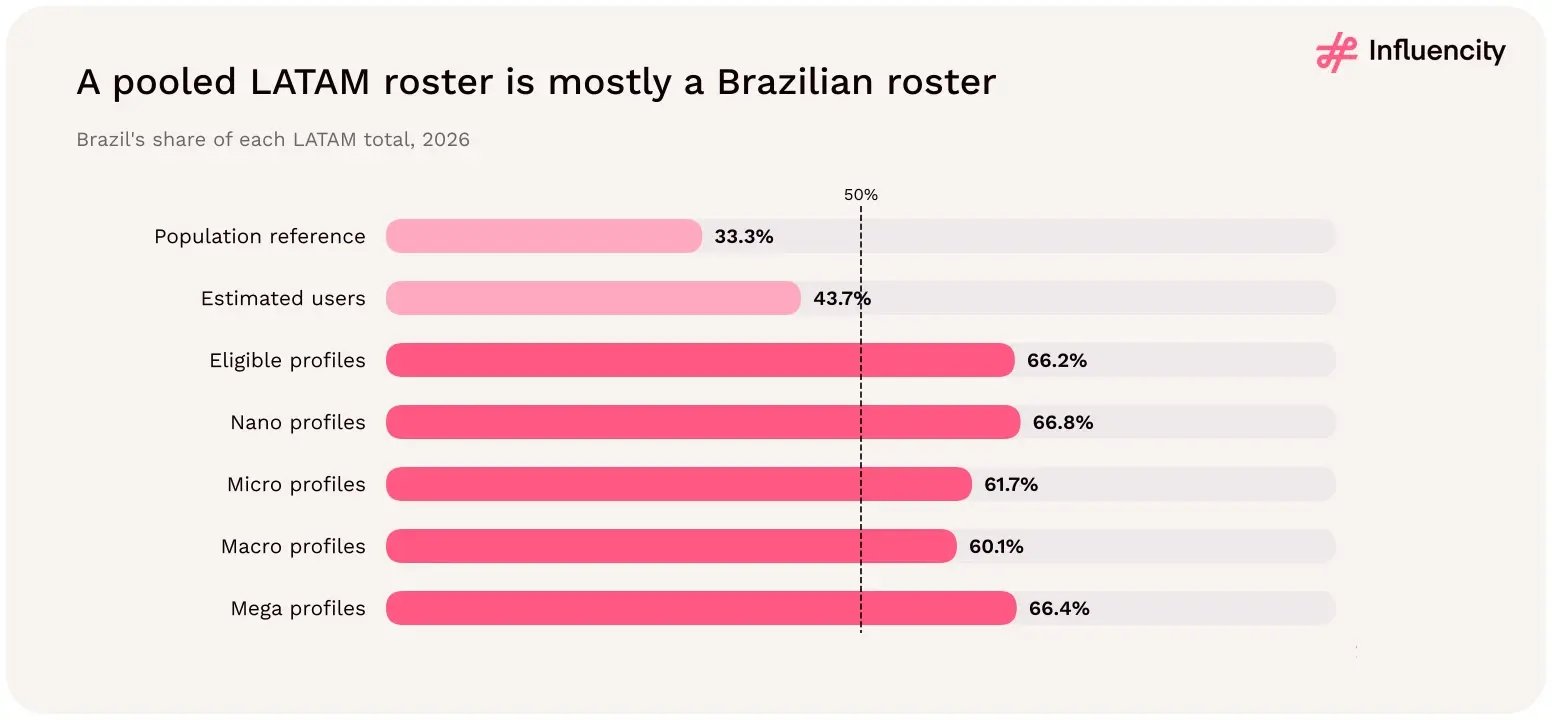
Brazil accounts for 33.3% of LATAM's population and 43.7% of estimated Instagram users, but 66.2% of eligible profiles and more than 60% of every follower tier, from nano to mega.

Figure 55 → Brazil's share of LATAM population, estimated Instagram users, eligible profiles and each follower tier, 2026. Source: [1].

Reporting by market first, then by archetype (section 16), keeps Brazil's scale visible without letting it set every benchmark. Where results are pooled, weight them by the brand's commercial priorities or audience targets rather than by creator counts, and state the weighting. [1]

How should a LATAM measurement plan be structured?

Around six stages, each with its own safeguard: reach, interaction, response, action, outcome and retention. The stages match the planning questions above; the safeguards stop a strong number at one stage being read as proof of the next. Language matters at the response stage, since Influencity's supplements study found Spanish-language comments more positive towards "energy, family, vitality" narratives and English-language ones towards science-based claims, and disclosure matters throughout: clearly disclosed posts performed 12% better on long-term engagement. [12]
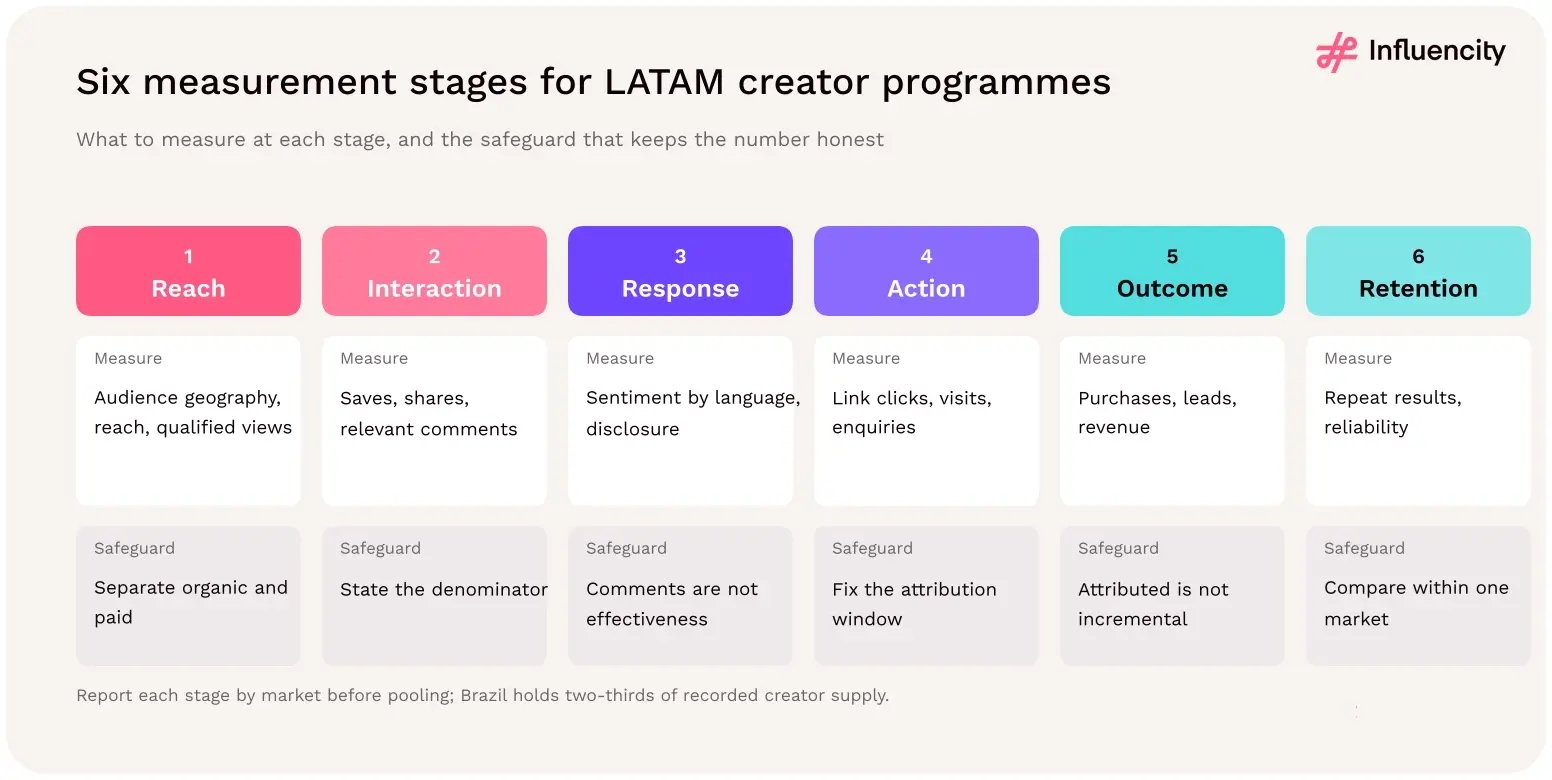
Six measurement stages for LATAM creator programmes, from reach and interaction to response, action, outcome and retention, each pairing a measure with a safeguard such as separating organic and paid.

Figure 56 → Six measurement stages for LATAM creator programmes, with an example measure and safeguard for each. Sources: [1, 12].

For tests, use matched markets or holdouts where incremental impact matters, and size test cells against the local pool: a 50-creator micro cell is about 0.004% of Brazil's 1,212,001 micro profiles but 2.7% of Cuba's 1,852 and 2.3% of Nicaragua's 2,158, so repeated tests in small markets will reuse the same creators. [1]

From study to shortlist

Use the country benchmarks as a starting point, then explore Influencity's influencer discovery tools to investigate potential partners. A database match is the beginning of due diligence, not its replacement. [7]

18 → METHODOLOGY

How was this study built?

This study analyses Influencity's proprietary 2026 Instagram influencer dataset for 20 Latin American markets, which provides market-level profile counts, gender classifications and follower-band records. The analysis is descriptive and aggregate; it is not a survey of creators or a census of professional influencers. Comparison figures come from the companion 2026 studies [8–11] and category studies [12, 13], and niche figures from separate interest tables [14]; none of these is part of the creator dataset. [1]
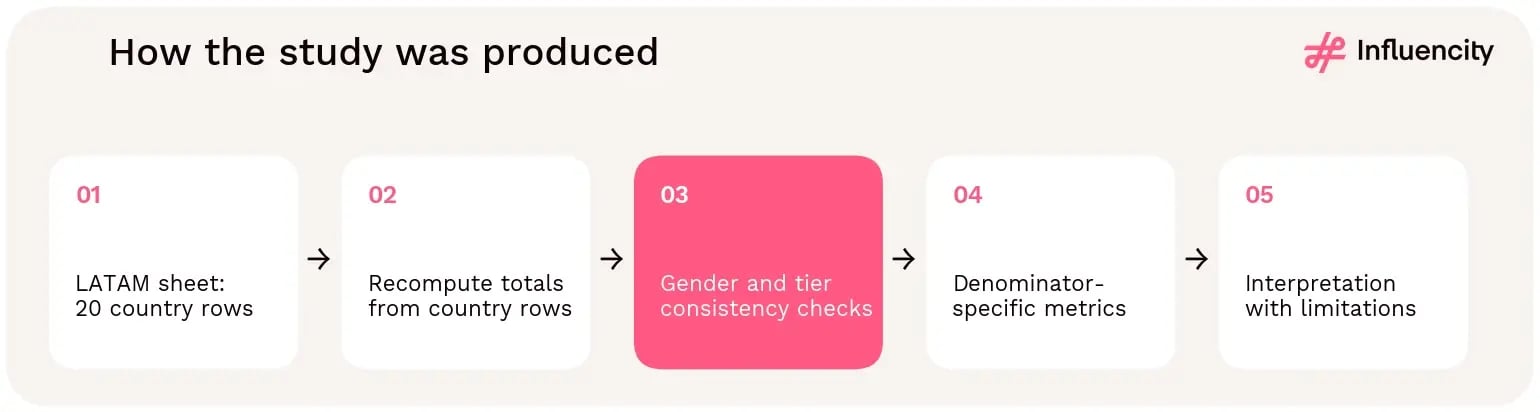
Five steps turn the LATAM sheet of 20 country rows into the study's metrics: recomputed totals, gender and tier consistency checks, denominator-specific metrics and interpretation with limitations.

Figure 57 → How the LATAM dataset becomes the study's metrics. Source: [1].

Scope, eligibility and units

The dataset contains 20 markets: Argentina, Bolivia, Brazil, Chile, Colombia, Costa Rica, Cuba, Dominican Republic, Ecuador, El Salvador, Guatemala, Honduras, Mexico, Nicaragua, Panama, Paraguay, Peru, Puerto Rico, Uruguay and Venezuela. The study uses public profiles meeting Influencity's eligibility filters; the nano category starts at 1,000 followers. A person may operate more than one account, and country assignment does not establish follower location. Estimated users and population are contextual reference fields. The cross-platform comparison in section 11 uses Influencity's TikTok LATAM dataset [2]. Its Cuba record (500 estimated users and 172 eligible profiles) is too small to compare, so Cuba is excluded from market-level platform comparisons. Its Bolivia population field (126,740,000, ten times the 12,674,000 in the Instagram data) is not used; the study uses no TikTok population figures.

Metric

Calculation and denominator

Creator density

Eligible profiles / estimated Instagram users × 100

Audience-to-population ratio

Estimated Instagram users / population reference × 100

Regional creator share

Market eligible profiles / 18,412,413 × 100

Supply-to-audience index

Market creator share / market estimated-user share

Profiles per 1,000 residents

Eligible profiles / population × 1,000 (market sizing and cross-region comparison)

Female share, classified

Female / (female + male) × 100

Unclassified share

No-gender records / headline profiles × 100

Tier share

Tier profiles / eligible profiles × 100 (gender-by-tier shares use tier entries)

Not assigned to a tier

Eligible profiles minus the four tiers

Interest penetration

Interest-tagged profiles / eligible profiles × 100 (interests overlap; not additive)

Interest mix

Interest tags / all interest tags in the market × 100

Female share by interest

Female / (female + male) tagged profiles × 100

Users per eligible profile

Estimated Instagram users / eligible profiles

Profiles with 10,000+ followers

Micro + macro + mega tier profiles; 100,000+ uses macro + mega

Market groups

Brazil; Mexico; Spanish-speaking South America (9 markets); Central America (6); Caribbean (Cuba, Dominican Republic, Puerto Rico)

Other 19 markets

Twenty-market totals minus Brazil; ratios recalculated from the summed components, not averaged

Unweighted market median

Middle value of the 20 market ratios, not weighted by market size

Correlation (r)

Pearson correlation across the 20 market values; descriptive only, not evidence of cause

Reconciliation and limits

All market totals equal their male, female and unclassified components, and regional totals are sums of the 20 market rows. The four tiers leave 30,466 profiles (0.17%) unassigned; every market is within ±0.24% of its headline count, and no tier cell exceeds its gender total (Appendix C). No sampling design, confidence intervals or classification-accuracy metrics are supplied, and no causal claims follow from these counts. [1]

19 → FREQUENTLY ASKED QUESTIONS

LATAM Instagram statistics FAQs

icon-buble-pink-user-fav-conections

How many Instagram influencers are there in Latin America in 2026?

Influencity's 2026 data records 18,412,413 influencer-eligible Instagram profiles across 20 covered LATAM markets. The count is a database-defined profile universe, not a census of unique professional creators. [1]

icon-buble-pink-user-fav-conections

How many Instagram users are included in the study?

An estimated 323,500,000. This is the dataset's audience-estimate field, not verified monthly active users. [1]

icon-buble-pink-user-fav-conections

What is the Instagram creator-to-user ratio in LATAM?

5.69%: 18,412,413 eligible profiles divided by 323,500,000 estimated users. Excluding Brazil, the ratio for the other 19 markets is 3.42%. [1]

icon-buble-pink-user-fav-conections

How many Instagram influencers are there per 1,000 people in Latin America?

28.3 eligible profiles per 1,000 residents across the 20 covered markets, above the US (26.2) and Europe (18.5). Excluding Brazil, the ratio is 14.3 per 1,000. Brazil alone records 56.2 per 1,000 and Mexico 7.9. [1, 3, 4]

icon-buble-pink-user-fav-conections

How many LATAM Instagram creators have more than 10,000 followers?

2,185,146 eligible profiles (11.9%) have 10,000 or more followers: 1,965,642 micro, 206,608 macro and 12,896 mega. Of these, 219,504 have 100,000 or more. Brazil accounts for 1,344,818 of the 10,000+ pool and Mexico for 153,483. [1]

icon-buble-pink-user-fav-conections

Which market has the largest Instagram creator pool?

Brazil, with 12,182,215 eligible profiles (66.2%). Argentina is second with 1,901,646; Mexico third with 1,037,320. [1]

icon-buble-pink-user-fav-conections

How much of Latin America's Instagram creator supply is in Brazil?

Two-thirds. Brazil records 12,182,215 of the 18,412,413 eligible Instagram profiles in the 20-market footprint (66.2%), compared with 43.7% of estimated users and 33.3% of the population reference. It also holds 66.4% of mega profiles (8,563 of 12,896). [1]

icon-buble-pink-user-fav-conections

How does Brazil's Instagram creator pool compare with the US and Europe?

Brazil alone records more eligible profiles than all 50 US states combined (12.18M against 8.94M) and 98% of Europe's 30-market total (12.41M). Per 1,000 residents, Brazil records 56.2 profiles, against 26.2 in the US and 18.5 in Europe. [1, 3, 4]

icon-buble-pink-user-fav-conections

Which LATAM markets have the most macro and mega Instagram influencers?

Brazil by count, with 132,817 profiles of 100,000+ followers (60.5% of the 219,504 regional total). Relative to pool size, Colombia leads with 19.8 macro and mega profiles per 1,000 eligible profiles, followed by Mexico (18.6) and Peru (18.0), among markets with at least 100,000 profiles. Mexico has the second-largest mega pool (1,374). [1]

icon-buble-pink-user-fav-conections

Which market has the highest creator density?

Brazil at 8.62%, followed by Paraguay (6.19%) and Argentina (6.11%), the only three above the regional benchmark. [1]

icon-buble-pink-user-fav-conections

Which LATAM market has the lowest Instagram creator density?

Cuba, at 0.58% (16,235 eligible profiles against 2.8M estimated users), followed by Guatemala at 0.82%. Five markets are below 2%: Mexico, Nicaragua, Bolivia, Guatemala and Cuba. The unweighted market median is 3.11%. [1]

icon-buble-pink-user-fav-conections

Which market has the highest estimated Instagram penetration?

Chile, at 68.3%, followed by Uruguay at 67.6%. This compares two supplied estimates; it is not verified adoption. [1]

icon-buble-pink-user-fav-conections

Which LATAM markets have the lowest Instagram audience-to-population ratios?

Nicaragua (16.8%), Honduras (17.8%) and Bolivia (18.1%), followed by Cuba (25.6%). Seven markets sit below 35%; together they hold 17.0% of the footprint's population reference but 9.1% of estimated users. These ratios compare two supplied estimates and are not verified adoption rates. [1]

icon-buble-pink-user-fav-conections

Do LATAM markets with larger Instagram audiences have more creators?

Generally, yes. The audience-to-population ratio and creator density are positively correlated across the 20 markets (r = 0.66), but the link is not mechanical: Chile has the highest audience ratio (68.3%) with below-benchmark density (4.43%), while Paraguay records 6.19% density from a 37.8% audience ratio. [1]

icon-buble-pink-user-fav-conections

Are most Instagram creators in LATAM women?

Women represent 61.2% of male/female-classified profiles and 45.6% of all profiles; 25.4% are unclassified. Every market has a female majority within its classified subset. [1]

icon-buble-pink-user-fav-conections

Are most LATAM Instagram mega-influencers men?

Yes, narrowly. Among male/female-classified mega-tier profiles (1 million+ followers), 54.9% are male: 5,719 against 4,691. Mega is the only follower tier with a male majority; women lead in nano, micro and macro. [1]

icon-buble-pink-user-fav-conections

How likely are women and men to reach 1 million Instagram followers in LATAM?

Per 1,000 classified profiles of each gender, 0.56 female and 1.07 male profiles have 1 million or more followers, so men are 1.92 times as likely to reach the mega tier. The ratio is 1.23 at 10,000 followers and 1.40 at 100,000. [1]

icon-buble-pink-user-fav-conections

Which LATAM market has the highest share of female Instagram creators?

Nicaragua, where 65.1% of male/female-classified profiles are female, followed by Bolivia (64.7%) and Honduras (64.4%). Among markets with more than 100,000 eligible profiles, Paraguay (63.9%), Ecuador (62.5%) and Brazil (62.1%) lead. The lowest shares are in the Dominican Republic and Panama (both 54.3%). [1]

icon-buble-pink-user-fav-conections

What percentage of LATAM Instagram creators are nano-influencers?

Nano profiles make up 88.0% of eligible LATAM Instagram profiles (16,196,801 of 18,412,413); 0.17% are not assigned to a tier. [1]

icon-buble-pink-user-fav-conections

How many mega-influencers are there on Instagram in Latin America?

Influencity's 2026 dataset records 12,896 eligible Instagram profiles with 1M+ followers across 20 LATAM markets (0.07% of eligible profiles). Brazil has 8,563, Mexico 1,374, Argentina 908 and Colombia 891; together with Chile, these five markets hold 92.9% of mega profiles. [1]

icon-buble-pink-user-fav-conections

What are the most common Instagram creator niches in Latin America?

In Influencity's 2026 niche data for eight LATAM markets, the most common interests are clothes, shoes and accessories (2,588,305 tagged profiles, 15.0 per 100 eligible profiles) and fitness, yoga and healthy lifestyle (2,496,320; 14.5), followed by beauty and food. Profiles can carry several interests, so these counts overlap. [1, 14]

icon-buble-pink-user-fav-conections

Which niches have the most female and male creators?

Beauty and cosmetics is the most female-skewed (77.5% of male/female-classified profiles are female). Gaming (62.5% male) and electronics and computers (56.9% male) are the only interests with male majorities across the eight markets combined, and both are male-majority in every market covered. [14]

icon-buble-pink-user-fav-conections

What do male Instagram creators in LATAM post about most?

Fitness and wellness. It accounts for 22.4% of male-classified interest tags in the eight markets with niche data, followed by fashion (18.0%) and travel (14.7%). Gaming and electronics are about 2.5 and 2.0 times as prominent in men's interest mix as in women's. [14]

icon-buble-pink-user-fav-conections

Which LATAM market has the most male-leaning creator niches?

Colombia has the lowest female share of classified profiles in all eight interests, including travel, where it is the only market with a male majority (49.2% female). Brazil has the highest female share in five of the eight interests. [14]

icon-buble-pink-user-fav-conections

Is the number of Instagram influencers in Latin America growing?

The reported total has been broadly flat since 2023 (18.41M in 2026 against about 18.9M), after rising from about 12.0M in 2020. Beneath that, supply outside Brazil rose by about 39% between the 2023 and 2026 editions while Brazil's count fell 15.6%. Methods differ between editions, so these are changes in reported estimates. [1, 5, 6]

icon-buble-pink-user-fav-conections

Which LATAM market has grown fastest in Instagram influencers since 2023?

Mexico, among the eight markets with published 2023 counts: from 670,969 to 1,037,320 eligible profiles (+54.6%). Colombia (+30.7%) and Peru (+30.4%) follow; Brazil (−15.6%) and Chile (−1.6%) recorded fewer. [1, 6]

icon-buble-pink-user-fav-conections

How does Latin America compare with the US and Europe?

LATAM has the largest pool (18.41M vs 8.94M in the US and 12.41M in Europe) and the highest density (5.69% vs 4.64% and 4.21%), but most of that lead comes from Brazil; without it, LATAM's density is 3.42%. [1, 3, 4]

icon-buble-pink-user-fav-conections

Which is the largest Instagram creator market across LATAM, the US and Europe?

Brazil. Among the 100 markets in Influencity's 2026 LATAM, US and Europe Instagram studies, it records 12.18M eligible profiles, 4.2 times the next largest, Russia (2.88M). Argentina ranks third (1.90M), ahead of California (1.81M) and the United Kingdom (1.79M). [1, 3, 4]

icon-buble-pink-user-fav-conections

Does TikTok have higher creator density than Instagram in LATAM?

Yes, but only slightly: 6.08% for TikTok versus 5.69% for Instagram, 1.07 times as high. In the US and Europe the ratio is about two times. Excluding Brazil, LATAM's ratio rises to 1.58. [1, 2, 10, 11]

icon-buble-pink-user-fav-conections

Which LATAM markets have more TikTok creators than Instagram creators?

In Influencity's 2026 datasets, TikTok records more eligible profiles than Instagram in 16 of 20 LATAM markets, including Mexico (3.79M vs 1.04M), Colombia (1.96M vs 0.84M) and Peru (1.91M vs 0.22M). Instagram's pool is larger in Brazil, Argentina, Puerto Rico and Cuba. [1, 2]

icon-buble-pink-user-fav-conections

What rules apply to supplement influencer content in Mexico?

According to Influencity's supplements study, COFEPRIS regulates supplement labelling, claims and advertising and prohibits advertising suggesting a supplement can diagnose, treat or cure a disease. Check current COFEPRIS guidance before publishing. [12]

icon-buble-pink-user-fav-conections

Which supplement categories do influencers promote most?

Protein supplements (26% of sponsored posts), multivitamins (21%) and gut health and probiotics (18%), followed by energy boosters (10%) and beauty supplements (8%), in Influencity's 2025 study of 5,000+ posts by US and Mexican creators. [12]

icon-buble-pink-user-fav-conections

Do micro-influencers get more engagement than celebrities in supplement marketing?

Yes, in Influencity's supplements study: creators under 100,000 followers recorded the highest reported average engagement (57%), against 38% for macro creators and 24% for those above 1M (US and Mexico combined, as published). [12]

icon-buble-pink-user-fav-conections

Which LATAM markets are best for scaling Instagram influencer campaigns?

Brazil, Argentina, Colombia and Chile. Each has at least 10M estimated Instagram users and 500 or more profiles with 10,000+ followers per 100,000 users; together they hold 64.0% of users and 80.9% of these profiles. [1]

icon-buble-pink-user-fav-conections

Why is it harder to find Instagram creators in Mexico?

Mexico has 16.6% of LATAM's estimated Instagram users but 7.0% of its profiles with 10,000+ followers: 286 per 100,000 users, against 675 regionally and 951 in Brazil. Plan longer sourcing and wider screening there. [1]

icon-buble-pink-user-fav-conections

How many Instagram influencers will there be in Latin America by 2029?

Influencity's scenarios put the recorded pool at 17.94M to 22.81M eligible profiles in 2029, against 18.41M in 2026. If each side's 2023–2026 trend continued, the total would be about 18.97M, with Brazil's share down from 66.2% to about 54%. These are mechanical scenarios, not forecasts. [1, 5, 6]

icon-buble-pink-user-fav-conections

How should brands measure influencer campaigns across several LATAM markets?

Report each market separately before pooling results, fix denominators and attribution windows in advance, separate organic from paid delivery and track disclosure. Brazil holds 66.2% of recorded creator supply, so pooled LATAM results largely reflect Brazilian creators. [1, 12]

icon-buble-pink-user-fav-conections

Does the study prove which creators or markets deliver the best ROI?

No. It measures recorded supply, estimated audiences and profile characteristics. Campaign costs, conversions, audience overlap and incremental outcomes require separate measurement.

APPENDIX A → MARKET REFERENCE

Complete 20-market audience and creator table

Market

Population reference

Estimated users

Eligible profiles

Creator density

Users / population

Argentina

47,480,684

31,100,000

1,901,646

6.11%

65.5%

Bolivia

12,674,000

2,300,000

38,548

1.68%

18.1%

Brazil

216,700,000

141,400,000

12,182,215

8.62%

65.3%

Chile

19,764,000

13,500,000

597,646

4.43%

68.3%

Colombia

53,250,000

20,900,000

837,150

4.01%

39.2%

Costa Rica

5,480,000

2,600,000

83,597

3.22%

47.4%

Cuba

10,930,000

2,800,000

16,235

0.58%

25.6%

Dominican Republic

11,560,000

6,500,000

259,163

3.99%

56.2%

Ecuador

18,100,000

6,700,000

201,586

3.01%

37.0%

El Salvador

6,380,000

1,900,000

41,090

2.16%

29.8%

Guatemala

18,400,000

8,500,000

69,681

0.82%

46.2%

Honduras

10,700,000

1,900,000

44,166

2.32%

17.8%

Mexico

131,950,000

53,600,000

1,037,320

1.94%

40.6%

Nicaragua

7,140,000

1,200,000

20,582

1.72%

16.8%

Panama

4,520,000

2,800,000

126,199

4.51%

61.9%

Paraguay

6,870,000

2,600,000

161,006

6.19%

37.8%

Peru

34,220,000

10,300,000

221,329

2.15%

30.1%

Puerto Rico

3,190,000

1,600,000

39,517

2.47%

50.2%

Uruguay

3,400,000

2,300,000

126,047

5.48%

67.6%

Venezuela

29,000,000

9,000,000

407,690

4.53%

31.0%

TOTAL

651,708,684

323,500,000

18,412,413

5.69%

49.6%

Source: [1]; totals independently summed. Regional ratios use weighted sums.

APPENDIX B → GENDER REFERENCE

Complete gender counts and classification shares

Market

Male

Female

Unclassified

Female share, classified

Unclassified share, all

Argentina

527,878

784,039

589,729

59.8%

31.0%

Bolivia

10,185

18,701

9,662

64.7%

25.1%

Brazil

3,595,759

5,892,463

2,693,993

62.1%

22.1%

Chile

148,576

202,094

246,976

57.6%

41.3%

Colombia

237,880

321,313

277,957

57.5%

33.2%

Costa Rica

23,427

32,933

27,237

58.4%

32.6%

Cuba

5,578

8,119

2,538

59.3%

15.6%

Dominican Republic

84,870

100,667

73,626

54.3%

28.4%

Ecuador

51,967

86,537

63,082

62.5%

31.3%

El Salvador

11,563

16,166

13,361

58.3%

32.5%

Guatemala

19,924

27,185

22,572

57.7%

32.4%

Honduras

10,652

19,285

14,229

64.4%

32.2%

Mexico

310,557

459,973

266,790

59.7%

25.7%

Nicaragua

5,062

9,457

6,063

65.1%

29.5%

Panama

37,212

44,274

44,713

54.3%

35.4%

Paraguay

43,956

77,686

39,364

63.9%

24.4%

Peru

57,840

88,648

74,841

60.5%

33.8%

Puerto Rico

13,219

17,164

9,134

56.5%

23.1%

Uruguay

34,389

46,142

45,516

57.3%

36.1%

Venezuela

98,419

146,519

162,752

59.8%

39.9%

TOTAL

5,328,913

8,399,365

4,684,135

61.2%

25.4%

Source: [1]. In all 20 rows, male + female + unclassified equals headline profiles.

APPENDIX C → FOLLOWER-TIER REFERENCE

Complete follower-tier counts by market

Market

Nano

Micro

Macro

Mega

Not assigned

Eligible profiles

Argentina

1,692,731

185,782

18,742

908

3,483

1,901,646

Bolivia

34,355

3,762

333

10

88

38,548

Brazil

10,815,790

1,212,001

124,254

8,563

21,607

12,182,215

Chile

518,634

71,666

6,288

238

820

597,646

Colombia

696,955

122,858

15,646

891

800

837,150

Costa Rica

71,917

10,753

715

13

199

83,597

Cuba

14,158

1,852

196

2

27

16,235

Dominican Republic

219,253

35,343

4,110

206

251

259,163

Ecuador

173,820

24,936

2,494

101

235

201,586

El Salvador

35,615

4,928

464

16

67

41,090

Guatemala

60,832

8,139

574

15

121

69,681

Honduras

38,607

4,954

488

14

103

44,166

Mexico

882,427

134,230

17,879

1,374

1,410

1,037,320

Nicaragua

18,246

2,158

142

1

35

20,582

Panama

107,002

17,467

1,545

36

149

126,199

Paraguay

141,733

17,617

1,432

40

184

161,006

Peru

185,036

31,819

3,796

191

487

221,329

Puerto Rico

34,411

4,412

602

52

40

39,517

Uruguay

110,877

14,127

847

34

162

126,047

Venezuela

344,402

56,838

6,061

191

198

407,690

TOTAL

16,196,801

1,965,642

206,608

12,896

30,466

18,412,413

Source: [1]. Tier counts as recorded. 30,466 profiles (0.17%) are not assigned to a tier; every market's tier total is within 0.24% of its headline count, and no tier count exceeds the corresponding gender total.

APPENDIX D → NICHE REFERENCE

Interest tags by market and gender

Market

Interest

Male

Female

Unclassified

Total tagged

Per 100 profiles

Brazil

Restaurants, food & grocery

277,324

451,096

399,593

1,128,013

9.3

Brazil

Coffee, tea & beverages

157,198

230,365

192,101

579,664

4.8

Brazil

Clothes, shoes, handbags & accessories

415,005

840,122

474,008

1,729,135

14.2

Brazil

Beauty & cosmetics

232,248

909,519

210,086

1,351,853

11.1

Brazil

Fitness & yoga + healthy lifestyle

545,399

788,374

355,413

1,689,186

13.9

Brazil

Travel, tourism & aviation

292,576

347,871

135,766

776,213

6.4

Brazil

Gaming

100,761

58,967

71,462

231,190

1.9

Brazil

Electronics & computers

267,305

213,663

210,945

691,913

5.7

Argentina

Restaurants, food & grocery

36,218

46,227

88,973

171,418

9.0

Argentina

Coffee, tea & beverages

26,150

33,411

48,757

108,318

5.7

Argentina

Clothes, shoes, handbags & accessories

51,804

82,225

111,864

245,893

12.9

Argentina

Beauty & cosmetics

29,105

66,575

54,629

150,309

7.9

Argentina

Fitness & yoga + healthy lifestyle

51,146

67,838

87,194

206,178

10.8

Argentina

Travel, tourism & aviation

52,019

56,406

58,354

166,779

8.8

Argentina

Gaming

14,556

9,333

19,953

43,842

2.3

Argentina

Electronics & computers

36,502

23,965

44,107

104,574

5.5

Mexico

Restaurants, food & grocery

43,229

49,863

54,144

147,236

14.2

Mexico

Coffee, tea & beverages

35,958

42,946

36,356

115,260

11.1

Mexico

Clothes, shoes, handbags & accessories

69,648

93,908

59,073

222,629

21.5

Mexico

Beauty & cosmetics

33,000

80,713

32,627

146,340

14.1

Mexico

Fitness & yoga + healthy lifestyle

79,599

90,308

53,590

223,497

21.5

Mexico

Travel, tourism & aviation

72,149

74,964

38,717

185,830

17.9

Mexico

Gaming

17,849

11,423

11,306

40,578

3.9

Mexico

Electronics & computers

41,113

30,812

28,517

100,442

9.7

Colombia

Restaurants, food & grocery

25,797

27,441

46,272

99,510

11.9

Colombia

Coffee, tea & beverages

17,769

18,403

23,694

59,866

7.2

Colombia

Clothes, shoes, handbags & accessories

46,533

60,085

63,290

169,908

20.3

Colombia

Beauty & cosmetics

21,844

51,821

31,037

104,702

12.5

Colombia

Fitness & yoga + healthy lifestyle

55,304

56,212

49,340

160,856

19.2

Colombia

Travel, tourism & aviation

46,413

44,881

36,943

128,237

15.3

Colombia

Gaming

8,752

4,399

8,716

21,867

2.6

Colombia

Electronics & computers

28,011

16,427

25,069

69,507

8.3

Chile

Restaurants, food & grocery

19,043

24,075

41,415

84,533

14.1

Chile

Coffee, tea & beverages

14,004

17,784

23,906

55,694

9.3

Chile

Clothes, shoes, handbags & accessories

27,993

36,799

42,681

107,473

18.0

Chile

Beauty & cosmetics

14,806

36,329

24,386

75,521

12.6

Chile

Fitness & yoga + healthy lifestyle

31,631

37,463

43,684

112,778

18.9

Chile

Travel, tourism & aviation

31,671

33,640

27,121

92,432

15.5

Chile

Gaming

8,716

5,879

10,896

25,491

4.3

Chile

Electronics & computers

19,325

12,960

21,282

53,567

9.0

Venezuela

Restaurants, food & grocery

14,725

19,243

38,493

72,461

17.8

Venezuela

Coffee, tea & beverages

9,509

10,997

19,801

40,307

9.9

Venezuela

Clothes, shoes, handbags & accessories

17,926

28,901

35,159

81,986

20.1

Venezuela

Beauty & cosmetics

9,425

26,820

21,166

57,411

14.1

Venezuela

Fitness & yoga + healthy lifestyle

20,824

25,744

28,595

75,163

18.4

Venezuela

Travel, tourism & aviation

16,721

20,507

19,975

57,203

14.0

Venezuela

Gaming

3,875

2,662

7,887

14,424

3.5

Venezuela

Electronics & computers

10,245

7,240

17,639

35,124

8.6

Paraguay

Restaurants, food & grocery

2,189

2,971

4,448

9,608

6.0

Paraguay

Coffee, tea & beverages

1,581

2,353

2,421

6,355

3.9

Paraguay

Clothes, shoes, handbags & accessories

3,271

5,901

5,805

14,977

9.3

Paraguay

Beauty & cosmetics

1,998

6,506

3,147

11,651

7.2

Paraguay

Fitness & yoga + healthy lifestyle

4,215

5,468

4,104

13,787

8.6

Paraguay

Travel, tourism & aviation

3,274

3,978

2,327

9,579

5.9

Paraguay

Gaming

818

500

1,150

2,468

1.5

Paraguay

Electronics & computers

2,363

1,744

3,403

7,510

4.7

Uruguay

Restaurants, food & grocery

2,449

3,285

6,285

12,019

9.5

Uruguay

Coffee, tea & beverages

1,728

2,316

3,437

7,481

5.9

Uruguay

Clothes, shoes, handbags & accessories

3,761

5,414

7,129

16,304

12.9

Uruguay

Beauty & cosmetics

2,187

5,333

3,520

11,040

8.8

Uruguay

Fitness & yoga + healthy lifestyle

3,852

4,805

6,218

14,875

11.8

Uruguay

Travel, tourism & aviation

3,761

3,948

4,194

11,903

9.4

Uruguay

Gaming

1,063

598

1,309

2,970

2.4

Uruguay

Electronics & computers

2,581

1,651

3,380

7,612

6.0

Source: [14]; per-100 values use eligible profiles from [1]. "Unclassified" corresponds to the "gender neutral" column in the source tables. Interests overlap within each market and must not be summed. Eight-market totals: 17,250,720 eligible profiles; 12,572,450 interest tags.

SOURCES AND ATTRIBUTION

References

[1] Influencity (2026). Instagram LATAM proprietary dataset: estimated users, eligible profiles by gender and follower tier, and population references for 20 markets.

[2] Influencity (2026). TikTok LATAM proprietary dataset: totals of 431,043,500 estimated users and 26,226,153 eligible profiles, with market-level users, profiles, gender and follower-tier counts for 20 markets.

[3] Influencity (2026). Instagram Europe proprietary dataset: 30 markets.

[4] Influencity (2026). Instagram US proprietary dataset: 50 states.

[5] Influencity (2020). The Largest Influencer Study in Latin America. https://influencity.com/resources/studies/instagram-influencer-marketing-latin-america-2020/.

[6] Influencity (2023). The Largest Influencer Study in Latin America in 2023. https://influencity.com/resources/studies/instagram-influencer-marketing-latin-america-2023/.

[7] Influencity (2026). Influencer discovery. https://influencity.com/platform/influencer-discovery/.

[8] Influencity (2026). Instagram Influencer Marketing in the United States 2026 Study. https://influencity.com/resources/studies/instagram-influencer-marketing-united-states/

[9] Influencity (2026). Instagram Influencer Marketing in Europe 2026 Study. https://influencity.com/resources/studies/instagram-influencer-marketing-europe/

[10] Influencity (2026). TikTok Influencer Marketing in the United States 2026 Study.

[11] Influencity (2026). TikTok Influencer Marketing in Europe 2026 Study.

[12] Influencity (2025). The Influence Effect: How Social Media Creators Shape Consumer Perception and Purchasing Behavior in the Supplements Industry. 75 pp. 5,000+ sponsored posts; TikTok, Instagram, YouTube; US and Mexico; January–June 2025.

[13] Influencity (2025). From Feed to Fork: How Foodie Influencers Shape Restaurant Choices in the U.S. 136 pp. 10,568 social mentions; five US states. https://landing.influencity.com/study/from-feed-to-fork-how-america-actually-chooses-where-to-eat

[14] Influencity (2026). Instagram creator-interest tables by market and gender for Brazil, Argentina, Mexico, Colombia, Chile, Venezuela, Paraguay and Uruguay: eight interests in six niches (food, fashion, beauty, wellness, travel, gaming and tech).

Suggested attribution for reuse

Source: Influencity, Instagram Influencer Marketing in Latin America: 2026 Study. State the study footprint, denominator and whether a figure includes Brazil when quoting a statistic.

Original research by Influencity. Data: Influencity proprietary 2026 LATAM dataset (20 markets).