Generally speaking, the most obvious sign that an influencer marketing campaign has been successful is if it has generated (or exceeded) anticipated levels of engagement. That’s why it’s so important to regularly track your engagement metrics.
But what type of engagement should you be analyzing? What’s the best way to do it?
In today’s article, we are going to share a few insights to help you measure and analyze your engagement metrics so that you can optimize the ROI of your influencer marketing campaigns.
Engagement metrics, also known as engagement KPIs, are used to measure the performance of your influencer marketing campaigns. You can use this form of influencer tracking to compare actual performance with your benchmarks and objectives to see whether your campaigns are hitting (or exceeding) expectations. These metrics also provide you with valuable insights that you can use to optimize your current and future campaigns.
So, what do we mean by engagement, exactly?
Engagement can actually mean a few things, depending on the objectives of your campaign. Generally speaking, though, when most people refer to engagement they are talking about the following interactions:
All these interactions reflect the response your content is eliciting from your target audience. It’s important not to focus only on likes: often a quality comment is worth more than 50 likes. Observing the quality of interaction can give you clues about your audience’s real perception. The more engaged online users are with your content, the more likely they are to convert into loyal, paying customers. Plus, the higher your engagement rates are, the wider your campaign reach will be.
Let’s take a look now at 4 common engagement metrics. Using these engagement metrics will give you a clearer idea of how well your campaigns are performing. You can then harness these insights to make any necessary adjustments to your campaigns and optimize your influencer marketing ROI.
We are now going to expand on the above 4 influencer marketing engagement metrics to help you understand how the formulas work. We will also share examples for each metric to give you an idea of how you could use each one to measure the effectiveness of your influencer marketing efforts and make data-driven decisions to optimize your strategies.
This is the most common method used to calculate engagement metrics and it is pivotal for understanding how effectively a post resonates with its audience.
The formula takes the total number of interactions on a post (likes, comments, shares, etc.) and divides it by the total reach of said post (your followers plus anyone else who reached your post through follower engagements). It then multiplies the result by 100 to obtain a percentage that reflects engagement efficiency.
Here’s the formula:
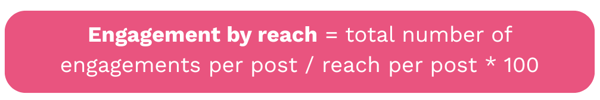
For example, if a post receives 200 interactions and has a reach of 1,000 people, the Engagement by Reach is (200/1000)*100 = 20%. If you see that your engagement by reach is high but your sales aren’t increasing, remember that engagement ≠ direct conversion; still, it gives you clues about your content. This high percentage indicates that the content is engaging to a significant portion of the audience.
This engagement metric formula is used to calculate how many people are engaging with a post compared to your total number of post impressions. Although similar to reach, this differs slightly as it takes into account the fact that your post might reach the same people multiple times.
The formula is as follows:
-3.png?width=600&height=94&name=White%20%26%20Green%20Modern%20Bar%20Chart%20Graph%20(1)-3.png)
For example, if a post garners 300 engagements and appears 2,000 times across various feeds, the Engagement by Impressions is (300/2000)*100 = 15%. Advice: if your ER by impressions is much lower than by reach, try varying your content to make it more “sticky” at first glance. This lower percentage compared to Engagement by Reach might indicate repetitive viewing without additional engagement, suggesting a need for more captivating content.
It’s best to use this formula together with the first formula that we just saw. This will give you a clearer picture of the impact of both reach and impressions on your engagement and you will get a more comprehensive view of content performance.
Cost per engagement is used to calculate how much each engagement costs you. A small tip: compare CPE across different influencers, not just campaigns. This way you’ll see who really gives you more value for your investment. This formula is useful when you are working with an influencer as you can calculate how much of a return you are getting in exchange for the fee you are paying them. In other words, it quantifies the return on investment per engagement of your influencer partnerships.
The formula is as follows:
-Aug-07-2025-08-14-11-7759-AM.png?width=600&height=93&name=White%20%26%20Green%20Modern%20Bar%20Chart%20Graph%20(2)-Aug-07-2025-08-14-11-7759-AM.png)
For example, imagine spending $500 on a campaign that generates 2,500 engagements. The CPE would be $500/2500 = $0.20 per engagement. You can then use this figure to evaluate the cost-effectiveness of your marketing efforts and guide future budget allocations.
Finally, your daily engagement rate helps you determine how often your followers are interacting with your brand on a daily basis, rather than with specific campaign posts. Think of this as a daily thermometer for your community: it tells you if your followers are active or not. This formula takes into account both new and old posts, offering insights into daily audience interaction. So, if a follower engages with an old campaign, it still counts towards your daily engagement rate.
This engagement metric can be useful for identifying how your engagement rate is evolving over time. However, it’s important to note that the formula doesn’t differentiate between one follower engaging 10 times (for example) and 10 followers engaging once.
The formula is as follows:
-Aug-07-2025-08-14-36-0632-AM.png?width=600&height=91&name=White%20%26%20Green%20Modern%20Bar%20Chart%20Graph%20(4)-Aug-07-2025-08-14-36-0632-AM.png)
For example, suppose a brand has 10,000 followers and receives 500 engagements (across all posts) in a day. The Daily Engagement Rate is (500/10,000)*100 = 5%. Tip: if you see your Daily Engagement Rate drop, investigate whether it’s due to lack of interesting content or simply changes in the platform algorithm. This rate indicates how actively followers interact with the brand on a daily basis. While it doesn't distinguish between multiple engagements from a single follower or individual engagements from multiple followers, it's valuable for tracking engagement trends over time so that you can adjust your content strategy accordingly.
Measuring influencer marketing engagement metrics is a crucial aspect of assessing the return on investment (ROI) of your influencer marketing campaigns. These metrics offer tangible data to gauge not just the reach but the actual impact of your marketing efforts on the target audience. By analyzing the influencer marketing engagement metrics we have seen today, brands can gain insights into how their audience interacts with content, which is vital for refining marketing strategies and ensuring the efficient allocation of resources.
So, what insights can you gain exactly?
Firstly, influencer marketing engagement metrics help you understand audience behavior. Metrics like likes, comments, shares, and views provide a clear picture of how the audience is responding to your content. A personal tip: pay attention not only to the number of interactions but also to the sentiment behind them – it tells you what your audience really thinks. This feedback is invaluable for tailoring future campaigns to better resonate with the target demographic, helping you enhance the effectiveness of your marketing initiatives.
Secondly, influencer marketing engagement metrics are key indicators of content effectiveness. High social engagement rates often suggest that content is relevant, relatable, and valuable to the audience. Consider asking yourself: “Which posts are my audience actually excited about?” This reflection can guide your content strategy and boost future engagement. This information can guide brands in creating more of what their audience wants, leading to increased brand loyalty and customer retention.
Moreover, influencer marketing engagement metrics help you measure influencer performance. By tracking these metrics, brands can identify which influencers are driving the most engagement and contributing significantly to a campaign's ROI. Pro tip: sometimes a micro-influencer with high engagement brings more value than a celebrity with low interaction rates. This helps you make informed decisions about future collaborations.
Finally, analyzing influencer marketing engagement metrics enables cost-effective marketing. By understanding which content drives the most engagement across different platforms, brands can allocate their budgets more efficiently, focusing on high-performing strategies and influencers that maximize ROI. Remember: not all engagement is equal – prioritize quality over quantity to truly improve campaign results.
You can gain additional insights into your engagement metrics by using Influencity’s Engagement Rate Scale. This innovative tool, which you can access directly from your Influencer Relationship Management (IRM) dashboard, puts an influencer's engagement into context by comparing it to influencers with similar community sizes.
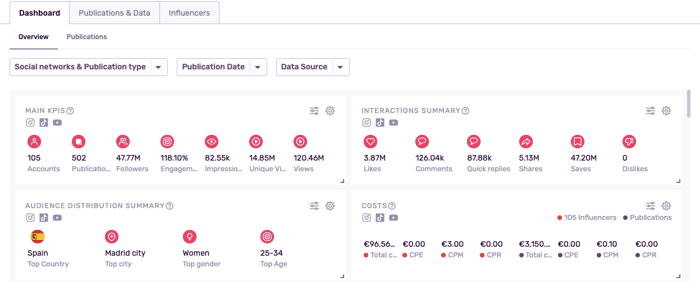
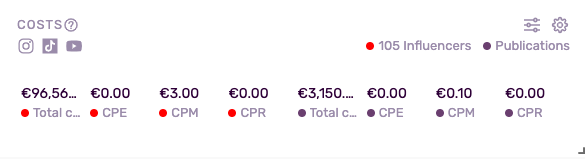
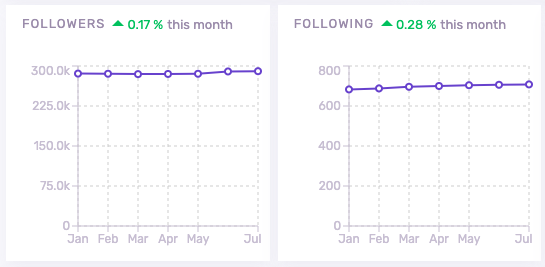
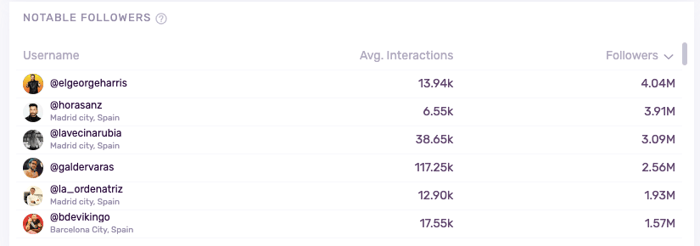
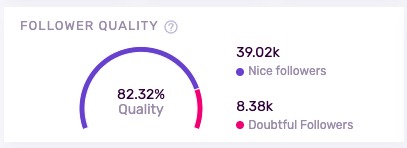
Not only that, but Influencity’s platform also provides you with the following additional performance metrics:
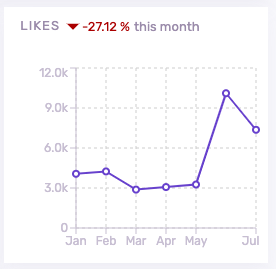
Tip: rapid spikes or drops can indicate viral content or controversial posts.
Influencity's platform also equips users with robust reporting tools, enabling detailed comparisons at four critical levels:
Ultimately, by leveraging Influencity's comprehensive analytics, brands can not only track and measure the success of their campaigns but also fine-tune their marketing strategies to ensure that they are aligned with audience preferences and market trends, leading to more effective and impactful influencer collaborations. By focusing on the right engagement metrics, you can maximize your ROI while building meaningful connections with your audience.


%20and%20How%20Can%20They%20Benefit%20Your%20Brand%20article.jpg?length=628&name=What%20Are%20Key%20Opinion%20Leaders%20(KOL)%20and%20How%20Can%20They%20Benefit%20Your%20Brand%20article.jpg)