I’ve seen it happen too many times. Brands invest in influencer marketing campaigns, drive engagement, and even boost sales, but when budget season arrives, their funding gets cut. Why? Because they’re still reporting on likes, shares, and impressions instead of providing measurable business impact. If executives don’t see influencer marketing as a revenue driver, they’ll withhold increases or shift budget to other channels that do.
If you’re still using outdated reporting methods, it’s time to take a closer look at what you can track and analyze today. The amount of data available has exploded. We now have benchmarks, deep analytics, academic research, and the ability to track and report on influencer-driven revenue.
With influencer marketing spending set to hit $32 billion in 2025, the question isn’t whether it delivers value—it’s whether you can prove the value it brings to your business. In this guide, I will show you how to:
By the end, you’ll have a framework for reporting influencer marketing success in a way that secures the budget you need to grow.
1. Before You Plan: Align Your Campaigns Goals
Before you even start planning, take a step back. Does your campaign type actually match what you’re trying to achieve? One of the biggest mistakes I see? Brands setting campaign goals that don’t line up with their objectives. You can’t run an awareness campaign and expect direct sales. You can’t launch a conversion-focused campaign and call impressions a success. Your campaign type needs to match your business objective—before you ever spend a dollar.

Here’s how different campaign types align with different goals:
Before setting KPIs, ask yourself:
If your campaign type and objectives don’t align, your reporting won’t tell the full story, and you’ll struggle to prove the impact when it’s time to secure a bigger budget.
Setting the right goals is only half the battle. To secure budget and prove impact, your reporting needs to connect those goals to measurable business outcomes. That starts with a well-structured report.
Organize your report to tell a clear, data-driven story that aligns influencer marketing with business priorities. Follow this proven framework:
Kick things off with a sharp, to-the-point summary that immediately highlights impact. Here’s an example:
‘This campaign set out to reduce Customer Acquisition Cost (CAC) below $100 and delivered. With a CAC of $95, the campaign proved influencer marketing as a cost-effective, high-ROI channel worth further investment.’
What to include in your overview:
Provide a strategic breakdown of the campaign. The goal of this section is to clearly define the campaign’s structure, ensuring stakeholders understand how it was designed to achieve business objectives.
Campaign Overview Example:
Influencer-Generated Content (IGC) vs. Brand Creative Test
Objective: This campaign tested whether influencer-generated content (IGC) outperformed brand-produced creative in Meta ads in terms of engagement, cost efficiency, and conversions. The goal was to determine if IGC can drive lower customer acquisition costs (CPA) and higher return on ad spend (ROAS), providing data to support future budget allocation.
Goals & KPIs
1,000 Purchases with a CPA of $12-$15
2.5x ROAS on influencer-led ad creatives
CPC lower than brand-produced creative
Click-Through Rate (CTR) > 1.5%
Conversion Rate from influencer traffic > 2%
Testing & Optimization Strategy
A/B Test: IGC vs. brand creative in Meta ads
Content Variations: Different influencer styles, hooks, and CTAs
Audience Insights: Identify top-performing influencer segments for future investment
Treat every campaign as a learning opportunity. Your results report more than just about proving past success—it’s a tool for refining future strategy. Show stakeholders what you tested, what worked, and what adjustments you’re making for even better results. A test-and-learn mindset is how the best brands maximize long-term impact.
Influencer Selection

Content Strategy
Invest Summary
What to provide in the Campaign Overview
Objectives
![TEMPLATE Influencer Marketing Campaign Proposal Template [+Playbook] Create professional, winning pitches to secure your next big campaign.](https://no-cache.hubspot.com/cta/default/3449185/interactive-186850340410.png)
This is where you share the hard data segmented into five key performance areas. The goal of this section is to provide quantifiable evidence of the campaign’s effectiveness, helping stakeholders assess impact and future opportunities.
Reach & Awareness Metrics to Report:
The most effective reach and awareness metrics combine absolute reach (total people reached) with efficiency metrics (cost per reach) in a simple visual format that requires minimal explanation. For executives, always include a one-sentence conclusion that clearly states which platform (e.g., TikTok, Instagram, etc.) delivered the best awareness results for your specific campaign.

Engagement Metrics to Report
Because engagement metrics can seem fluffy without context, the most effective way to normalize engagement data and use it as a basis for decision-making is to use Cost Per Engagement (CPE). This metric tells how much you spent to generate each meaningful interaction. Below are the engagement metrics to consider including in your report.
Conversions & Business Metrics to Report
Executives need to see the direct line between influencer activity and bottom-line results. These metrics translate social buzz into tangible business outcomes that resonate in budget meetings.
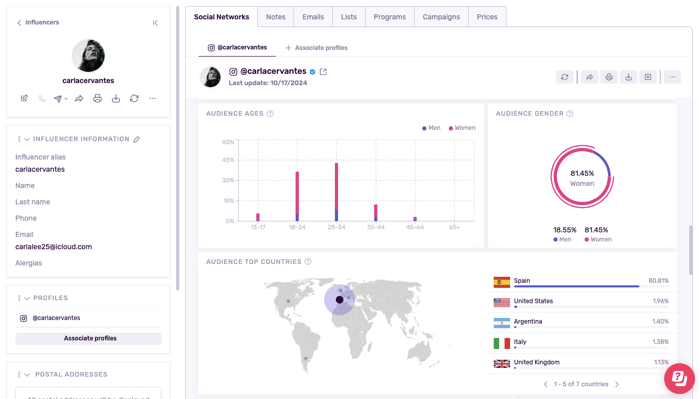
Audience Insights & Targeting Metrics to Report
Smart budget allocation requires knowing exactly who you're reaching. These metrics show you're growing audiences and reaching the right ones.
ROI Calculation & Budget Justification Metrics to Report
The ultimate test of any marketing channel is its financial performance. These metrics transform your influencer program from a cost center to a proven revenue driver deserving increased investment.
Even the best data becomes meaningless if stakeholders can't quickly interpret what they see. Creating visualizations turns your raw numbers into evidence that supports your budget requests. Here's how to make your data both digestible and persuasive when reporting on influencer marketing success.

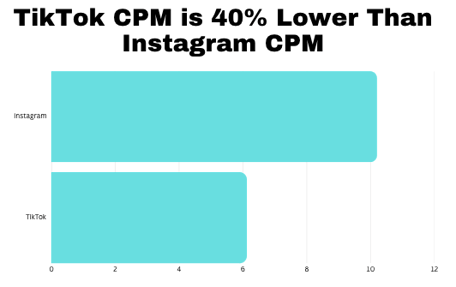
Make your insights unmistakable by stating conclusions rather than hoping viewers will draw the right conclusions themselves:
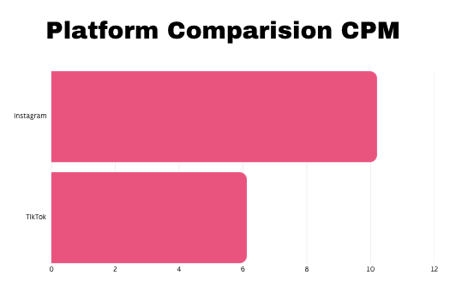
The right chart makes it easier for stakeholders to understand your results. Bar charts are great for comparing platforms or influencer tiers, while line graphs show trends over time. If you want to see relationships—like how follower count affects engagement—scatter plots can help. For bigger data sets, heatmaps highlight patterns, and bubble charts display multiple factors at once, such as platform, reach, and cost.
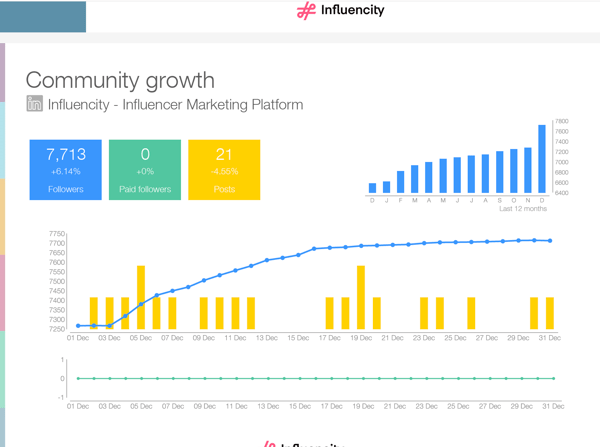
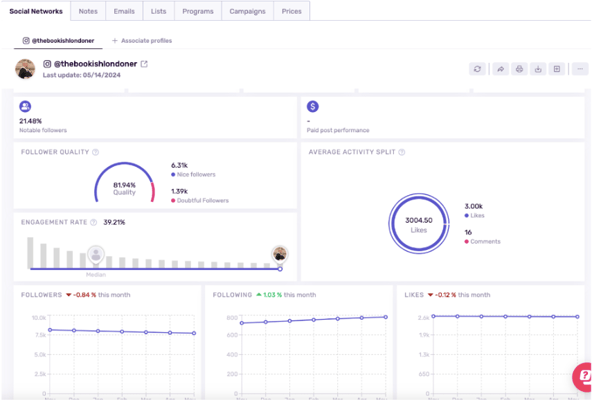
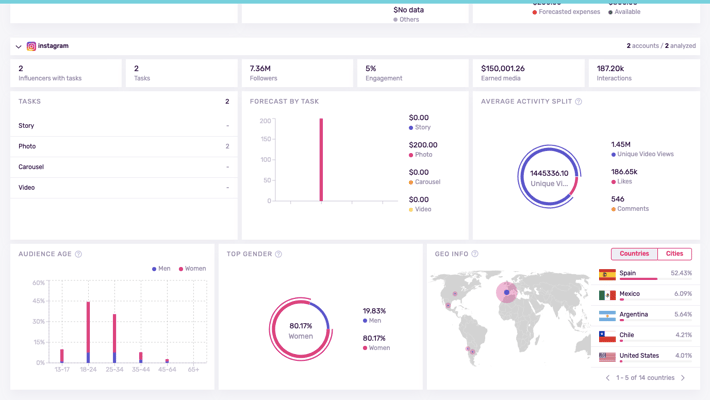
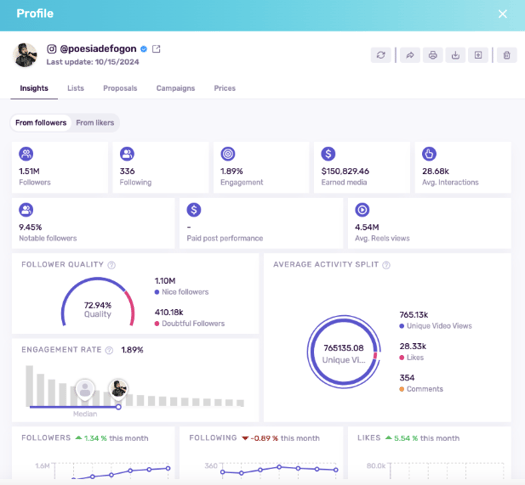
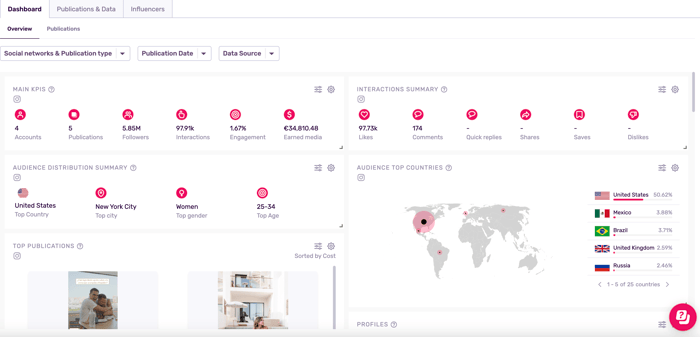
Influencer marketing platforms like Influencity make this process even easier. Instead of sorting through spreadsheets, these tools automatically turn your campaign data into clear, easy-to-read charts. This helps brands and agencies show the connection between reach, engagement, conversions, and ROI—making reports more visual and persuasive. With automated reporting, you can save time, reduce errors, and create data stories that decision-makers understand at a glance.
The best charts are simple and easy to understand. Each one should highlight just one key message instead of trying to show everything at once. Use consistent colors so stakeholders can quickly recognize platforms or metrics. Remove anything that doesn’t add value, like extra gridlines or decorative details. Finally, sort your data in a way that makes sense—by performance, not just alphabetically—so the most important insights stand out.
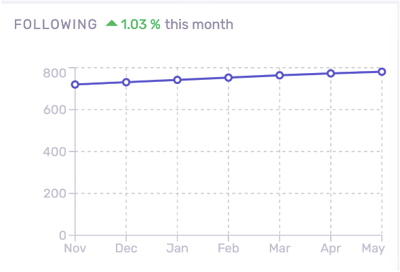
Focus on trends, not just single data points. A line graph showing growth over time is more powerful than a snapshot of one month’s results. Add benchmarks like industry averages, past campaign performance, or other marketing channels to give your numbers meaning and help stakeholders see the bigger picture.
Remember that the goal of data visualization isn't just to display information—it's to build your case for an increased budget. Don't make stakeholders work to understand your success; spell it out visually and verbally in ways that connect directly to business outcomes they care about.
Are you getting spreadsheet anxiety just thinking about content marketing success reports? Your worries can stop today. Much of this reporting can be automated with a tool like Influencity. Not only does automation save time, but it reduces errors.
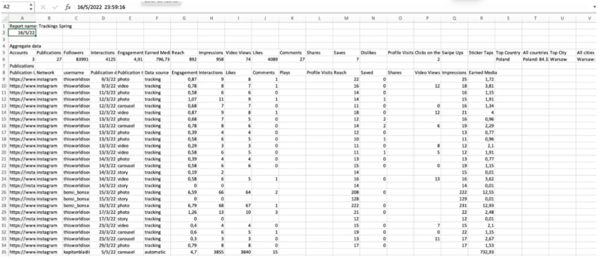
Campaign Level Data
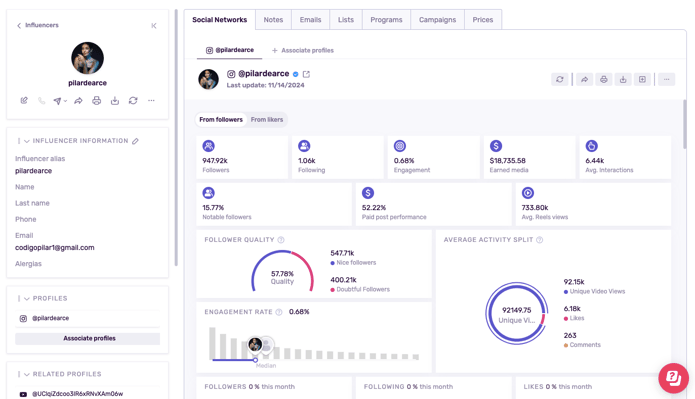
Influencer Level Data
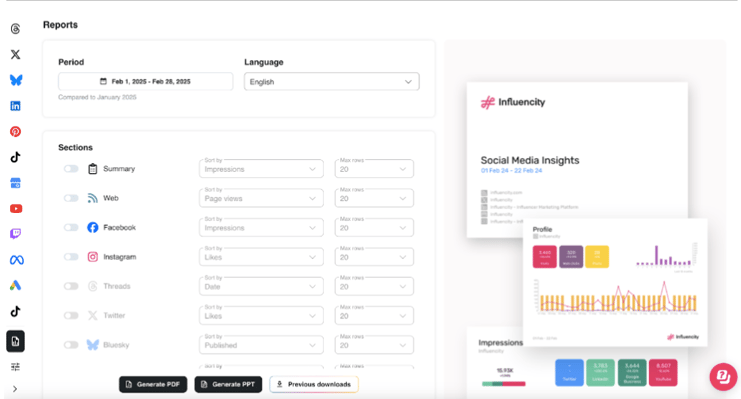
Exporting Reports Instantly
Generate Excel or PDF reports for your files, or for sharing with a client or co-worker. Want to get really fancy with your data analytics and visualizations?
Audit Your Current Reporting Strategy
Implement a Real-Time Reporting Dashboard
Present a Budget Justification Plan
One of the best budget strategies I learned from working with a well-known haircare brand: If you only have one opportunity per year to make your case for an influencer marketing budget, structure your request to include pre-authorization to scale.
Instead of requesting a fixed budget upfront, build in flexibility by securing approval for additional funding if your test meets specific performance benchmarks. For example, if a campaign achieves a CPA under $12, you automatically receive extra budget to scale it—without waiting for the next budget cycle.
Decision-makers are far more likely to approve data-backed expansions of successful campaigns than large upfront investments. By structuring budget requests this way, you create a clear path for growth while ensuring you can act quickly on high-performing strategies.
Success with influencer marketing content delivers big business impact. With data-driven reporting, you can prove it and take your investment and business results to a new level. By using a structured report that aligns with business goals, clear, compelling data visualization, and Influencity’s automation tools for real-time tracking and reporting, you position influencer marketing as an essential, scalable, and high-ROI channel.
Ready to transform your influencer reporting?


%20and%20How%20Can%20They%20Benefit%20Your%20Brand%20article.jpg?length=628&name=What%20Are%20Key%20Opinion%20Leaders%20(KOL)%20and%20How%20Can%20They%20Benefit%20Your%20Brand%20article.jpg)